Bulls start the day with a gap-up. Can it last?
Our View
I don’t know if you were at the MTS webinar, but it was a lot to take in. The bulls and bears made their case, but to be honest…I just don’t know.
What I do think is the ES has rallied over 200 points from Last Wednesday’s low. While I still think there is more upside, I’m also going to remain guarded (let’s not forget the larger trend right now).
Now more than ever, it seems like there is so much information to parse through. Even if we tune out 99% of the BS, there is still a lot of market information to get through. For instance, net short positions against the S&P 500 futures by hedge funds reached a record $107 billion this week and since the S&P 500′s June low, short sellers ended up covering $45.5 billion of their short positions.
Further, on Friday Bank of America said that investor sentiment has hit rock bottom — “an indication that markets look oversold and investors should start buying again, analysts said.”
So there are a couple contrarian considerations from the information above. Then we also consider the fact there are billion-dollar buy-and-hold investors, including: State pension funds, 401K contributions, college endowment funds, teacher funds, police and firemen funds, etc. They never sell and end up buying more when the markets sell off.
Gas prices and inflation have been cooling, which is another positive. While the markets can run, they cannot hide from higher rates, higher inflation, a hawkish Fed and global central banks, and what could end up being a very cold winter for Europe after Putin cut off natural gas supplies.
Like I said in the webinar, one thing investors seem to not be considering is a range-bound scenario, where the S&P doesn’t go to new lows but doesn’t power to new highs, either.What if we just trade in a 400 to 500 point range through year-end (or longer)?
Also, no one is talking much about the stock market’s prospects for 2023. The PitBull said that the Democrats are doing everything they can to appease the public so they can keep the upside move intact. Makes sense and I don’t disagree, but as much as I want to say the worst is behind us… I just can’t. Not yet anyway.
Our Lean
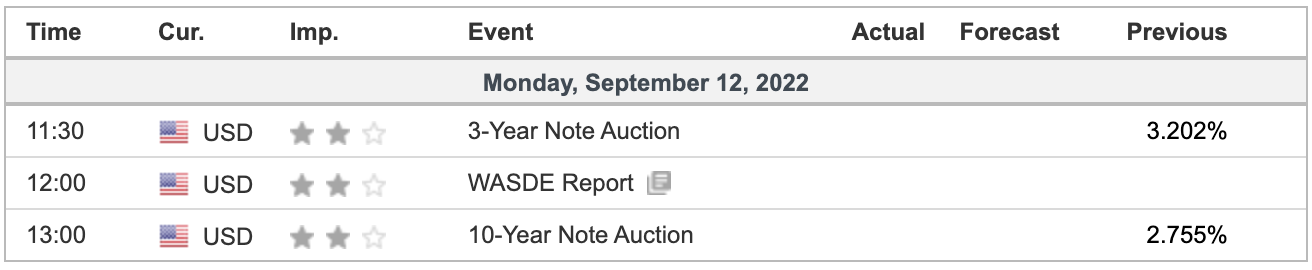
Last week, the Fed did not give any indication that it was letting up on its rate-hiking spree and hawkish rhetoric. We’ll see how the market handles Tuesday’s CPI and Wednesday’s PPI numbers and of course, on Friday we have quadruple witch expiration.
Without getting too overwhelming, we then have the Fed next week and then quarter-end in about two weeks. These are the main events of the month and they are also the driving force pushing the stock market higher.
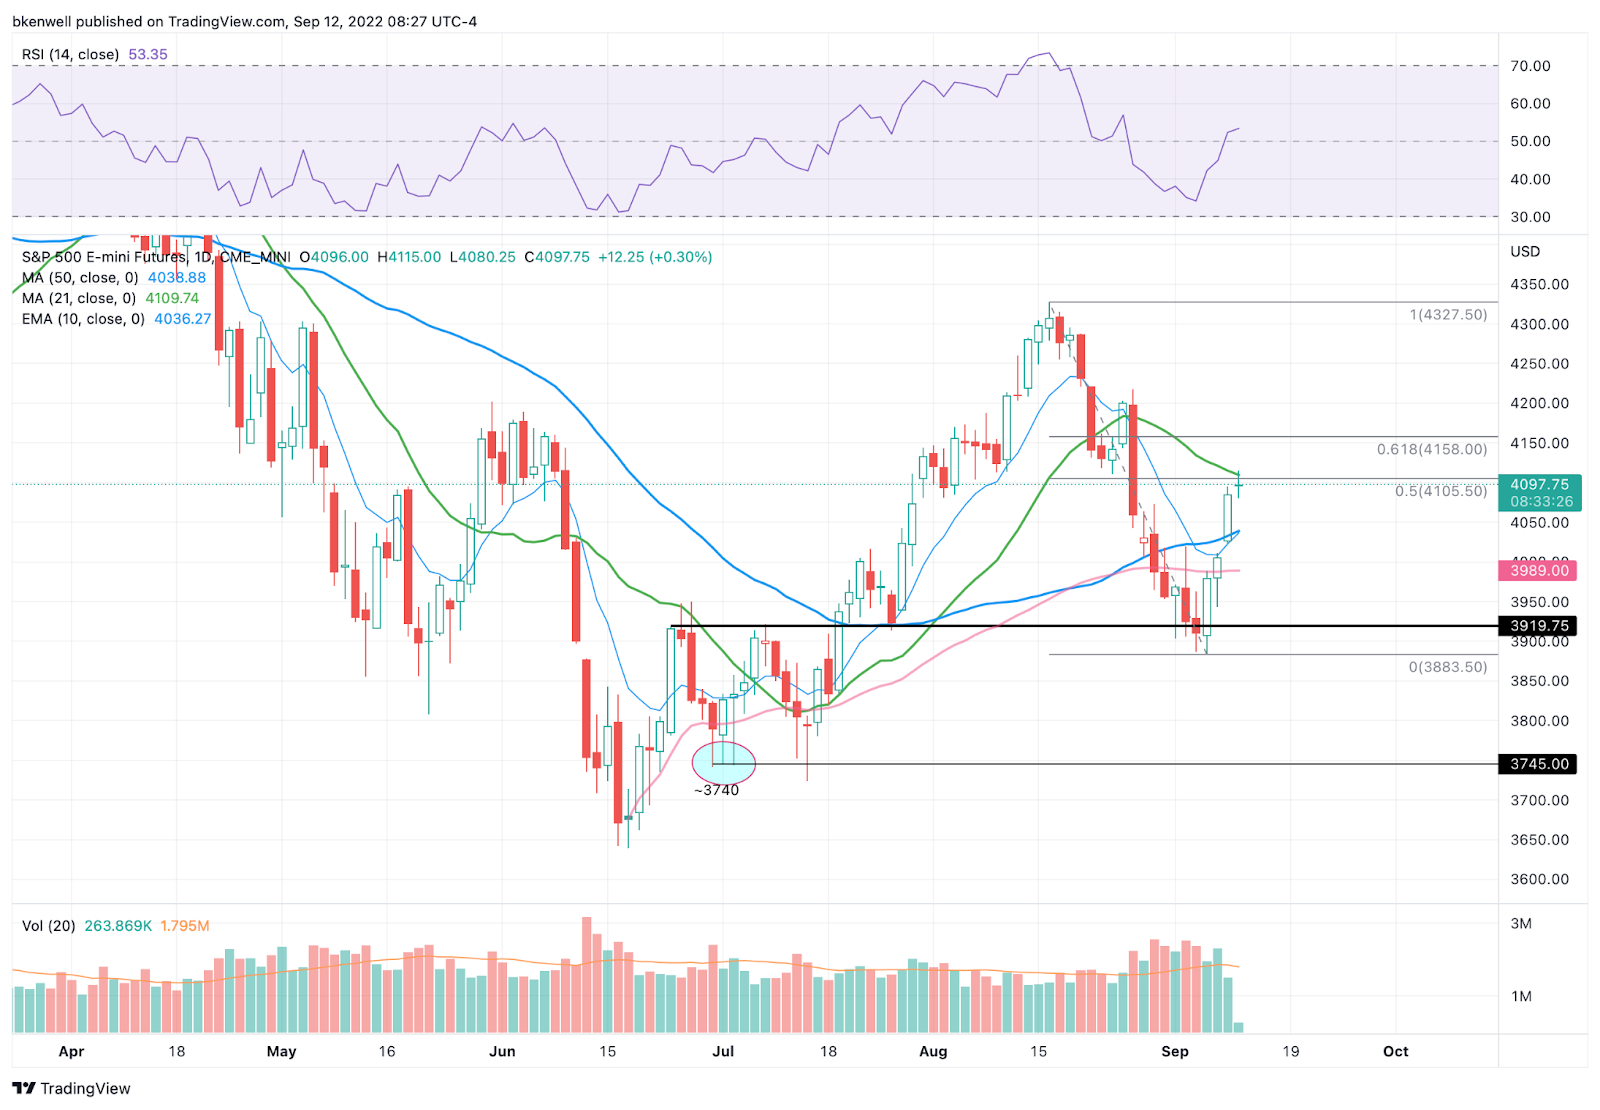
Our Lean: Currently, the ES is trading 4090 at 7:54 am ET this morning. On the upside, we can see 4125, then 4138-4140 in the ESU (Sept. contract). Above that, there is not a lot of immediate resistance to my eye. You can sell the early rallies and buy the pullback or just be patient and buy the pullbacks, meaning any 30 to 60-point pullbacks.
The longer term trend may be troubling, but the short-term trend has bulls in control. Until that fails, we can remain cautious bulls.
Technical Edge
- NYSE Breadth: 91% Upside Volume (!!)
- NASDAQ Breadth: 78% Upside Volume
- VIX: ~$24.50
Game Plan: Bonds, Dollar S&P, Nasdaq
Coming into Monday of a busy week with CPI and PPI on tap on Tuesday and Wednesday and quad-witch expiration on Friday.
In that sense, we don’t want to be too active, yet at the same time, I like to move early in the week on quad-witch weeks and get out of the way for the messy action we typically see later in the week.
We had an 80%+ upside day on Wednesday, then a 91% upside day on Friday. That’s pretty damn impressive, although the S&P is wandering into an area of possible resistance, which we’ll outline below.
S&P 500 — ES
Amazing effort by the S&P and Nasdaq last week. After Friday’s 90%+ upside day and no horrific news over the weekend, it’s no surprise to see an opening push on Globex.
Now looking at the chart though, we have the ES pressing into the 50% retrace near 4105 and the declining 21-month moving average.
At the very least, that should give bulls some pause I would think.
The 50% retracement of this rally is 3999-and-change — so call it 4000. I don’t know if we see that, but 4040 to 4050 (the 10-day and 50-day moving averages) wouldn’t be an unreasonable resting point.
If we take out the Globex high of 4115 and power higher, don’t rule out a move to 4150 to 4160 (the 61.8% retracement).
Below Friday’s high of 4095 and I want to give this some time to see which direction gains momentum. Use that as your pivot.
SPY

Keep an eye on $410 to $411 on the upside.
As for a pivot, watch Friday’s high and last week’s high of $407.51 — call it $407-half.
A gap-up above that area may well get us a gap-fill back to this level. However, it may give us an outright short against the SPY’s high of day (assuming it’s a reasonable risk amount).
We’ll see, but use this level as your go/don’t go on the SPY.
As I mentioned on the webinar, a 2x weekly-up rotation that doesn’t unwind could give bulls more momentum. Otherwise, I’m a toe-in-the-water bull and that’s it.
Nasdaq — NQ

This one is a little bit of finesse, because over 12,709 (a 2x weekly-up rotation) and the NQ is bullish.
However, a move back below 12,709 (or 12,700 for those that like it “simple”) and some traders may be looking for a short if they can stomach an 85+ point stop-loss here.
That’s a decent cash-flow setup, but more specifically, I am looking at the 12,830 area as a sell.
There we have the declining 21-day moving average, the 50% retracement and a clear zone of prior support that’s not acting as resistance. Above this zone does put 13,050 in play, but it’s a great R/R setup. We’ll know right away if we’re wrong.
Nasdaq — QQQ

On Friday, I said we’re watching the $306 area as possible resistance, while the QQQs did a good pushing a bit through this zone.
Gapping up slightly over the $307.09 area now, watch this level as a potential pivot in the morning session.
The strong R/R sell zone is ~$312.50, for all the same reasons as the NQ. I just don’t know if we’ll get to either of those.
Ford

Look for a sustainable move over $15.70, which would give Ford stock an inside-and-up weekly rotation. We flagged the healthy action in this one last week and now want to see a rotation over $15.70 that doesn’t reverse.
If that’s the case, we can look for a long against this week’s low and fish for $16.25 to $16.50 as our first upside target.
NVDA

I absolutely love NVDA most of the time, but this is a look of a bearish setup, as it tries to rebound but has the declining 10-day moving average coming into play (active resistance), the gap-fill level near $149.50 and prior support from July that could potentially act as resistance.
Of course, a close over $150 could open the door to $160 to $165, but we’re going to look at the trend (bearish) first.
Go-To Watchlist — Individual Stocks
*Feel free to build your own trades off these relative strength leaders*
- Numbered are the ones I’m watching most closely.
- Bold are the trades with recent updates.
- Italics show means the trade is closed.
LNG — I still want to see ~$150!
- UUP — Down to ¼ position as we hold for potentially higher prices. Raise stops to $28.40 to $28.50. Look for $30 on the last piece.
- TMUS — We’re down to a ½ to ⅔ position after a great response. B/E Stops and if at ⅔, can trim on any move above $148. Ideally looking for $149.75 to $150+ next.
- Conservative bulls can inch up their stop-loss to $142-ish, but I like a B/E stop for now.
- CHRW — Got our first target of $114.50+ | I still like a stop of $111 to $111.40 and $116 as our next target to get down to a ½ position
- CHNG — Consider taking the last piece off at $25.75 to $26 or simply hold against a B/E or better stop and ride the trend higher. #Kudos
- OXY — Opening push on Buffett upping his stake, investors can trim as we will be near B/E on the position or they can ride against a $63.50 to $63.75 stop-loss. Three strong lows to measure against last week between $64 and $64.40.
Relative strength leaders →
Man, Solar came to life yesterday didn’t it? Not surprising as these names litter our top 5.
Top:
- CAH
- TAN
- ENPH
- FSLR
- LNG — Looking for a retest of the $150 area!
- CNC
- F
- XLU
- XLE
- OXY
- BMRN
- PWR
- CHNG
- CELH
- COST
- UNH
Economic Calendar
Comments are closed