Looking for the Thursday Low
Follow @MrTopStep on Twitter and please share if you find our work valuable!
Our View
As always, no one knows for sure what the S&P is going to do next but what I can say is that this is starting to look like the 2000 Tech Bubble. Don’t get me wrong, the trend is your friend until further notice but the NQ is up 165% since its 2020 Covid-19 lows, up 69% from its 2022 lows, and up 65% from 2023 low. A strong showing from most of the “Magnificent 7” stocks helped push major indexes into the green with Microsoft up 0.9 % to a new all-time high after touching a market capitalization above $3 trillion during trading. It’s hard to pick a top when you have things like that going on. I want to be specific, I don’t know if the ES has made a high yet but if it hasn’t, I think it comes within a few days which could be next week. I am not looking for a crash, I am looking for a 50% retracement off the 4729.25 low so we are talking 100 points at the current high.
Our Lean
I am not here to step in front of a freight train but the higher we go, the higher the probability of a pullback/sell-off. Our lean is to look for the Thursday low before the Friday option expiration. I don’t know if that low comes in on Globex tonight or during the day session. If the ES gaps lower on volume of 250k contracts traded or higher, I’m buying the open and would look to sell any 20- to 30 -point rallies. If the ES comes in higher, I’ll look at selling the open but that’s been a tough trade.
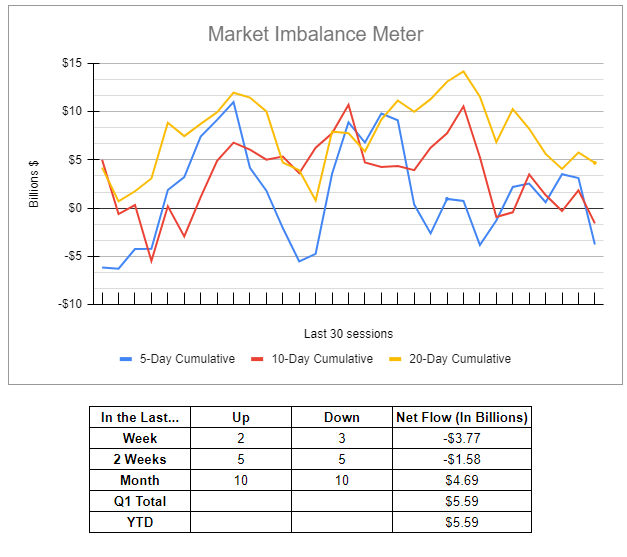
NYSE 3:50 ET Order Imbalance
Did the $ 4 Billion for Sale Sell the ES Off?
I want to point something out. Yesterday the ES and NQ rallied to new highs and sold off and the NYSE Imbalance showed $4B to sell. There are some things I think I know and some things I know and the $4B to sell showed up right after the ES traded 4933.25 at 1:00. That was when the real sell programs started showing and continued right into the 4:00 cash close. I have a question, do you think the ES would have sold off if there was $4B to buy? I don’t think so. Several firms had part of the order, it gets leaked by some then sell programs start and with the ES up so much the downside becomes easy pickings.
I am not going to be posting the imbalance on the close anymore. If you are a paid subscriber for the Opening Print, I have lowered the price down to $75.00 for the imbalance meter.
MiM and Daily Recap
After Tuesday’s late session rally, the ES traded up to 4924.50 on Globex. After the open, the ES traded 4823.50 and sold off down to 4909.00 at 10:05 and then rallied up to 4831.75 at 10:46. After the high the ES pulled back to 4920.00, rallied up to another new all-time contract high at 4933.25 at 1:00, sold off down below the vwap to the 4920 level, rallied back up to 4927.25 and then dropped down to a new low at 4914.25 at 1:52. After this low, the ES rallied a few points then got slapped down to a new low at 4904.75 at 2:25, back and filled off the low, rallied up to 4916.00 at 2:52, dropped down to 4907.50 at 3:02, and then a bug sell program hit that pushed the ES down to a new daily low at 4899.00 at 3:46. After the low, the ES rallied up to 4909.00 at 3:45, traded 4899.25 as the NYSE 3:50 order imbalance showed $4 billion to sell, and traded 4898.25 on the 4:00 cash close. After 4:00, the ES traded up to 4901.75 and settled at 4901.50, up 6.5 points or +0.13%. The NQ closed up 99 points or up 0.56% on the day.
In the end, I turned bullish but cautious on Monday and repeated it in the LEAN the last two days. There are just too many bulls buying at new all-time highs. The ES and NQ sold off but does that mean the high is in? I’m not sure about that but what I am sure about is the NASDAQ and S&P being very overbought and over extended. In terms of the ES’s overall tone, it was firm in the first part of the day and then dropped. In terms of the ES’s overall trade, volume was higher, 233k traded on Globex and 1.288 million traded on the day session for a total of 1.521 million contracts traded.
Technical Edge
-
NYSE Breadth: 44% Upside Volume
-
Nasdaq Breadth: 37% Upside Volume
-
Advance/Decline: 44% Advance
-
VIX: ~13
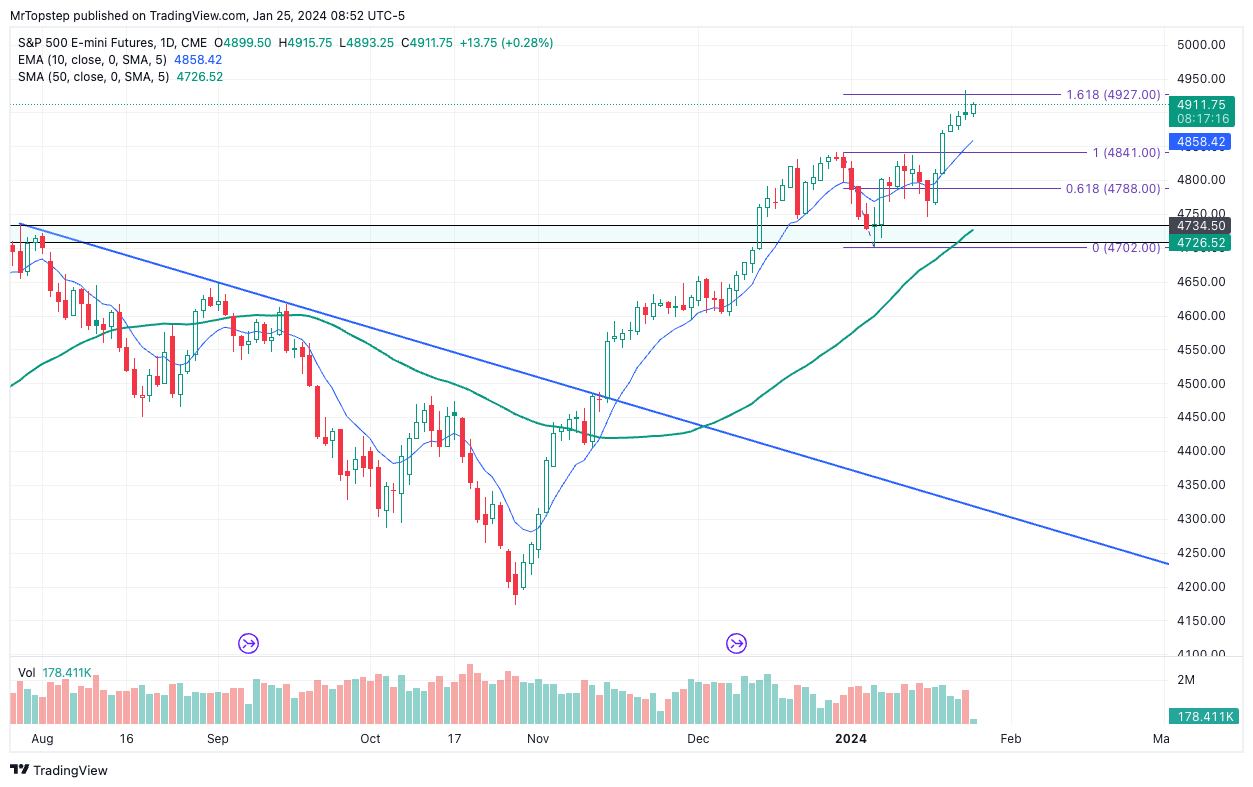
ES
HandelStats Levels:
$ES currently trading 4902.25.
Upside: Trade and Hourly close above 4905 targets 4916.50,
hourly close above 4916.50 targets 1sd 4919.55.
Trade and hourly close above 4920.85 targets 1sd weekly 4933.33.
Hourly close above there targets 2sd 4945.86,
hourly close above there targets 3sd 4972.16.
Downside: Trade and hourly close below 4901.50 targets 4897.
Hourly close below there targets settlement 4893.25.
Hourly close below there is a negative and targets 4884.75 then 4881.50. Hourly close below there targets 4870.80 then -1sd 4866.95.
Hourly close below there targets 4842.12 and -2sd 4840.64.
NQ
Guest Post
Almanac Trader
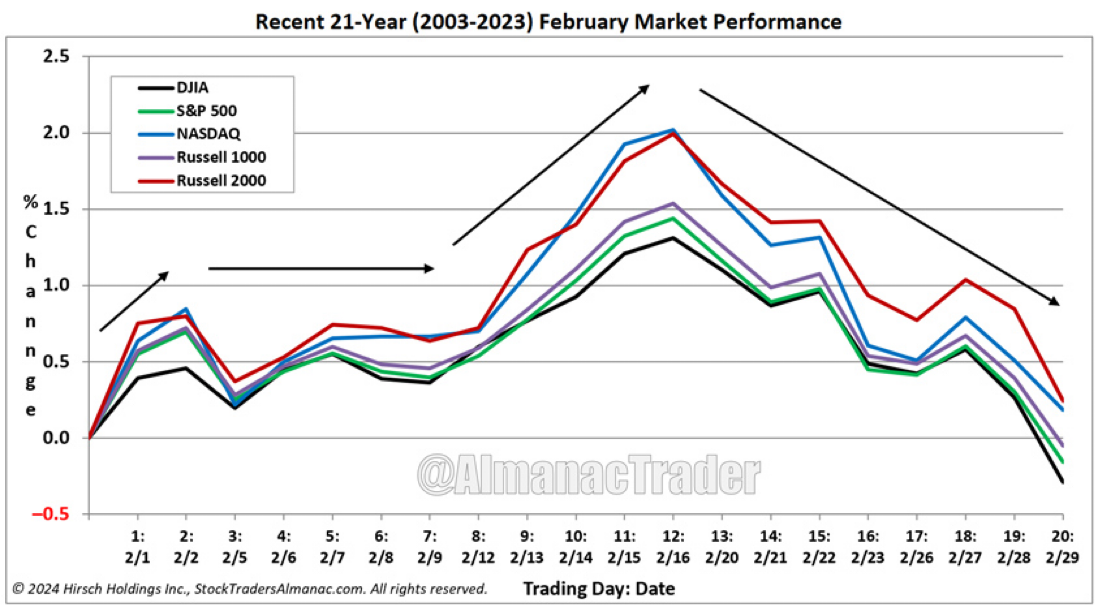
Typical February Performance: Weakness After Mid-Month Peak
Over the last 21 years, the first trading day of February was bullish for DJIA, S&P 500, NASDAQ, Russell 1000 and 2000. Average gains on the first day range from 0.39% by DJIA to 0.75% by Russell 2000. After a strong opening day, strength has tended to fade until around the seventh trading day. From there until around the 12th trading day all five indexes have historically enjoyed gains. But those gains have not held until the end of February with a peak occurring around mid-month. By the end of February, only NASDAQ and Russell 2000 have remained slightly positive while DJIA, S&P 500, and Russell 1000 turn negative.
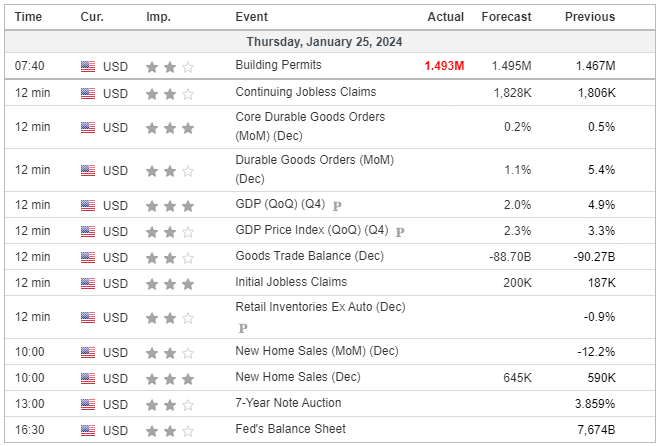
Economic Calendar
Comments are closed