
Market Review
PTG 3 Day Cycle (a.k.a. Taylor Trading Technique)
Author: David D Dube (a.k.a. PTGDavid)
Tuesday’s Session was Cycle Day 3 (CD3): Price declined early in the morning session successfully retesting the CD1 Low 4308 at which time-reversal unfolded back to Initial Balance Midpoint (4334.75). Range was 42.75 handles on 1.238M contracts exchanged.
…Transition from Cycle Day 3 to Cycle Day 1
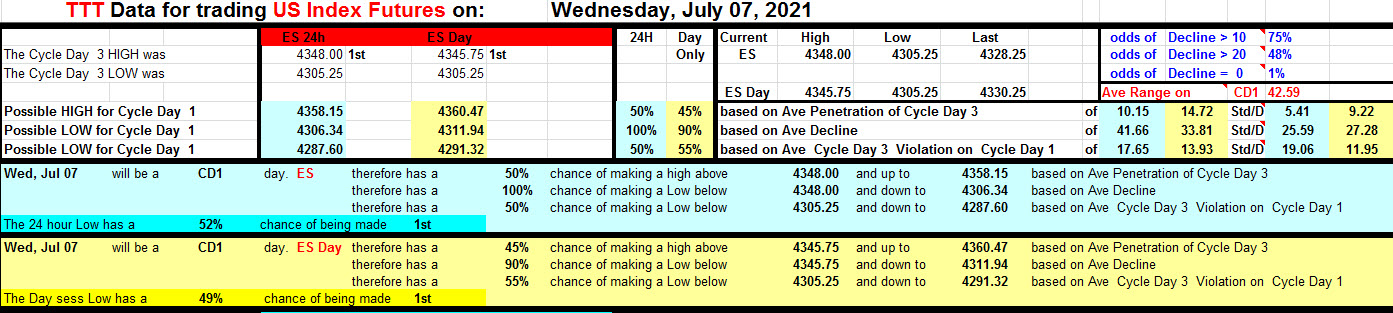
This leads us into Cycle Day 1 (CD1): Average Decline for CD1 measures 4206 which price tagged and reversed during prior session. Since the expected decline is currently in place, today’s session may develop into a “balancing” day, where both upper and lower edges of prior range are tested. As such, estimated scenarios to consider for today’s trading:
1.) Price sustains a bid above 4325, initially targets 4340 – 4345 zone.
2.) Price sustains an offer below 4325, initially targets 4310 – 4305 zone.
*****3 Day Cycle has a 91% probability of fulfilling Positive Cycle Statistics covering 12 years of recorded tracking history.
For more detailed information for both bullish and bearish projected targets, please visit: PTG 3 Day Cycle and/or reference the Cycle Spreadsheet below:
Link to access full Cycle Spreadsheet > > Cycle Day 1 (CD1)
Thanks for reading,
PTGDavid
Economic Calendar

Closing Prices

In the TradeChat Room
Market On Close : Another buy on weak price action

Check out all the Market Closing action in our daily post
Questions? Please email me: Marlin@mrtopstep.com
Get the skinny when we get it: Join the MiM.
.
SpyGate: Sell the AM, buy the PM

Check out our Daily SpyGate Post
SpyGate is now available free to members of IMPRO and MIM trading room. Join the MiM.
Baxter: Try Again
Baxter is our emerging AI product. As we build out our datasets and refine, we will begin tracking real-world AI market predictions. Today’s OHLC prediction is influenced by temporal data (Day of week, year ..) and the OPEX cycle. Baxter is not very smart yet, but he should get better. Here is what he thinks will happen today. This is SPX index, not futures. You will need to add today’s fair value (-8.93) to the data to adjust.
We will also get better at presenting Baxter’s thoughts.
| 7/6/2021 | Baxter | Actual | Difference |
| Open | 4351.07 | 4356.46 | 5.39 |
| High | 4359.61 | 4356.46 | -3.15 |
| Low | 4341.10 | 4314.37 | -26.73 |
| Cose | 4350.08 | 4343.54 | -6.54 |
| 7/7/2021 | |||
| Open | 4342.24 | ||
| High | 4352.03 | ||
| Low | 4330.50 | ||
| Close | 4339.77 |
It was a tough start for Baxter who underestimated any top side, the open was the high of the day yesterday. The lows were 26 points lower than Bax saw. Today is another day and Baxter is already off to a pre-market rough start with an actual gap up developing against Baxter’s call of a gap-down open. Current prediction data is run after the cash close.
Chart of the Day
S&P 500 industry extremes are due for reversal, BCA says

Last quarter’s worst and best performers among U.S. industry groups are poised for a reversal, according to Dhaval Joshi, BCA Research Inc.’s chief strategist. Joshi recommended buying utility stocks and betting against real-estate shares in a report Thursday. Utilities were the only one of the S&P 500 Index’s 11 main industry groups to post a loss last quarter, according to data compiled by Bloomberg. Their index’s 1.1% drop contrasted with a 12.3% gain for the S&P 500 Real Estate Index, which scored its first quarterly win since joining the other 10 categories in 2016.
Our View
The S&P 500 Train Finally Stopped — At Least for a Day
The market was in a “runaway train” mode, as the S&P 500 and Nasdaq continued to grind to new all-time highs. Every day was the same thing, with a new record high notched in each session for more than a week. At least until now.
At the lows on Tuesday, the ES was down 96 basis points from the prior high. Tech was holding up the best — helped by the strength in Apple and the surge in Amazon — but even so, the NQ was still down 70 basis points.
We were finally getting some pressure relieved from the markets. But even that dip didn’t last. In the last Opening Print, Danny said to “buy the pullbacks cautiously.” It took a few hours after the open, but we finally hit the low around 12:20 ET.
The ES opened at 4343.50 and had a quick pop to 4345.75 that was sold into. That was just shy of the 4348 all-time high that printed overnight in the Globex session. The ES then logged seven straight declines on the 15-minute chart and hit a low of 4310 at 11:26. That looked like the low right ahead of the Europe close and it delivered a 10-handle bounce in about 10 minutes.
But the ES had different plans and gave us a new low of 4305.25 at 12:20, before running all the way up to 4337.50 at 3:45.
All in all, the ES did exactly what it has been doing, save for a little extra volatility after a long holiday weekend. Now we have the Fed minutes coming out at 2:00 pm today and that presents us with another potentially volatile afternoon.
Our View
The market has us in a tough spot right now. While there are some nice individual setups on certain stocks, the indices continue to hover near the highs. There’s clearly a favor for tech — or at least, there has been lately. If Apple and Amazon can continue their momentum, it may be hard to knock the markets down. Especially the Nasdaq.
That said, the Fed could be the wild card. If the market hears something it doesn’t like or at least pretends not to like, we could see some selling pressure. That said, the trend is clearly in the bulls’ favor at the moment, and even if the Fed jawbones a bit about rates, they are clearly remaining dovish for the foreseeable future.
With earnings around the corner, it could keep a bid under the market. While it’s hard to be overly bullish after such a strong run, let’s continue to tilt bullish — cautiously.
Over 4348 puts 4350 in play, then another “runaway” scenario becomes possible over the latter. On the downside, buying near 4300 is working for the moment.
As we all know, there’s no crystal ball when it comes to trading stocks, options or futures. But the Market Imbalance Meter may be as close as it comes. Knowing how the “Big Money” is placing its bets can give our trading room a big wave to ride — or a warning sign to stay out of the water. Come check it out now, risk free for 30 days.
Danny Riley is a 39-year veteran of the CME trading floor. He ran one of the largest S&P desks on the floor of the CME Group since 1985.
As always, please use protective buy and sell stops when trading futures and options.
Disclaimer: Trading Futures, Options on Futures, and retail off-exchange foreign currency transactions involves substantial risk of loss and is not suitable for all investors. You should carefully consider whether trading is suitable for you in light of your circumstances, knowledge, and financial resources. Decisions to purchase or sell as a result of the opinions expressed in the forum will be the full responsibility of the person(s) authorizing such transaction(s). BE ADVISED TO ALWAYS USE PROTECTIVE STOP LOSSES AND ALLOW FOR SLIPPAGE TO MANAGE YOUR TRADE(S) AS AN INVESTOR COULD LOSE ALL OR MORE THAN THEIR INITIAL INVESTMENT. PAST PERFORMANCE IS NOT INDICATIVE OF FUTURE RESULTS
No responses yet