Market Review
Topic: Taylor 3 Day Cycle
Author: David D Dube (a.k.a. PTGDavid)
Tuesday’s Session was Cycle Day 2 (CD2): Price fulfilled 3 Day Cycle Objectives as price consolidated throughout this day’s session, absorbing and balancing recent gains. Range was only 15.25 handles on 758k contracts exchanged.
…Transition from Cycle Day 2 to Cycle Day 3
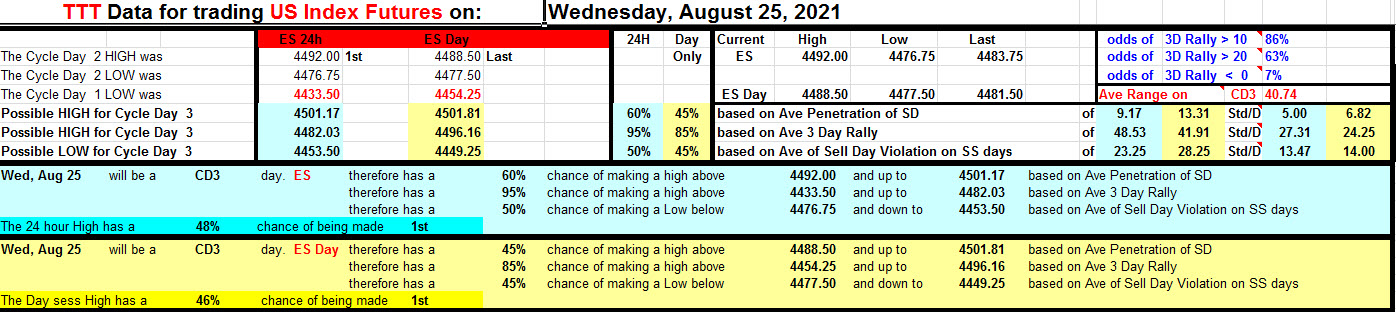
This leads us into Cycle Day 3 (CD3): Cycle Statistic is fulfilled, so we will mark today as a “wild-card”. Key Support is marked at 4475 for any pullback. Price would need to clear and convert 4487 to get a push to 4500 roundie. As such, estimated scenarios to consider for today’s trading:
1.) Price sustains a bid above 4482, initially targets 4492 – 4503 zone.
2.) Price sustains an offer below 4482, initially targets 4475 – 4462 zone.
*****3 Day Cycle has a 91% probability of fulfilling Positive Cycle Statistics covering 12 years of recorded tracking history.
For more detailed information for both bullish and bearish projected targets, please visit: PTG 3 Day Cycle and/or reference the Cycle Spreadsheet below:
Link to access full Cycle Spreadsheet > > Cycle Day 3 (CD3)
Thank you for reading,
PTGDavid
Economic Calendar

Closing Prices

In the TradeChat Room
Market On Close: -842M to sell. Took some shine off the day’s price action.

Check out all the Market Closing action in our daily post
Questions? Please email me: Marlin@mrtopstep.com
Get the skinny when we get it: Join the MiM.
.
SpyGate: Yesterday was a light day for bots. Nothing in the middle.

Check out our Daily SpyGate Post
SpyGate is now available free to members of IMPRO and MIM trading room. Join the MiM.
Baxter
Baxter is our new AI trading helper. This data is early, new, and not very well tested but we want to share some of our findings. We are concentrating on the SP500 which should benefit ES futures and SPY traders.
Yesterday Baxter was all over that low call with high confidence of the low coming in between 10:00 & 12:00 ET. Wrong. The low for the day was set in the first 3 minutes. An intermediate low was put in around 12:30 pm which was also outside the window, but close. Baxter was a bit less confident about the high of the day call with an 80% guess of setting in during the final 30 minutes of trading. The actual high of the day came in around 15:20 so a bit earlier than Bax called for.
For today, Baxter likes that closing 30 minutes again for another closing high possible. He is about 67% on that call. For the low of the day, he really likes that opening 30 minutes. Calling for a bullish day if the opening 30 is the low and closing 30 is the high.
Chart of the Day
U.S. bonds fall out of sync with record-setting S&P 500

Signals from the U.S. bond market indicate the S&P 500 Index is due for “a reset,” according to Steven Vannelli, chief investment officer of Knowledge Leaders Capital LLC. Vannelli, also the firm’s founder and chief executive, raised the issue in a blog post Thursday. He cited gaps in yield between investment-grade and high-yield debt and U.S. Treasuries, as compiled by Bloomberg. Both spreads widened because of falling bond prices since early July, while the S&P 500 set records repeatedly. There have been 49 new highs this year and Monday almost brought the 50th.
Our View
Record Stock Inflows Help Push S&P to 50th Record Close of 2021
Why has the S&P gone up so much over the last several days? U.S. equity fund inflows reached $12.8 billion and worldwide investors poured $23.9 billion into equities ending the week of August 18th.
The ES opened Tuesday’s regular session at 4482.75, chopped in a five-point range, then traded up to 4488 at 10:52 am. After the high, the ES broke below the VWAP near 4484 and traded down to 4479.25 around 12:45 and then back up to 4484.25 — basically, in the range I spoke about earlier.
Around 2:20 a small buy program hit the ES and pushed it back up to the 4488.50 level at 3:00 as the early MiM started showing $175 million to buy. At 3:30 the ES traded 4486 as the MIM started to show over $430 million to buy.
The ES traded 4483.50 as the 3:50 cash imbalance ‘flipped’ from $175 million to buy to $337 million to sell and traded 4483.50 on the 4:00 cash close. The ES ended higher by 2.5 points or +0.06% on the day. It was a painfully calm day, with a range that continued to narrow throughout the session.
The NQ settled at 15,363.50, up 35.25 points or +0.23%. The S&P and Nasdaq have closed higher the last 4 sessions and the Dow is up 3 in a row. The S&P is now leading the major averages, up 19.4% year to date.
In the end, yesterday was what I call a “no day,” which means there was little to no trade. After a big up move on Monday, the markets need to rest and go through some back-and-fill. That’s what yesterday looked like. Breadth was firm, with the NYSE registering an 81% “up” day and the NASDAQ registering a 75.6% “up” day. Despite the firm breadth though, there was no trend to trade — it was mostly anemic chop.
In terms of the ES’s overall tone, it was firm but choppy. In terms of the day’s overall trade, volume was LOW at 760,000 contracts traded.
Our View: If there was ever a trading definition for the word GRIND, it was yesterday. From the open to 3:00, the ES mostly traded in a 4- to 5-handle range, with the 4488 high and the late 4479.25 pullback low being the exception. My guess is with Powell set to speak later this week, traders are gearing back a bit. Our Lean: You can sell the early rallies and buy the pullbacks or just keep following the trend and buy the pullbacks. My concern is the Fed headlines later in the week and some type of risk-off trade. Otherwise, ES 4520 is ON TAP!
Don’t get our premium Opening Print each morning? Start your day with MrTopStep’s Premium Opening Print in your Inbox: Special $9.95/month
As we all know, there’s no crystal ball when it comes to trading stocks, options, or futures. But the Market Imbalance Meter may be as close as it comes. Knowing how the “Big Money” is placing its bets can give our trading room a big wave to ride — or a warning sign to stay out of the water. Come check it out now, risk-free for 30 days.
Danny Riley is a 39-year veteran of the CME trading floor. He ran one of the largest S&P desks on the floor of the CME Group since 1985.
As always, please use protective buy and sell stops when trading futures and options.
Disclaimer: Trading Futures, Options on Futures, and retail off-exchange foreign currency transactions involves substantial risk of loss and is not suitable for all investors. You should carefully consider whether trading is suitable for you in light of your circumstances, knowledge, and financial resources. Decisions to purchase or sell as a result of the opinions expressed in the forum will be the full responsibility of the person(s) authorizing such transaction(s). BE ADVISED TO ALWAYS USE PROTECTIVE STOP LOSSES AND ALLOW FOR SLIPPAGE TO MANAGE YOUR TRADE(S) AS AN INVESTOR COULD LOSE ALL OR MORE THAN THEIR INITIAL INVESTMENT. PAST PERFORMANCE IS NOT INDICATIVE OF FUTURE RESULTS
No responses yet