Market Review
Topic: Taylor 3 Day Cycle
Author: David D Dube (a.k.a. PTGDavid)
Website: Polaris Trading Group
Tuesday’s Session was Cycle Day 2 (CD2): This cycle’s rally continued to push higher fulfilling target 4590 outlined in prior DTS 10.25.21 briefing report. Range was 29 handles on 1.211M contracts exchanged.
…Transition from Cycle Day 2 to Cycle Day 3
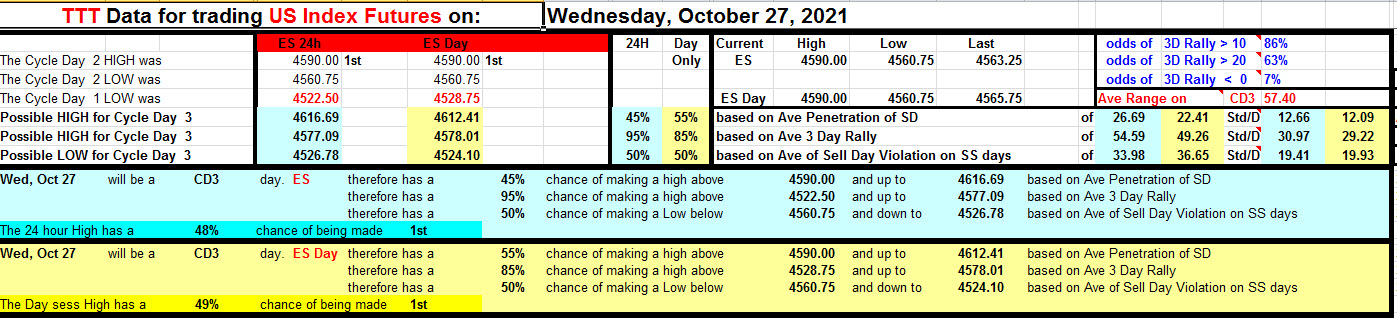
This leads us into Cycle Day 3 (CD3): Cycle objectives have been fulfilled with price trading near fresh all-time highs. As such the decline could begin at any time, and for many would be welcomed. We’ll mark this session as a “wild-card” as BTFD strategies have continued to be successful. So until the powers at work decide to shift gears, we’ll ride their trading coattails. As such, estimated scenarios to consider for today’s trading.
1.) Price sustains a bid above 4558, initially targets 4575 – 4580 zone.
2.) Price sustains an offer below 4558, initially targets 4548 – 4542 zone.
*****The 3 Day Cycle has a 91% probability of fulfilling Positive Cycle Statistics covering 12 years of recorded tracking history.
For more detailed information for both bullish and bearish projected targets, please visit: PTG 3 Day Cycle and/or reference the Cycle Spreadsheet below:
Link to access full Cycle Spreadsheet > > Cycle Day 3 (CD3)
Thanks for reading,
PTGDavid
Economic Calendar

Closing Prices

In the TradeChat Room
Market On Close: Four buys in a row. Even less enthusiasm.

>> Check out all the Market Closing action in our daily post <<
Questions? Please email me: Marlin@mrtopstep.com
Get the skinny when we get it: Join the MiM.
.
SpyGate: Bots were a bit bullish on the close to call it over to the upside.

Check out our Daily SpyGate Post
SpyGate is now available free to members of IMPRO and MIM trading room. Join the MiM.
Baxter
Baxter is our new AI trading helper. This data is early, new, and not very well tested but we want to share some of our findings. We are concentrating on the SP500 which should benefit ES futures and SPY traders.
Last Trading Day:
High: 10:22
009:30 – 10:00 >90% (wrong)
Low: 12:54
109:30 – 10:00 51%(wrong)
15:30 – 16:00 36% (wrong)
Today:
High:
Low:
The east coast storm knocked us off line overnight. We did not make a run before printing. Will return tomorrow.
Chart of the Day
Tesla needs only one day to beat most peers’ market value

Tesla Inc. would be one of the world’s largest automakers by market value based on Monday’s performance alone. The electric-car maker’s value rose $117.9 billion, surpassing $1 trillion for the first time, according to data compiled by Bloomberg. The increase exceeded the closing value of all but one of the 17 other companies in the MSCI World Automobiles Index, which tracks developed markets. Toyota Motor Corp., the world’s largest automaker by production, was the exception. Toyota ended the day at $281 billion.
Our View
The ES rallied up to a new all-time contract high at 4580.75 on Globex and opened Tuesday’s regular session at 4576.50, After the open, the S&P down ticked to 4572.25, traded up to 4588.50 at 10:17, pulled back to 4577.00, and then rallied up to 4590.00 at 10:31. After the high, the ES made a sequence of lower highs and then traded down to 4570.00 at 11:47, rallied up to 4576.00, and then got hit by a sell program that pushed the futures down into the sell stops down to the 4561 area. After the low, the ES rallied up to the 4571 area then dropped down to a high low at 4563.25 and then made ‘several’ higher lows up to 4578.00 at 3:15. The ES dropped down to 4572.00 after the MIM increased to $503 million to buy then went back up to 4579.25 at 3:47. The ES traded 4575.25 as the 3:50 cash imbalance came out at $158 million to buy and traded 4564.75 on the 4:00 cash close. After 4:00, the ES sold back off to the 4562.25 area and settled at 4563.50 on the 5:00 futures close, down 1.75 points or -0.04%.
In the end, the S&P has closed high 8 out of the last 10 sessions, it’s hard to talk bad about something like that. In terms of the E’s overall tone, it was firm until late in the day. In terms of the day’s overall trade, volume was slightly better at 1.219 million contracts traded.
Our View: Yesterday the ES could not have looked better when it traded up to 4590.00, but that all changed late in the day as the futures sold off nearly 30 points from their high. Yesterday all three major indexes marched higher, with the Dow and S&P 500 reaching their highest levels ever. On the earnings front, GOOGLE (GOOG) posted its highest quarterly revenue increase in 14 years and Microsoft Corp. (MSFT) said it was continuing to benefit from the global shift toward remote work as its cloud business boosted its revenue last quarter. According to FactSet, of the 144 companies in the S&P 500 that reported quarterly earnings through Tuesday morning, 81% have beaten analyst forecasts, and companies across the index are currently estimated to grow third-quarter earnings by 33% from a year earlier. It’s just astonishing, how can everything be so cheery in the stock market and so depressed in the real world?
Our lean, I still think higher prices but yesterday’s sell-off was long overdue. Had the ES not closed 0.04% lower it would have been up 9 of the last 10 sessions. That’s a lot of up days!! Our lean is to sell the rallies and buy the pullbacks gingerly. I asked Jeff Hirsch from @StockTradersAlmanac how the last trading day of October and the first trading day of November looked and he was nice enough to send me the stats :
Last Day Oct
DJIA: Up 10/21, Total Pts -140.47, Avg -0.05%
S&P: Up 11/21, Total Pts 0.44, Avg 0.02%
NASDAQ: Up 11/21, Total Pts 104.69, Avg 0.35%
R2K: Up 11/21, Total Pts 24.56, Avg 0.29%
1st Day Nov
DJIA: Up 13/21, Total Pts 946.33, Avg 0.21%
S&P: Up 13/21, Total Pts 87.89, Avg 0.17%
NASDAQ: Up 13/21, Total Pts 265.99, Avg 0.28%
R2K: Up 10/21, Total Pts 37.2, Avg 0.1%
As you can see, the Nasdaq and Russell seem to benefit on the last trading day of October, and the Dow, S&P, and Nasdaq are more often up on the first trading day of November.
To conclude, I would like to see a few days of pulling back. If the ES cooperates, I suspect the ES rallies early Friday and then I cant rule out some late-day selling, then up on Monday, the first trading day of November. We shall see…
Danny Riley is a 39-year veteran of the CME trading floor. He ran one of the largest S&P desks on the floor of the CME Group since 1985.
As we all know, there’s no crystal ball when it comes to trading stocks, options, or futures. But the Market Imbalance Meter may be as close as it comes. Knowing how the “Big Money” is placing its bets can give our trading room a big wave to ride — or a warning sign to stay out of the water. Come check it out now, risk-free for 30 days.
As always, please use protective buy and sell stops when trading futures and options.
Disclaimer: Trading Futures, Options on Futures, and retail off-exchange foreign currency transactions involves substantial risk of loss and is not suitable for all investors. You should carefully consider whether trading is suitable for you in light of your circumstances, knowledge, and financial resources. Decisions to purchase or sell as a result of the opinions expressed in the forum will be the full responsibility of the person(s) authorizing such transaction(s). BE ADVISED TO ALWAYS USE PROTECTIVE STOP LOSSES AND ALLOW FOR SLIPPAGE TO MANAGE YOUR TRADE(S) AS AN INVESTOR COULD LOSE ALL OR MORE THAN THEIR INITIAL INVESTMENT. PAST PERFORMANCE IS NOT INDICATIVE OF FUTURE RESULTS
No responses yet