S&P Makes Good News From the Bad
Plunge Protection Team working overtime
Follow @MrTopStep on Twitter and please share if you find our work valuable!
Every week, MrTopStep invites traders to an “Own the Close” contest where the closest guesstimate where the SPX will settle on Friday’s 4:00 cash close.
The winners get a free week’s access to the MrTopStep Chat and trading tools. Enter your guess now!
Our View
I get it — a hot CPI number and the ES sells off and then rallies 57 points in 55 minutes.
The PPT-induced rally — Plunge Protection Team — has no bounds, but how long can it keep going up with the dollar falling, gold at $2,200, Oil at $79, Bitcoin at $72,300, US debt growing $1 trillion every 100 days, and CPI increasing 0.4% for the month and 3.2% from a year ago?
This is not a complaint.
I have always been a bull market guy, but I can’t be the only one scratching my head. Goldman said the Fed will lower in June, September, and December. I have no way to say that. Two wars in the Middle East, Putin in Ukraine, and China warning South Korea. There are flashing red lights all over the place but that is not stopping the PPT or the S&P 500.
Is it wrong to be concerned? Absolutely not, it’s like a story about my friend I got off the streets in Chicago, Black Mike. He told me he was worried about my garage getting broken into because I lived so close to a bad area in Chicago and I said, “I can’t worry about that Mike, I know they are coming, I just don’t know when.” I guess the moral of the story is a very old story: The trend is your friend, and as long as the dip-buying bots are buying, there’s no reason to fight it.
Our Lean
How high is high? That’s a great question, especially in an election year.
Today there are no scheduled economic releases or Fed speak today. Tomorrow is a different story, with the PPI report, Retail Sales, Jobless Claims, and Business Inventories. Then on FRYday, we have the March Triple Witching expiration, with $2.7 trillion worth of expiries.
Our Lean is unchanged — we can’t rule out selling a rip, but the money trade remains on the long side of the card, buying the dips.
MrTopStep Levels:
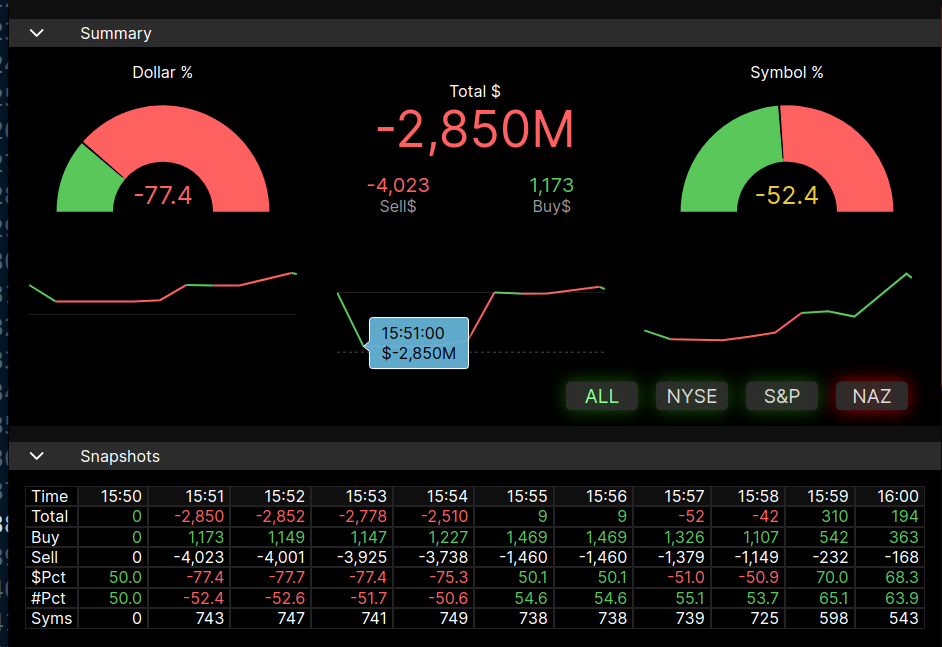
MiM and Daily Recap
ES Recap
CPI and Part 1 to the Trading Day
After running up to new highs after the 4:00 cash close, the ES ES rallied up to the 5408.75 level at 4:06 am, sold off down to a 5176.25 double bottom after the CPI increased 0.4% for the month and 3.2% from a year ago. Then the ES rallied up to 5221.00 at 8:46, sold off down to 5203.50 at 8:55, rallied up to 5112.50 and sold off down 5196.00 at 9:12. It jumped back up to 5206.50 at 9:28 on Globex and traded 5206.50 on Tuesday’s regular session open.
Part 2 to the Trading Day
After the open, the ES traded up to 5210.00 and sold off down to a 5180.00 double bottom and then rallied back up to 5211.75 at 10:09 and fell into a narrow back-and-fill for the next 15 minutes and then blasted up to 5238.50 at 11:19, then sold off down to 5207.50 at 12:45 area. After the low, the ES rallied back up to the 521925 level and then dropped below the VWAP to a higher low at 5208.50 (Riley Retest), it was that low that set off a push-back up to 5241.00 at 2:37 and then sold off down to the 5228.50 level at 2:46 and rallied back up to a new high at 5246.50 at 3:00.
Part 3 of the Trading Day
After 3:00, the ES pulled back to 5237 and then rallied up to 5245.25 at 3:28, sold off down to 5139 at 3:48, and traded 5240.75 as the 3:50 imbalance showed $1.46 billion to sell and then rallied up to 5246.75 at 3:56 and traded 5241 on the 4:00 cash close. After 4:00, the ES drifted down to 5238.75 and settled at 5239 on the 5:00 futures close, up 48 points or +0.92%. The NQ settled at 18,471, up 230.25 points or 1.26%, Crude oil (CLJ4) settled at 78.09, up 0.16 or +0.21%, Bitcoin settled at $72,310, down $1,205 or -1.66%, the (ZBM4) June bonds settled at 130.25, down 20 points or -0.51%, Gold (GCJ4) settled at $2,163, down $24.7 points or -1.13% on the day.
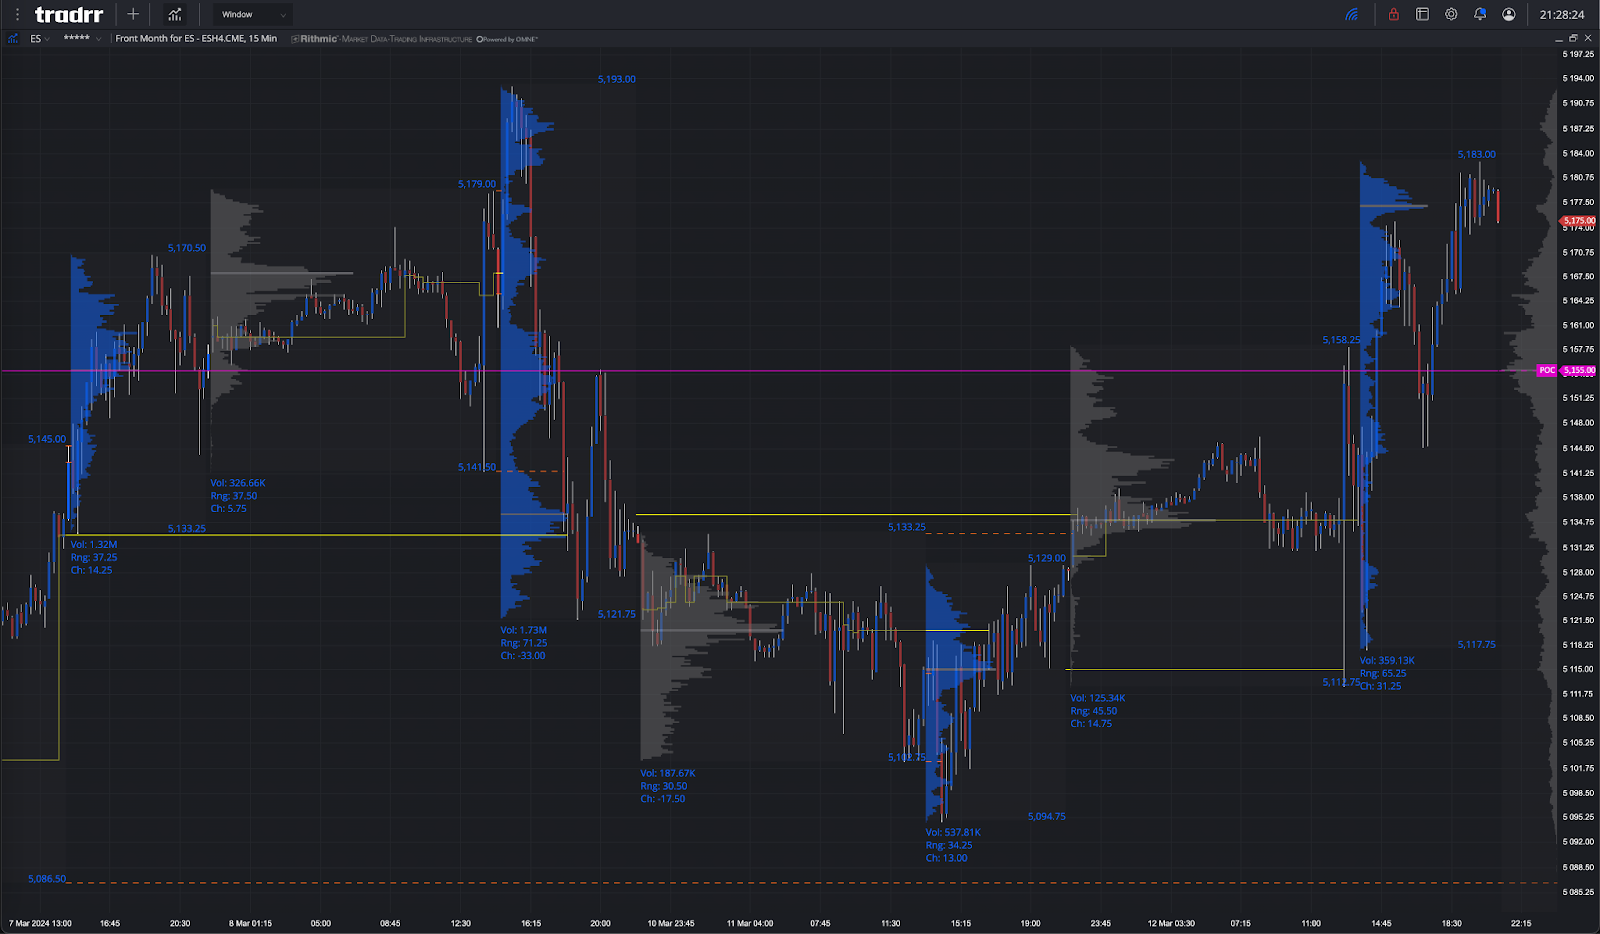
In the end, we live in a mixed-up, crazy world where the ES takes bad news and makes good of it. In terms of the ES’s overall tone, both the ES and NQ were firm. In terms of the ES’s overall trade, volume was high: 312k traded on Globex and 1.286 million traded on the day session for a total of 1.607 million contracts traded.
Technical Edge
-
NYSE Breadth: 53% Upside Volume
-
Nasdaq Breadth: 46% Upside Volume
-
Advance/Decline: 55% Advance
-
VIX: ~13.75
Guest Post
Topic: PTG / Taylor 3 Day Cycle
Author: David D Dube’ (a.k.a. PTGDavid)
Website: https://polaristradinggroup.com/
Prior Session was Cycle Day 3: Three-Day Cycle Targets were fulfilled as price closed near the high of the day following an “inline” CPI Report, as traders remain enthusiastic of a June rate cut. Range was 70 handles on 1.604M contracts exchanged.
…Transition from Cycle Day 3 to Cycle Day 1
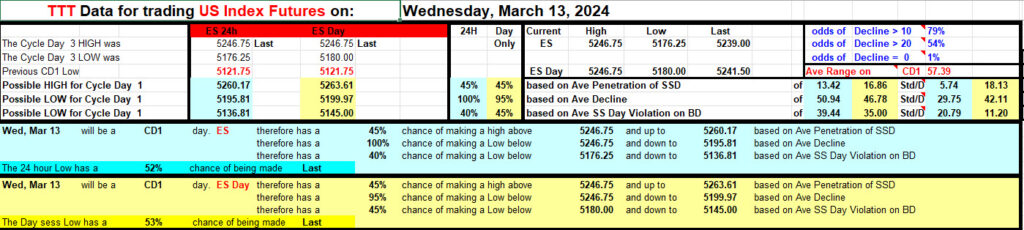
This leads us into Cycle Day 1: Having closed near the highs, momentum may extend price higher before the next decline begins. Should a decline develop, CD1 average measures 5195. We’ll mark 5235 as today’s Line in the Sand (LIS).
As always, our tactical trade plan remains unchanged…Stay in alignment with dominant intra-day forces.
Scenarios to consider for today’s trading.
Bull Scenario: Price sustains a bid above 5235, initially targets 5250 – 5255 zone.
Bear Scenario: Price sustains an offer below 5235, initially targets 5225 – 5220 zone.
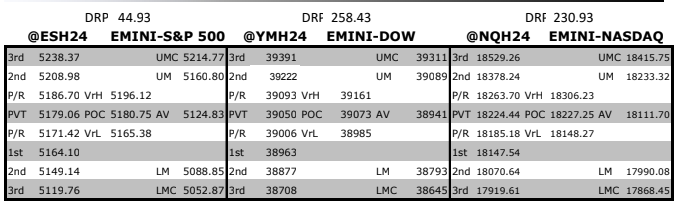
PVA High Edge = 5245 PVA Low Edge = 5208 Prior POC = 5141
*****The 3 Day Cycle has a 90% probability of fulfilling Positive Cycle Statistics covering 12 years of recorded tracking history.
Thanks for reading,
PTGDavid
Economic Calendar
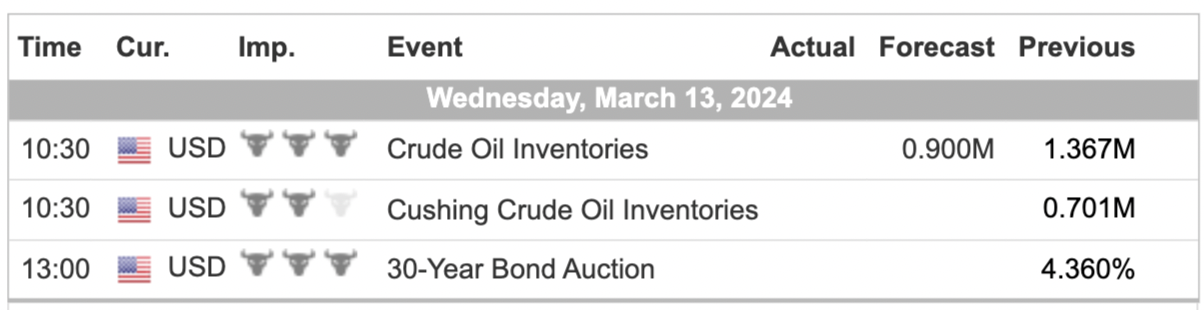
For a more complete Economic Calendar see: https://mrtopstep.com/economic-calendar/
Comments are closed