You Shouldn’t Be Surprised With That Dip
CPI was too hot
Follow @MrTopStep on Twitter and please share if you find our work valuable!
Every week, MrTopStep invites traders to an “Own the Close” contest where the closest guesstimate where the SPX will settle on Friday’s 4:00 cash close.
The winners get a free week’s access to the MrTopStep Chat and trading tools. Enter your guess now!
Our View
Yesterday’s sell-off was a long time coming and it was telegraphed to us on Monday. There are a few things we just can’t downplay:
-
The importance of the FRYday jobs number and
-
CPI…especially when everyone is talking about lower inflation, rates, and jobs.
What happens is, the markets start going up and the Fed wants to keep the ball rolling but in reality, the numbers don’t add up. It doesn’t help when everyone is looking for a rate cut and then the data doesn’t support it.
I have to be honest, I thought there were a few more down days on the way — but the rally and this note from the PitBull “Any mid month money coming in tomorrow?” — casts some doubt on that idea.
Our Lean
Well, we didn’t get the gap up, but we sure got the volatility and weakness. From Monday’s high to Tuesday’s low, the ES coughed up 130 points, then bounced more than 60 handles. All that has happened is some long got blown out and shorts were added. It’s just a big algorithmic washing machine.
To be honest I still think lower prices are ultimately on the way, but the closing rally and the possibility of some mid-month rebalancing.
Our Lean: If the ES gaps higher, I am a seller on the open or the first rally above the gap and looking for a retest of the 4940 level. If that doesn’t happen and the ES opens lower, I’m buying the open or the first pullback under the open and selling the 20 to 30-point rips. $590 should be a brick wall.
Levels from HandelStats.com
-
Upside: Trade and hourly close above 4997.85 targets 1sd at 5002.10. Trade and hourly close above 5002.10 targets 5021.50, 5027.12, 5032.75 and 2sd at 5033.45. Trade and hourly close above there targets 5041.50, 5044.00, then 5053.94, then 3sd at 5064.81.
-
(Daily close above 5022 and it could go to 5053.94).
-
-
Downside: Trade and hourly close below 4993.64, targets 4982.57. Below 1sd weekly at 4981.60 targets settlement at 4970.75, below there targets 4963.75, 4960.50, 4954.75. Hourly close below there targets -1sd at 4939.40. Hourly close below there targets -2sd weekly at 4920.46. Hourly close below there targets 4911.88, then -2sd at 4908.05.
MiM and Daily Recap
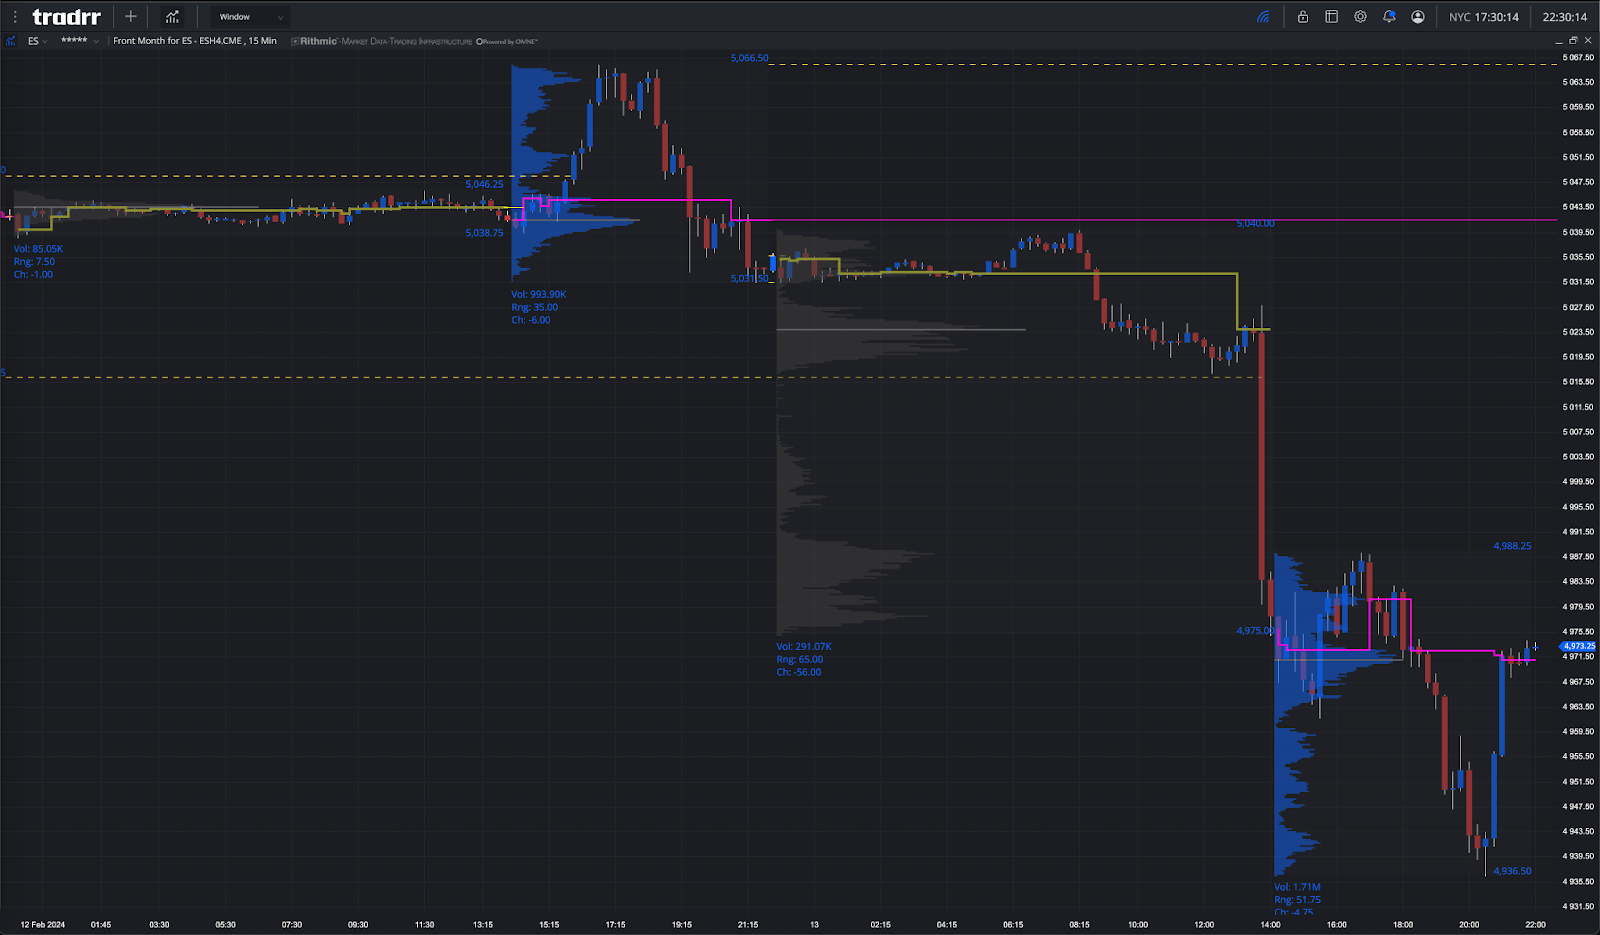
The ES traded down to 5017.00 on Globex at 7:12 am and then traded up to 5025.75 at 8:27 and traded 4967.50 after the CPI report was released. CPI was up 3.1% on an annual basis. Economists polled by Dow Jones expected CPI to have increased by 0.2% month over month in January and 2.9% from a year earlier.
Literally, the ES traded hundreds of points in 3 minutes and then dropped down to 4967.50 and opened Tuesday’s regular session at 4975. After the open, the ES traded 4969.25 and then rallied up to 4982.00 at 9:38, traded down to 4961.75 at 10:18 and then rallied up to 4977.50 at 10:25, did a sideways-to-up back-and-fill and traded up to a 4988.25 at 11:41. After the high, the ES sold back off down to 4947.25 at 2:27.
After the low the ES back-and-filled a bit and then traded up to 4959.00 at 2:39 and then sold off down to new low at 4936.50 at 3:23 and then popped up to 4959.50 at 3:45 as the early imbalance showed $32 million to buy. The ES traded 4956.50 as the 3:50 cash imbalance showed $2.2 billion to sell and then traded all the way up to 4971.25 at 3:57 and traded 5071.25 on the 4:00 cash close. After 4:00, the ES traded up to 4974.25 and settled at 5073.25 on the 5:00 futures close, down 62.5 points or 1.24%. The NQ settled at 17,699.25, down 230 points or 1.28% on the day.
In the end, the Fed will be lucky if they can lower interest rates in the second quarter and the index markets sold off sharply because of it. In terms of the ES’s overall tone, it was weak but the late-day 37.5-point rip was death-defying. In terms of the ES’s overall trade, volume was brisk: 380k traded on Globex and 1.690k million traded on the day session for a total of 2.07 million contracts traded.
A note from Goldman Economists:
“This CPI print is disastrous for the camp expecting near-term rate cuts. We’re still going through the details, but nothing jumps out to me as any kind of indication that the data is a one-off, or that there will be a reversal next month. -The total core rose the most since May, core services rose 0.7%, the most since September 2022, and core services ex-housing rose 0.849%, the most since April 2022. -In our outlook piece last week, we highlighted the risk that inflation would reaccelerate and that the Fed would be handcuffed in the first half of the year, unable to justify a rate cut in the face of high inflation pressure, strong growth, and a strong labor market. But we were not expecting to see such a big increase in the inflation data this soon, rather we thought that there might be a return of upward pressure in the next few months. -This is why Powell has been so reticent to declare victory on inflation and warm up to the idea that they should be adjusting rates lower. Barring a big shift in the tone of the data, we do not see a cut before June.”
For more info on accessing the MIM, please visit here.
Technical Edge
-
NYSE Breadth: 8% Upside Volume (!!)
-
Nasdaq Breadth: 20% Upside Volume (!)
-
Advance/Decline: 8% Advance
-
VIX: ~15
ES
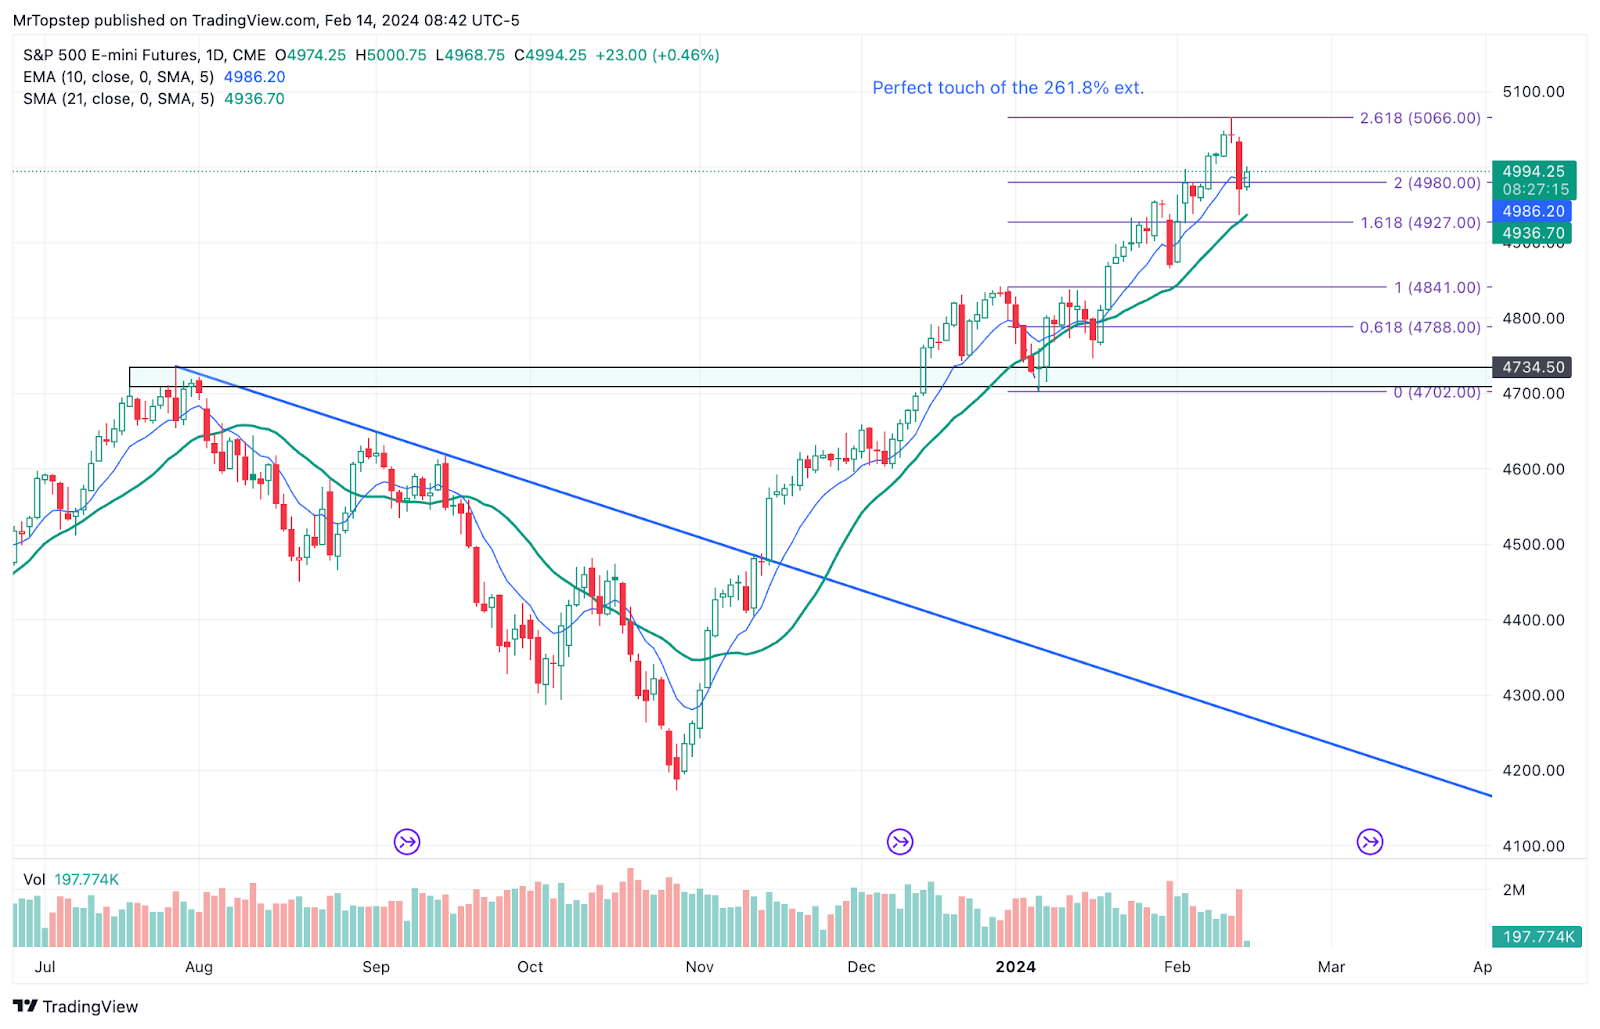
ES Daily
Guest Post
PTG/Taylor 3 Day Cycle
Author: David D Dube’ (a.k.a. PTGDavid)
Website: https://polaristradinggroup.com/
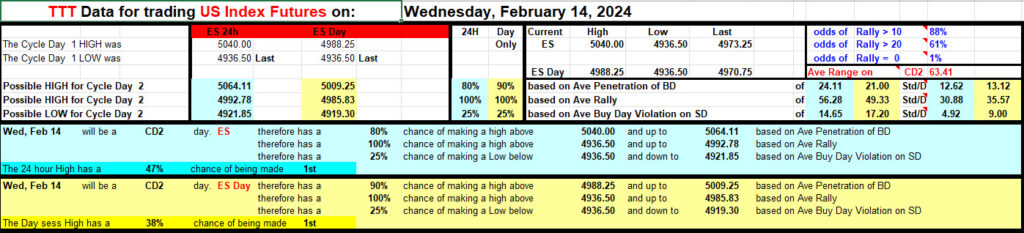
Prior Session was Cycle Day 1 (CD1): Markets declined as expected, though CPI Report was the catalyst for a “long-liquidation”, surpassing all statistically extreme cycle levels. (Note: This will have the effect of recalculating target projections for future cycles) Prior range was 103 handles on 2.003M contracts exchanged.
…Transition from Cycle Day 1 to Cycle Day 2
This leads us into Cycle Day 2 (CD2): Late day rally off extreme lows recovered price back to 5-Day POC (4970). Normal for Cycle Day 2 is for consolidation of recent wide-range activity. Market volatility has now increased, with expectations to remain elevated for the immediate term, which should provide ample intra-day trading opportunities. Our daily plan remains unchanged. Stay flexible and in-alignment with the primary intra-day forces. As such, scenarios to consider for today’s trading.
Bull Scenario: Price sustains a bid above 4970, initially targets 4985 – 4990 zone.
Bear Scenario: Price sustains an offer below 4970, initially targets 4960 – 4955 zone.
PVA High Edge = 4990 PVA Low Edge = 4960 Prior POC = 4970
*****The 3 Day Cycle has a 90% probability of fulfilling Positive Cycle Statistics covering 12 years of recorded tracking history.
For more detailed information for both bullish and bearish projected targets, please visit: PTG 3 Day Cycle and/or reference the Cycle Spreadsheet below:
Link to access full Cycle Spreadsheet > > Cycle Day 2 (CD2)
Thanks for viewing…PTGDavid
Comments are closed