Focus Is on February After Fed & Tech Weigh on Stocks
Odds fade for a March rate cut
Follow @MrTopStep on Twitter and please share if you find our work valuable!
Our View
I talked about being bullish but cautious…but neither the OP nor my trading reflected that.
I wrote about the tech weakness for the last three sessions, about T+1 and T+2, and that there were not going to be any March rate hikes.
While I knew the selling was tied to the Fed’s outlook on rate cuts and the end-of-the-month walk away, I stupidly stood my ground. I have a very hard time switching from buying the pullbacks to selling the rips and the last few days have not worked out real well.
Right away, I knew the lean was off but I continued to buy the drops and lost a fair amount of money doing it. I am aggravated with myself, but I’m also sorry I didn’t come through. It’s hard to rally the S&P with each of the Magnificent 7 down.
Our Lean
Yesterday was a perfect storm to the downside. The last trading day of January and the Fed.
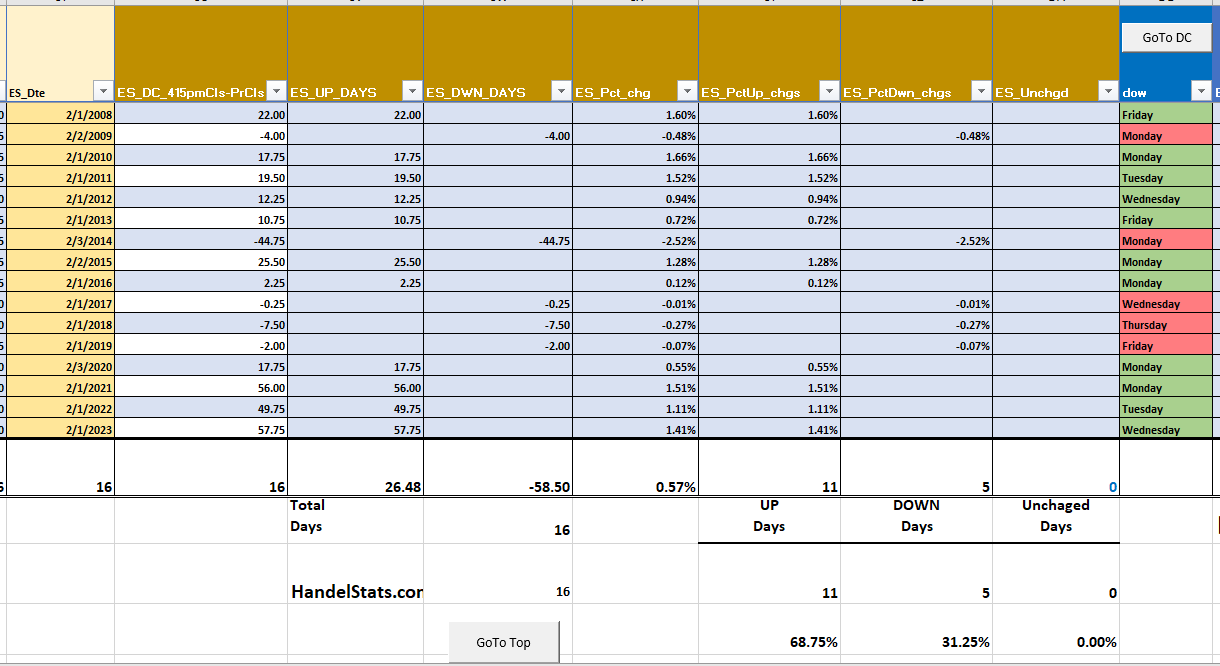
The first trading day of February has the Dow up 18 of the last 21 and the ES up 11 out of the last 16. Further, Friday’s stats are the same — up 11 out of the last 16. Below is HandelStats study.
I’m not sure what is going to happen, but I do think we see a bounce today. There was big downside volume yesterday and $7 billion was sold on the cash close. Now with it being the first trading day of the new month, my guess is they put some of that money back to work.
Ideally I just want to get a look at the price action. I think we bounce, but that doesn’t mean we dont see some selloffs either.
First trading day of February for ES since 2008:
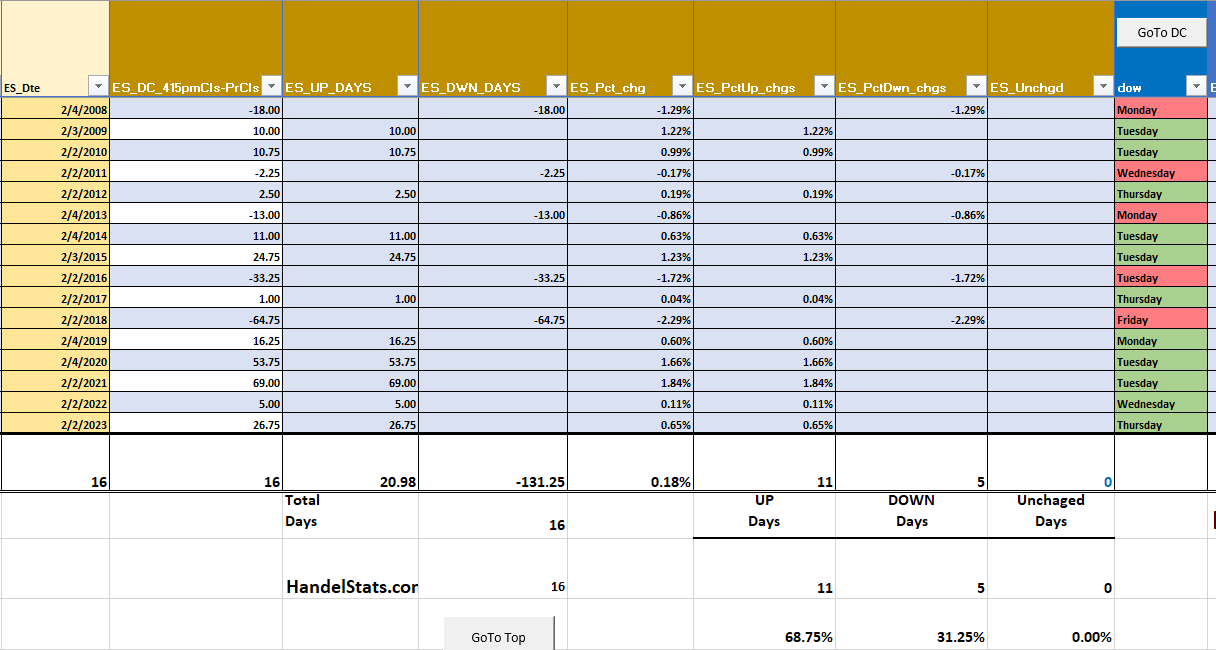
Second trading day of February for ES since 2008:
MiM and Daily Recap
ES Recap
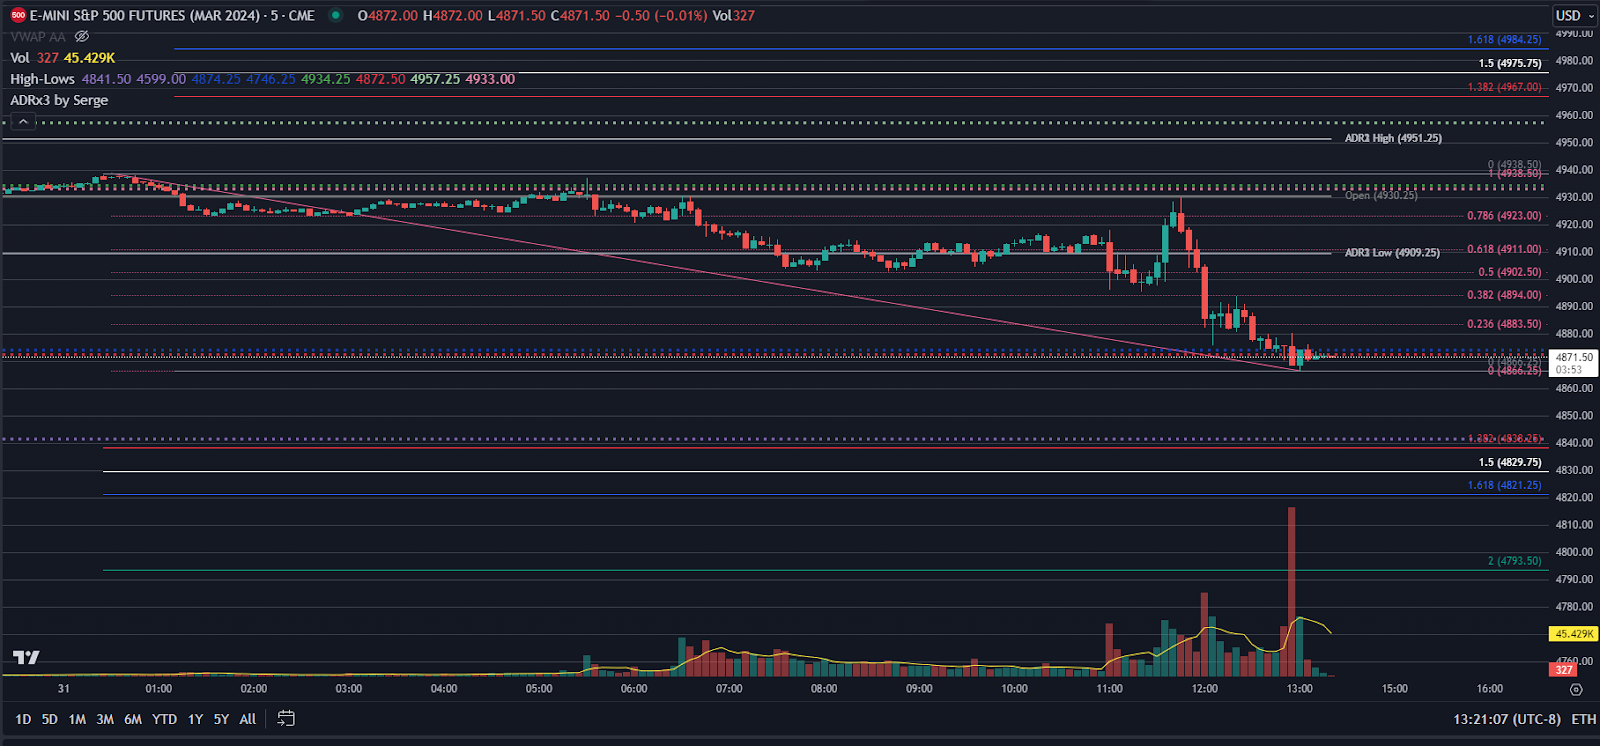
The ES traded down to 4923.00, traded up to 4937.00 at 9:00 am and opened Wednesday’s regular session at 4926.00. After the open, the ES traded up to 4930.50, sold off down to 4914.50 at 10:00, rallied a few points up to 4717.75, sold off down to a new low at 4911.25, rallied back up to 4914.50 and then dumped down to 4903.25 at 11:00. After the low, the ES traded up to 4914.25 and then made a new low by 2 ticks down to 4902.75 at 12:00, then traded up to 4913.50 at 12:30, pulled back to a higher low at 4904.50 and then rallied up to 4918.00 at 2:00 as the Fed headlines hit the tape saying the rate cuts are still on the table, but not imminent.
The ES sold off down to 4896.00 at 2:04, then it rallied all the way up to 4929.75 at 3:00, before dropping 54 points down to 4875.75 at 3:15. After the low, the ES rallied to 4893.75 at 3:25 as the early NYSE order imbalance showed $1.027 billion to sell and then sold back off down to a new low at 4873.25 at 3:48 and traded 4874.75 as the 3:50 cash imbalance showed $7 billion to sell and sold off down to new lows at 4870.25 and traded 4868.50 on the 4:00 cash close. After 4:00, the ES sold off down to another new low at 4866.00 and settled at 4871.75 on the 5:00 cash close, down 61.75 points or 1.25% on the day. The NQ settled at 17,625.25, down 346 points or 1.97% on the day.
In the end, the selling in the technology sector continued right into Fed Chair Powell’s comments and the imbalance of $7 billion to sell. On top of the tech weakness, it was the last trading day of January. In terms of the ES’s overall tone, it acted weak and closed weak. In terms of the ES’s overall trade, volume was high, with a total of 2.16 million contracts traded.
There was also something else lurking behind the scene.
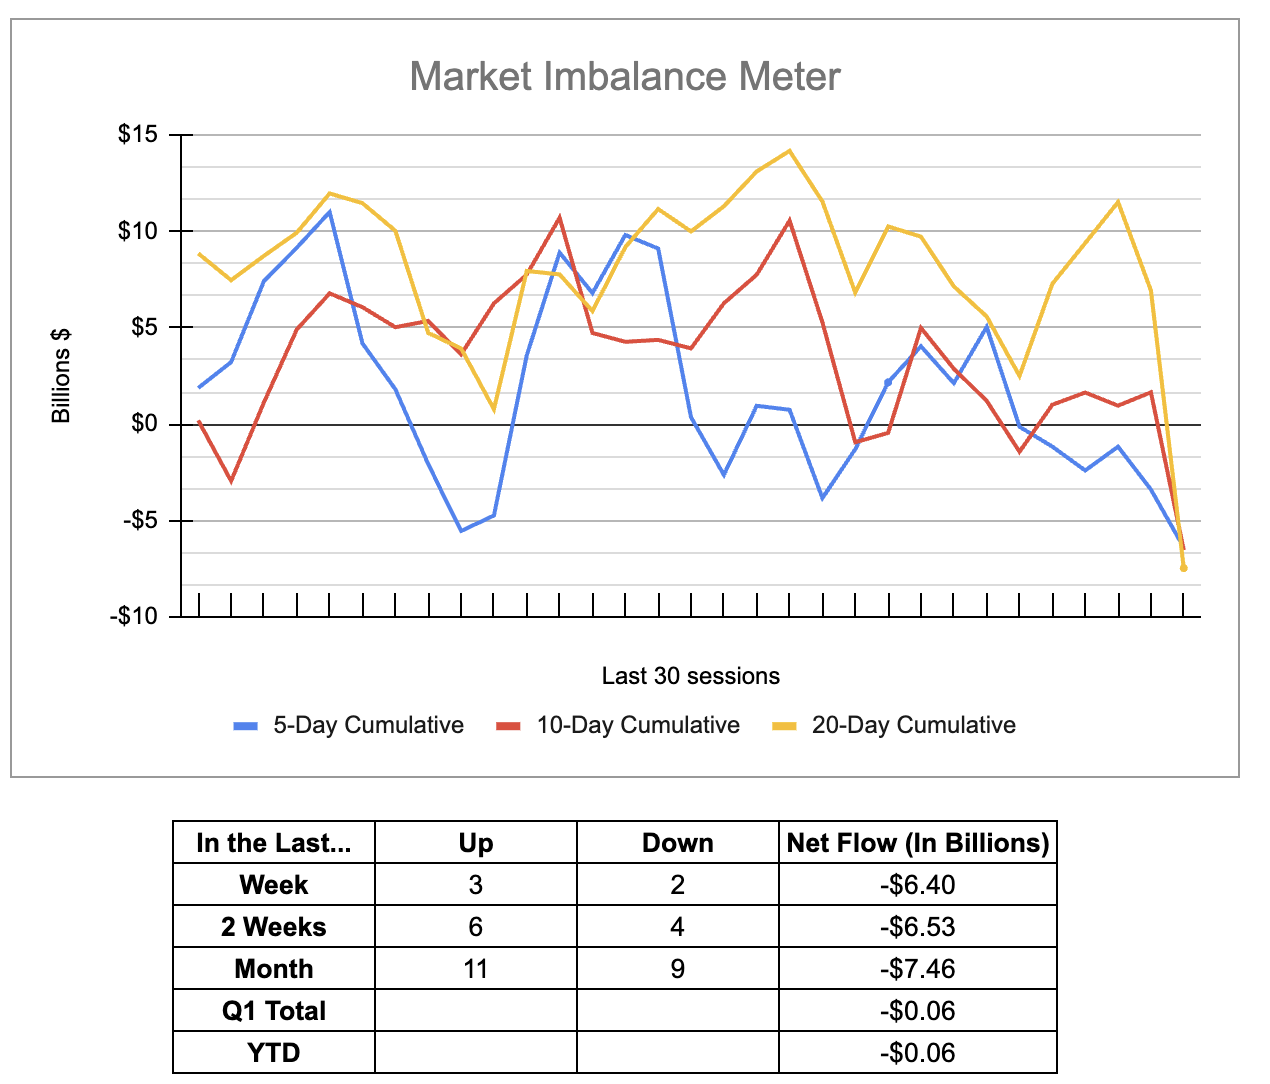
Billions of dollars of stock for sale on the last trading day of January. One of the things about the imbalance meter is we get the early data, which showed over $1 billion to sell. If you were already leaning short — or looking to short — yesterday’s early look was a great indication of how the close was setting up. As I have always said, if you want to know where the S&P is going, follow the money.
By the way, I have lowered the price of the NYSE imbalance meter to $75.00 a month. I am not going to be publicly posting the imbalance until after 4:00 ET, so if you like the information, here is the signup.
Technical Edge
-
NYSE Breadth: 19% Upside Volume (!)
-
Nasdaq Breadth: 36% Upside Volume
-
Advance/Decline: 30% Advance
-
VIX: ~14
ES
Levels from HandelStats.com
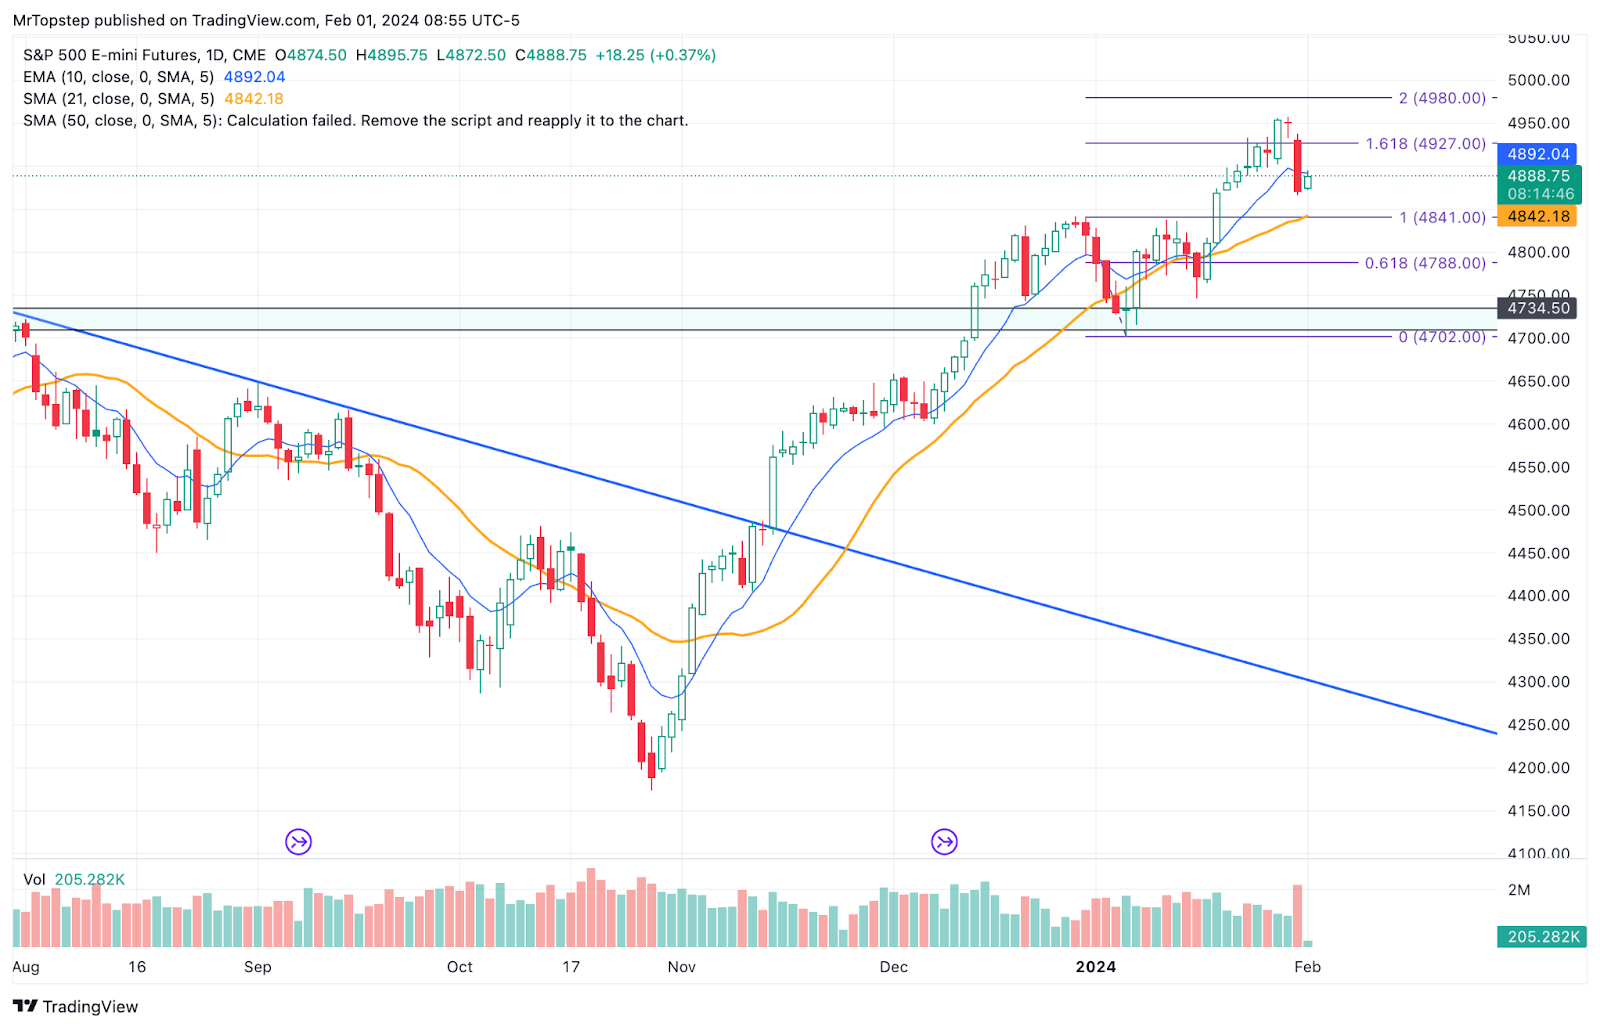
ES Daily
-
Upside: Trade above 4893.50 targets 1sd at 4902.30. Hourly close above there targets 4908.38, daily close above here turns uptrend back on. Trade and hourly close above 4908.38 targets 2sd at 4932.59. Hourly close above there targets 4942.50, then 4946.50, then 4952.75, then 3sd at 4962.89.
-
Downside: Trade and hourly close below 4884.25 targets settlement at 4872, then 4866. Trade and hourly close below 4866 targets -1 sd weekly at 4853.59, then -1sd at 4841.70. Hourly close below there targets 4835.25, then 4824.88, then 4816, then -2sd at 4811.41. Trade and hourly close below there targets -2sd weekly at 4792.67.
Guest Post
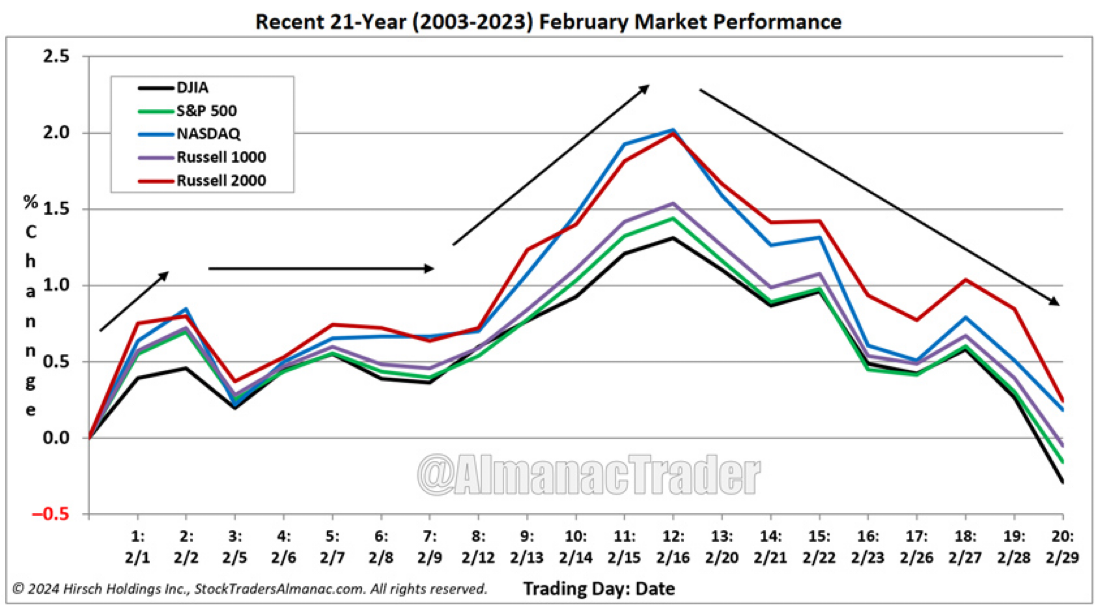
Typical February Performance: Weakness After Mid-Month Peak
Over the last 21 years, the first trading day of February was bullish for DJIA, S&P 500, NASDAQ, Russell 1000 and 2000. Average gains on the first day range from 0.39% by DJIA to 0.75% by Russell 2000. After a strong opening day, strength has tended to fade until around the seventh trading day. From there until around the 12th trading day all five indexes have historically enjoyed gains. But those gains have not held until the end of February with a peak occurring around mid-month. By the end of February, only NASDAQ and Russell 2000 have remained slightly positive while DJIA, S&P 500, and Russell 1000 turn negative.
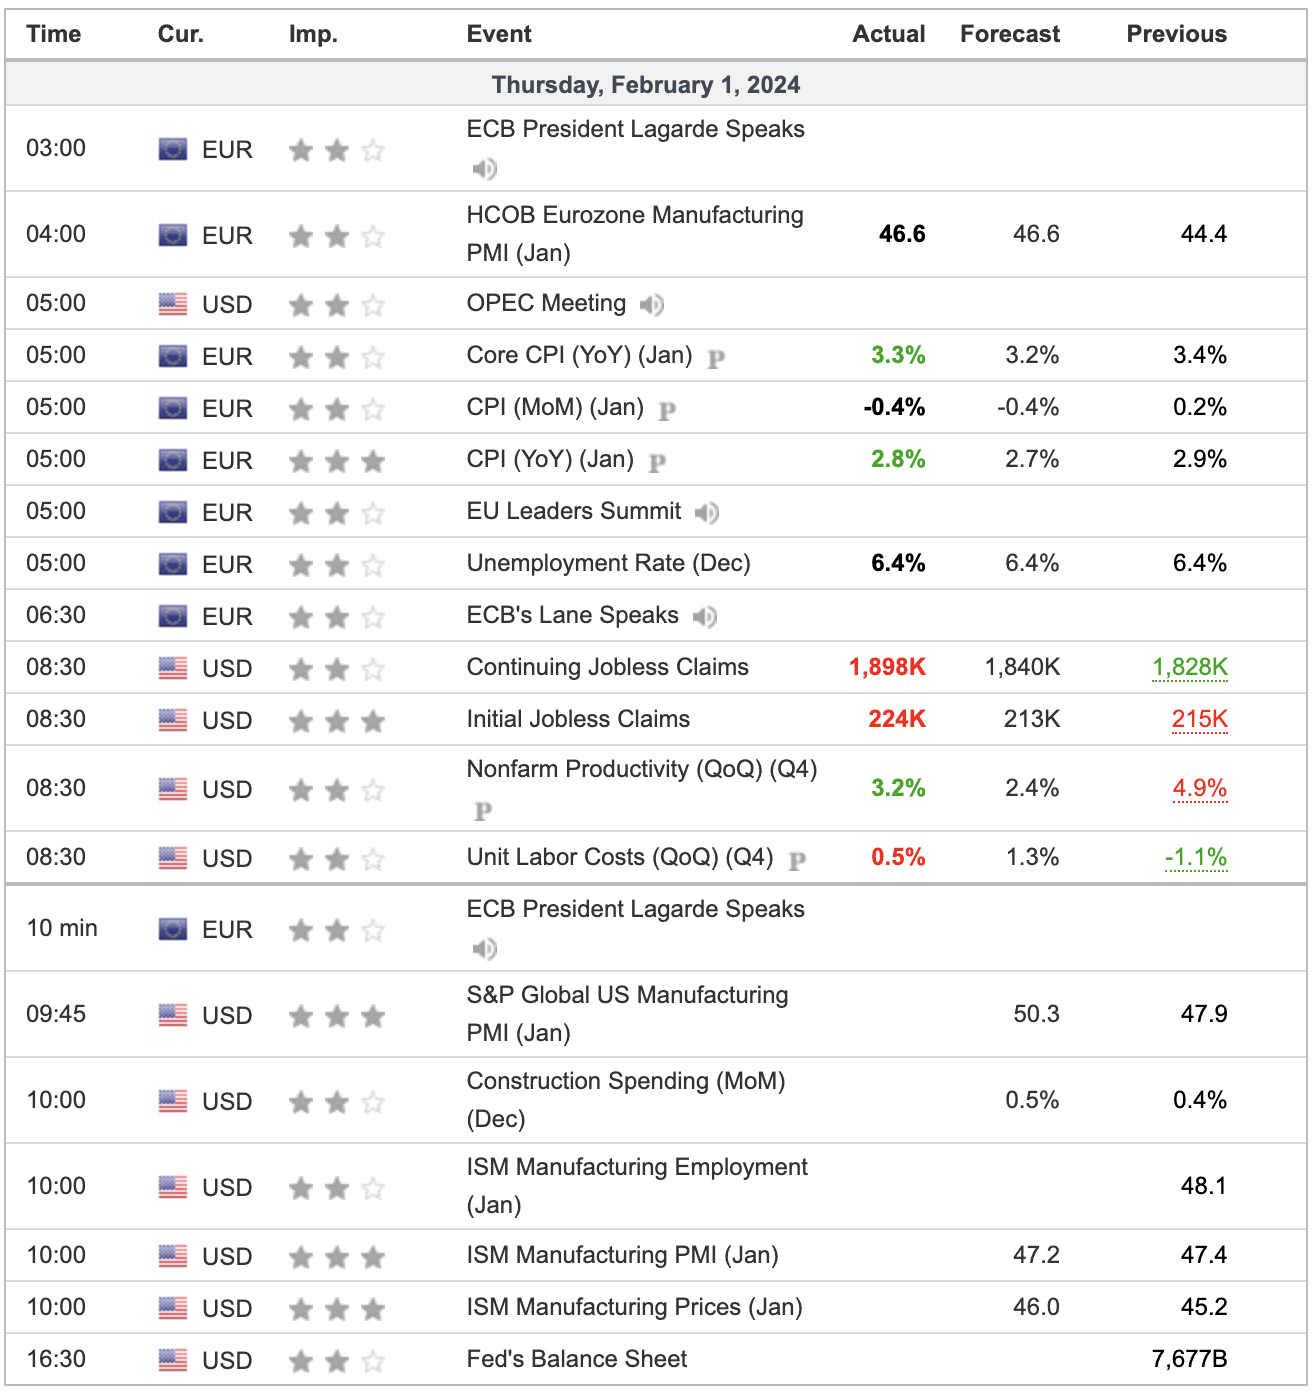
Economic Calendar
Comments are closed