Range Trade (Somehow) Continues to Tighten
Now is not the time to get sloppy.
Follow @MrTopStep and @BretKenwell on Twitter and please share if you find our work valuable.
Our View
Jannet Yellen said that the lack of a budget deal is already weighing on the US economy.
While we have seen this act before, I think it’s odd that all day yesterday there was a non-stop rotation out the the ES (down) the Dow (YM – down) and the Russell 2000 (RTY – down) with the NQ up 15 points or 0.11%. I admit that the size of the gain is not impressive, but for the other three to end the day right near their lows for the day and for the Nasdaq to end higher on the session says something.
There were several late-day headlines yesterday, from Biden flying back from the G7 early to Kevin McCarthy and the constant debt-ceiling headlines. That was after navigating all the Fed-heads throughout the day (with five speakers).
Despite yesterday’s rough ending, the S&P cash (SPX) all but gave us another inside day (although it technically broke the prior day’s low by 0.40 points).
Our Lean
Here’s the deal everyone. We can’t change the trading environment. We can’t fight what the tape is doing. If it wants to trend higher, we buy the dips. If it wants to sit in a range like it’s doing now, we trade the ranges — by buying the dips into support and selling the rallies into resistance — until the range breaks.
Our Lean: Keep playing the ranges here. AKA buy the dips into the bottom of the range and sell the rallies into the top of the range. Lately, the top of the range has been around 4165, but extends up to 4175-ish. On the downside, buyers have stepped in around the 4110 to 4115 area.
A break of either side of the range could trigger a stop-run into the outer edges of the larger range. Maybe it will take Opex and Powell (on Friday) to break this up a bit, but for now, this is what we’ve got.
MiM and Daily Recap
The ES made a high at 4155.25 and a low of 4135.25 and opened Tuesday’s regular session at 4138.75. From there, it pulled back to the 4136.50 level and then traded up to 4148.75, dropped down to a new low of 4127 at 10:16 and then rallied up to 4141.50 at 10:44. For the next three hours, the ES back-and-filled around the VWAP at 4138, rallied up to 4237.75 at 12:42 and then dropped down to 4130.25 at 2:43.
After retesting the earlier low, the ES rallied back up to the VWAP at 4139.75 at 3:35, then took out the sell stops under 4130. It traded down to 4123.25 at 3:50 as the final imbalance showed $189 million to sell, hung near the low for a few minutes and then broke down to 4120 after the 4:00 cash close. The ES rallied up to 4130 at 4:29 and settled at 4127.50 on the 5:00 futures close, down 21.5 points or -0.51% on the day.
In the end, there was a very big rotation: buy NQ / sell ES, YM and RTY. That held the ES in a very narrow trading range for a big part of the day. In terms of the ES’s overall tone, it was stuck. In terms of the ES’s overall trade, volume was on the low side at 1.28 million contracts traded.

Technical Edge
-
NYSE Breadth: 17% Upside Volume (!)
-
Nasdaq Breadth: 40% Upside Volume
-
-
Advance/Decline: 19.5% Advance
-
VIX: ~$17.50
That DXY note from yesterday was something to keep an eye on and now it’s powering higher again (updated chart below). That said, the S&P basically gave us another inside day as the range continues to tighten.
Retail — HD, TGT & TJX — has been unimpressive thus far and overall, the sector continues to disappoint (chart on that below too).
AVGO gave us another trim yesterday as it trades well. Updated below.
S&P 500 — ES
The upside has been capped by ~4175 (and more recently, by 4160-65). The downside limited to ~4115. We need a break of one of these areas to push the outer edges of the range.

ES Daily
-
Upside Levels: 4165, 4170-75, 4198-4206
-
Downside levels: 4110-15, 4100, 4080-85, 4063
SPY
I wish there was more to say. At this rate we will be trading “unchanged” for the day next Wednesday! Kidding aside, we basically play the ranges until the range breaks.
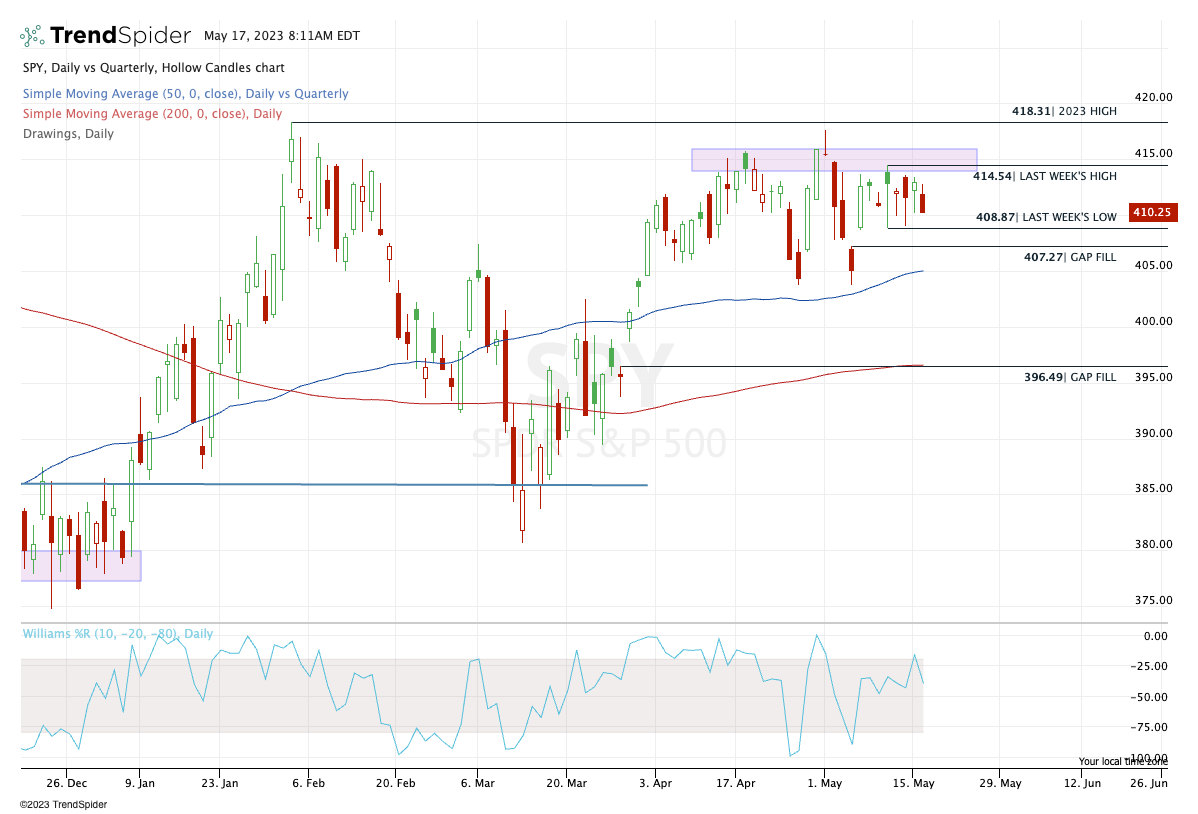
SPY Daily
-
Upside Levels: $414-16, $417.50 to $418.30
-
Downside Levels: $409, $407, $403 to $404
SPX
-
Upside Levels: 4150, 4167-70, 4187-4200
-
Downside Levels: 4100, 4085, 4050
QQQ
How do you like that for upside extension targets?
Perfect test of the 161.8% and a late-day pull. Now see if we can push $330+ on the upside and raise stops. $323.50 is key on the downside.

QQQ Daily
-
Upside Levels: $29, $331.50
-
Downside Levels: $323.50, $321.50, $318.50
NQ
Got our 13,500 level, now watch y’day high for confirmation of more upside. The NQ/QQQ is the only index not stuck in a range or downtrend.
-
Upside Levels: 13,550, 13,600
-
Downside Levels: ~13,300, 13,160, 13,000
DXY

DXY daily
Not how DXY went weekly-up on Friday over $102.40, flirted with a breakdown back below this level yesterday, but closed strong.
Now pushing new highs, a strong DXY is generally a headwind. Over $102.75 and it can push toward the $103.35 to $104 area previously outlined.
XRT

XRT Daily
Not a trade, but the XRT has to have the weakest “higher lows” I’ve seen in quite some time. Doesn’t exactly scream “healthy consumer!” but if they don’t bury this group on lackluster earnings and outlooks, maybe we could see a relief rally.
Otherwise, a break of $59 opens up more downside pressure.
Uber

Uber Daily
Remember this setup from a few days ago. Prior high retest & 10-day ema. If it tests the area above and holds, $36 is a reasonable stop-loss. $38.50+ is a good upside trim level.
Guest Post
PTG Taylor 3 Day Cycle
Prior Session was Cycle Day 3 (CD3): Markets continued their balancing “logjam” trading mid-zone for majority of the session, until the final minutes where price aggressively sold down to 4125 lower quartile range edge. Prior range was 31 handles on 1.282M contracts exchanged.
…Transition from Cycle Day 3 to Cycle Day 1
This leads us into Cycle Day 1 (CD1): Battle for directional control continues with price “logjammed”…Violation and conversion of 4125 opens trap door for lower price probes targeting CD1 Average Decline 4097. Failure to breakdown potentially keeps the price range bound until there is a definitive and sustained directional lean. As such, scenarios to consider for today’s trading.
Bull Scenario: Price sustains a bid above 4125, initially targets 4145 – 4150 zone.
Bear Scenario: Price sustains an offer below 4125, initially targets 4110 – 4100 zone.
PVA High Edge = 4142 PVA Low Edge = 4130 Prior POC = 4135
*****The 3 Day Cycle has a 91% probability of fulfilling Positive Cycle Statistics covering 12 years of recorded tracking history.
For more detailed information for both bullish and bearish projected targets, please visit: PTG 3 Day Cycle and/or reference the Cycle Spreadsheet below:
Link to access full Cycle Spreadsheet > > Cycle Day 1 (CD1)

Thanks for reading,
PTGDavid
Open Positions
-
Bold are the trades with recent updates.
-
Italics show means the trade is closed.
-
Any positions that get down to ¼ or less (AKA runners) are removed from the list below and left up to you to manage. My only suggestion would be B/E or better stops.)
-
** = previous trade setup we are stalking.
Down to Runners in GE, CAH, LLY, ABBV, AAPL, MCD & BRK.B
-
META — Trimmed ⅓ between $237 and $239 and down to ½ size after $240 trim.
-
Break-even stop. $242-43 is next trim area to get down to ⅓ size.
-
-
CRM — Ideally, $207 to $208 is the first target zone. Can trim on any push to new high over $206.28 (Trim on gap-up)
-
Conservative bulls can stop out below $198. Aggressive bulls may use $195 as their stop.
-
-
AVGO — long from weekly-up at ~$633 — and got our first ⅓ trim near $640 and Tuesday gave us our second trim down to a ½ position at $645+ — Lovely price action here!
-
Now: Breakeven stop IMO. Ultimately, we went to see if we can take AVGO to new highs.
-
maybe a small trim if we see $648.50 to $650.
-
-
** UBER — still watching the $37 to $37.50 BTD setup from Friday.
Go-To Watchlist
Feel free to build your own trades off these relative strength leaders
Relative strength leaders →
-
MCD, PEP & KO, WMT, PG — XLP
-
LLY, CAH
-
NVDA, CRM
-
MSFT, AAPL, META
-
LULU, CMG, DKS
-
FSLR — guess it’s back on the list. New 52-week highs.
Relative weakness leaders →
-
PYPL
-
MET
-
CF, MOS
-
PFE
-
GLOB
Economic Calendar

Disclaimer: Charts and analysis are for discussion and education purposes only. I am not a financial advisor, do not give financial advice and am not recommending the buying or selling of any security.
Remember: Not all setups will trigger. Not all setups will be profitable. Not all setups should be taken. These are simply the setups that I have put together for years on my own and what I watch as part of my own “game plan” coming into each day. Good luck!
Update your email preferences or unsubscribe here
© The Opening Print
228 Park Ave S, #29976, New York, New York 10003, United States
No responses yet