Stocks Rip as Inflation Report Comes In Light
Could we be heading a lot higher?
Follow @MrTopStep on Twitter and please share if you find our work valuable!
Our View
Unfortunately, I have Covid-19 right now. I have had it in the past and the first time I didn’t even know I had it. The other times I had it, I got sick but within a few days, I was on the mend.
So the View and the Lean are going to be a little light. We’ll have the recap down below, all the usual stats and the levels from HandelStats.
The CPI data came in light (see the economic calendar below), with each of the headline numbers missing expectations. That’s got bonds and stocks ripping, with the 10-year yield at its lowest level since September.
Remember to trade smart, use stops and stay disciplined.
Our Lean
Our Lean: The DAX has gone up 750 points in two weeks, while the ES has rallied 320 points and the NQ has rallied ~1,500 points. All of this leads me to believe we are still going higher… maybe a lot higher.
Should the CPI number cause weakness, I want to be a buyer at the 4390 to 4395 level. If the futures come in higher, I want to sell the early rallies and buy weakness.
For those of you who like HandelStats levels, here they are:
-
Upside: Trade and hourly close above 4435.50 targets 4451.85, then 1 sd at 4456.17, hourly close above there targets 4460.50, then 4464.27. Hourly close above there targets 4471.60, then 2 sd at 4485.35. Hourly close above there targets 4493.12.
-
Downside: Trade and hourly close below 4409.50 targets 4403.38, then 4399.51 and -1 sd at 4397.83, then 4395.38. Hourly/ DAILY close below there is a negative. Below there targets 4392.75, hourly close below there targets 4374 and 4372, then -2 sd at 4368.65.
MiM and Daily Recap
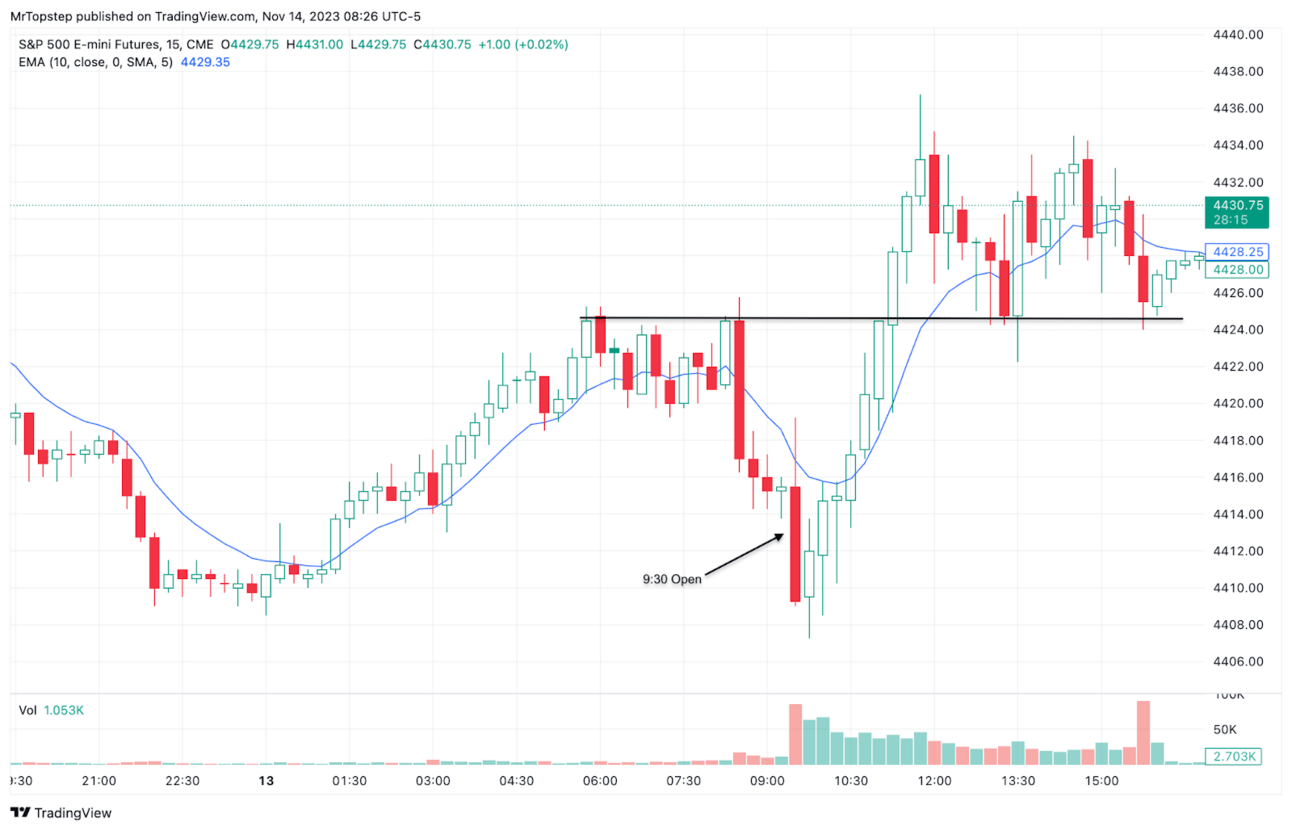
ES 15-min recap
The ES traded down to 4408.50, rallied up to 4435.50 on Globex and opened Monday’s regular session at 4415.50. After the open, the ES traded up to 4419.25, traded down to 4407.25 at 9:57, and then rallied up to 4436.75 at 11:49. From there, it pulled back to 4222.25 at 1:36 and then sold off down to 4422.25 at 1:37. After the low, the ES rallied up to a lower high at 4434.50 at 2:50, pulled back to the 4426.00 at 3:04 and traded 4429 as the 3:50 cash imbalance showed $1.268 billion to buy and traded 4425.50 on 4:00 cash close. After 4:00 the ES drifted higher and settled at 4428 on the 5:00 futures close, down 5.25 points on the day.
In the end, it’s simple: The ES pulled back and rallied. In terms of the ES’s overall tone, every pullback was bought. In terms of the ES’s overall trade, volume was lower: 242k ES traded on Globex and 999K traded on the day session for a total of 1.241 million contracts traded.

Technical Edge
-
NYSE Breadth: 47% Upside Volume
-
Nasdaq Breadth: 51% Upside Volume
-
Advance/Decline: 48% Advance
-
VIX: ~15
ES
Levels from HandelStats.com

ES Daily (with CPI reaction included)
-
Upside: Trade and hourly close above 4435.50 targets 4451.85, then 1 sd at 4456.17, hourly close above there targets 4460.50, then 4464.27. Hourly close above there targets 4471.60, then 2 sd at 4485.35. Hourly close above there targets 4493.12.
-
Downside: Trade and hourly close below 4409.50 targets 4403.38, then 4399.51 and -1 sd at 4397.83, then 4395.38. Hourly/ DAILY close below there is a negative. Below there targets 4392.75, hourly close below there targets 4374 and 4372, then -2 sd at 4368.65.
NQ

NQ Daily (with CPI reaction included)
-
Upside: Trade and hourly close above 15606.40 targets 15652.25, hourly close above there targets 1 sd at 15691.11, then 15710.25. Hourly close above there targets 15754.40 (Hourly close above 15606.48 makes this a target likely to be hit). Hourly close above 15754.40 targets 2 sd at 15830.47. Above 15836.75 is likely to go to 15902.40.
-
Downside: Trade and hourly close below 15510.20 targets 15477.77, then 15415.50. Hourly close below there targets 15303 and 15287.27, then -2 sd at 15273.03.
Economic Calendar

Disclaimer: Charts and analysis are for discussion and education purposes only. I am not a financial advisor, do not give financial advice and am not recommending the buying or selling of any security.
Remember: Not all setups will trigger. Not all setups will be profitable. Not all setups should be taken. These are simply the setups that I have put together for years on my own and what I watch as part of my own “game plan” coming into each day. Good luck!
Update your email preferences or unsubscribe here
© 2023 The Opening Print
228 Park Ave S, #29976, New York, New York 10003, United States
No responses yet