Follow @MrTopStep and @BretKenwell on Twitter and please share if you find our work valuable.
Our View
Why has the S&P been going down? I think there are several reasons, but the main one is inflation and higher rates. The bulls ran the market pretty hard to start the year, but the negatives are starting to pile up again.
Rising US debt and a rising US dollar aren’t helping. And has anyone noticed the 10-year yield, which is flirting with 4%? For what it’s worth, when the S&P was at the 2022 low, the 10-year was at 4.33%.
Then there’s also the geopolitical issues. Russia’s at the forefront of course, but rising tensions with China is also a concern.
Without nukes, Russia is a second-rate military with low-quality military equipment. That all said, the 1-year anniversary of the war is only three days away and there is always the worry that there will be a major event. Any sort of nuclear situation or expansion in geopolitical war — like in Asia — will be a major issue for equities.
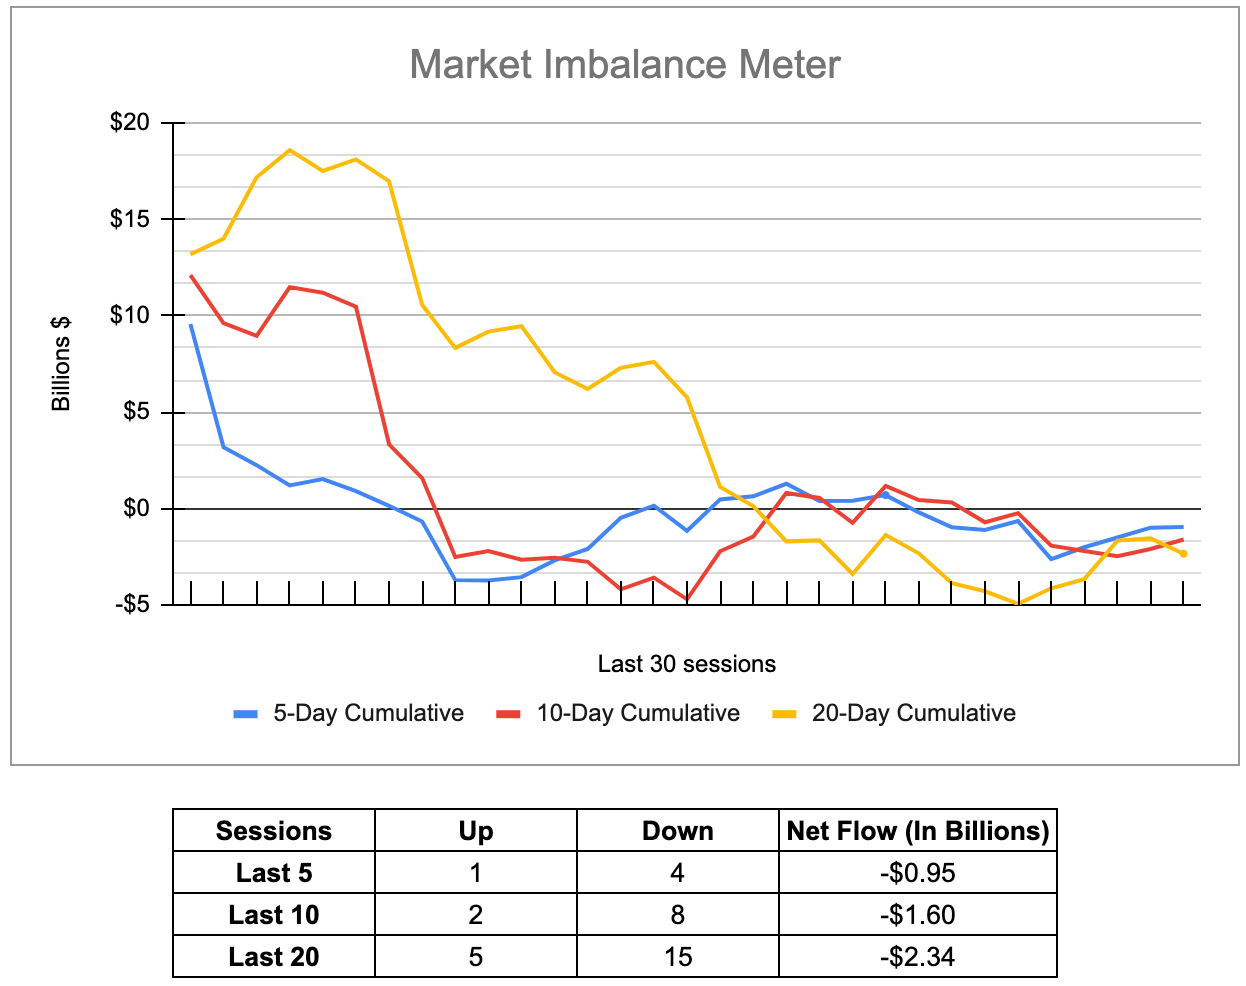
If you need any proof that “the guys with the better seats” actually have better seats, just look at how they have been net sellers over the last few weeks — with the MIM being on the buy side just two times over the last ten sessions — ahead of this decline.
Our Lean
As of 8:00 a.m. ET, the ES has undercut yesterday’s low, tagged the major support level outlined yesterday and reversed to the upside — one of our favorite setups.
Now the question becomes, will that setup reappear in the regular-hours session?
As we outlined last week, the Stock Traders’ Almanac had the Nasdaq down 17 of the last 28 occasions, while the week after the February Opex week has the Dow down 14 of the last 24.
Lastly, February is the weak link in the “best six months for stocks.”
Where does that leave us now? I don’t doubt the ES can bounce after Tuesday’s decline. It was not only the worst Tuesday of the year, but it was the worst session so far of 2023. The index sold off a lot ahead of today’s Fed Minutes.
While no rate increase is expected today, odds are increasing that we will get a 50 basis point hike instead of a 25 basis point hike next month. And the odds are also increasing that higher rates last longer than the market was pricing in.
Our Lean: I don’t like ‘em but the ES and NQ are overdue for a few upside stop runs. It seems to me that the ES overshot to the downside and is due for a pop back into the 4035 to 4040 area. I’d sell this area on a pop and let’s see what the Fed has to say now.
MiM and Daily Recap
The ES traded down to 4045.25 on Globex and opened Tuesday at 4045.25 and rallied up to 4056.25 in the first 15 minutes. From there it broke down and continued in a downward channel and made a low for the day 4002.00 at 2:25. From there, it rallied up to 4015. at 2:45, chopped around for the next hour between 4015 to 4006. At 3:50 it traded 4012.50 as the MIM came out with $500 million to sell — of course.
The ES traded 4006.25 at 4:00 and settled at 4007.75 at the 5:00 futures close, down 79.75 points or 2% on the day.
In the end, the bears saw a solid downside performance. In terms of the ES’s overall tone, it was weak but the NQ was weaker. In terms of the ES’s overall trade, volume was in-line with the average, at 1.82 million contracts traded.
Technical Edge —
-
NYSE Breadth: 15% Upside Volume (!)
-
Advance/Decline: 12% Advance (!)
-
VIX: ~$23
I was thinking yesterday: “I hate fighting the larger trend.”
I really do. I don’t like to fight the Fed and I don’t like to fight the trend. So far this year, the predominant trend has been to buy the dips and buy the upside rotations — particularly in tech.
But I’m finding it harder and harder to be a bull right now.
Maybe that’s overly cautious and perhaps it’s flat out wrong. However, the 10-year yield is at a multi-month high, while the dollar continues higher. The CPI, PPI and Jobs report all came in higher-than-expected. Three months ago that would have buried equities. Now investors are shrugging it off.
Bonds are tumbling on the prospects of “higher for longer,” as rate-bets continue to call for more increases. That makes it hard to be a confident buyer. Or at least, makes it hard for me to be.
Individual stock trades to come in a separate email, pre-market today.
S&P 500 — ES
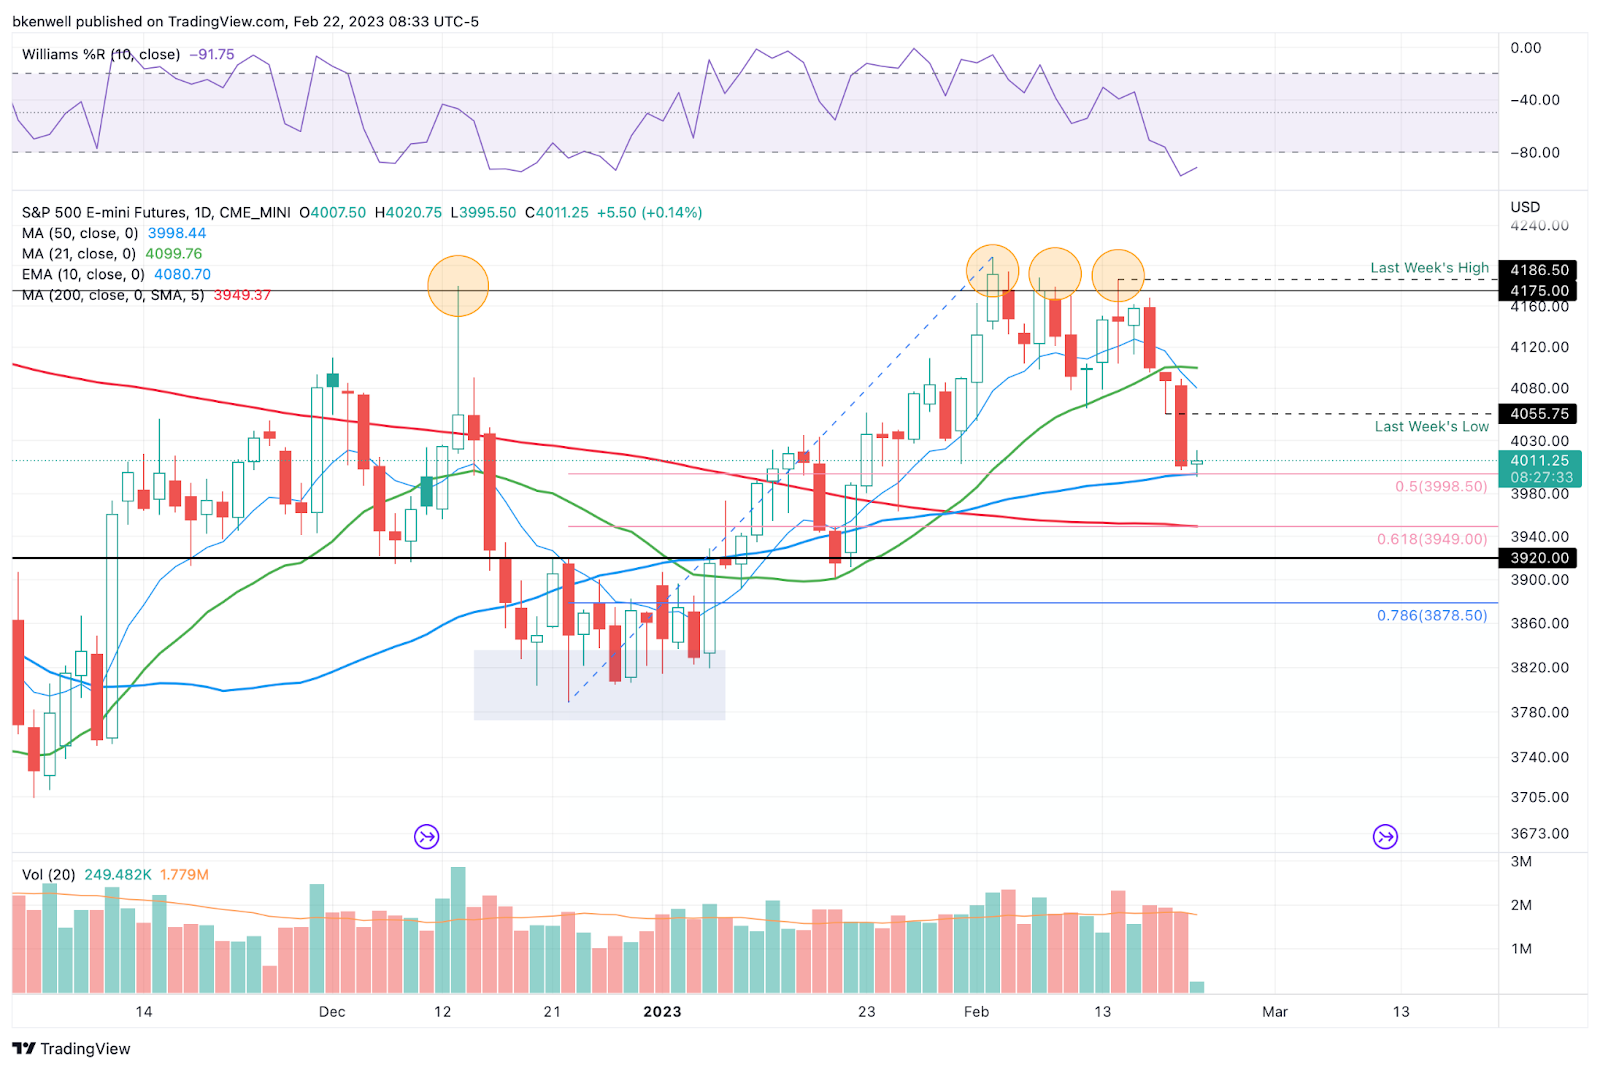
The charts tell the story. We had rejection from the 4175 area, then went weekly down below 4056 early on Tuesday — the first session of the week. Overnight, the ES found stability at the 50-day moving average and 50% retracement and reclaimed yesterday’s low on the bounce.
The trade: The tag of major support and reclaim of yesterday’s low is our bread-and-butter setup. I don’t know if we’ll see it again in the regular session — like a quick dump down to the Globex lows & bounce — but if we do, consider buying the same setup (with the trigger being the reclaim of the prior low, 4002).
If we do get an upside stop-run, keep 4037 to 4045 in mind — that’s the 50% to 61.8% retracement zone of yesterday’s range. Above that and last week’s low of 4056 could be a key pivot.
A lot of potential for a stop-run and full range retracements today with the Fed on tap.
If support blows out near 4000, do not rule out 3950 — which is the 200-day sma and 61.8% retracement combo.
SPY

Once we broke $400, it was tough to reclaim, as evidenced on the 30-min chart before. We have a feeble pre-market rally underway this morning, but it’s still below $400, as the 10-ema on the 30-min pressures it from above.
Above $400 without a breakdown could put $401.50 to $402 in play before it slows down. Otherwise, $400 is the pivot and failure to sustain above it, opens the SPY up to lower prices.
Daily:
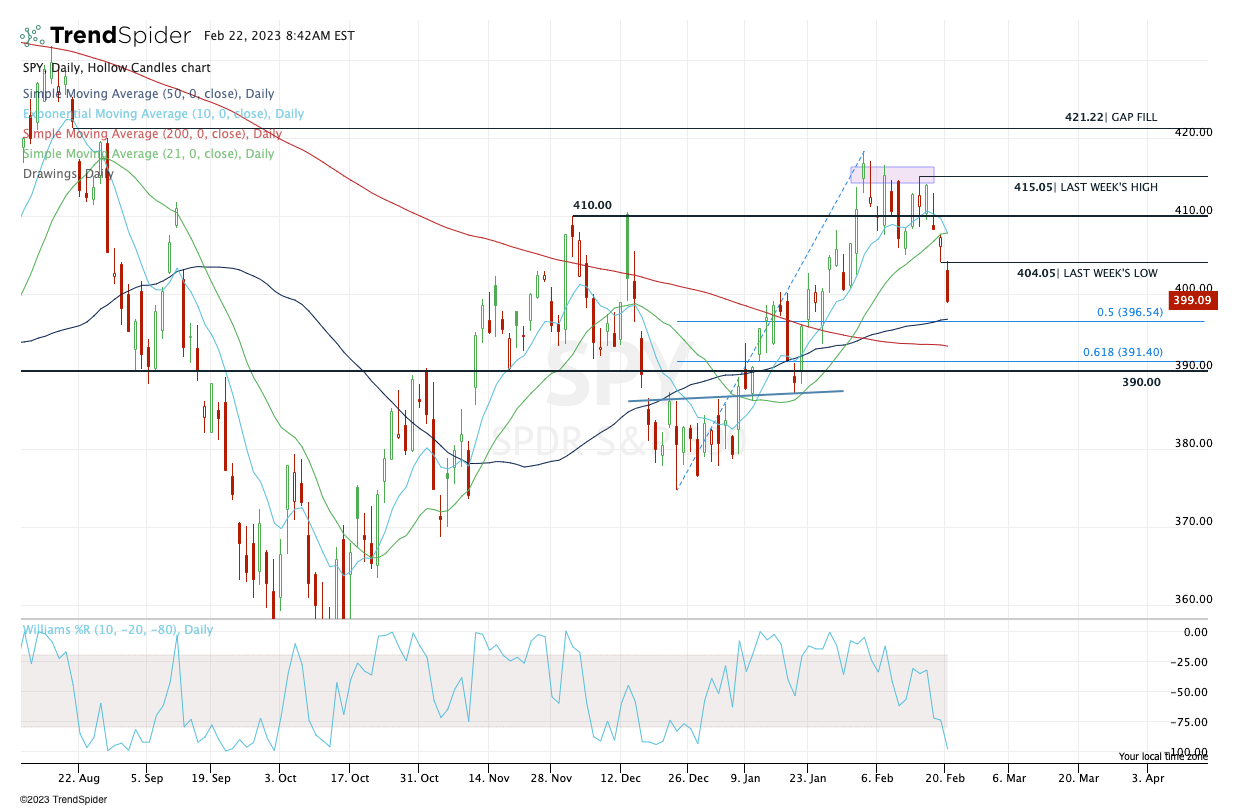
As you can see on the daily chart, we were quick to go weekly down. Above $400 can unwind some of the damage, but don’t think we can’t go down to $396.50 and test the old “50-day + 50% retrace” area.
Open Positions
-
Bold are the trades with recent updates.
-
Italics show means the trade is closed.
-
Any positions that get down to ¼ or less (AKA runners) are removed from the list below and left up to you to manage. My only suggestion would be B/E or better stops.)
-
** = previous trade setup we are stalking.
-
NVDA — long from $210 & Trimmed ⅓ at $219+, $223+ and $230
-
Absolute beauty thus far. Down to ¼ against a B/E or better stop. Up to you on how to manage from here — EPS THIS WEEK.
-
-
MRK — On watch for a daily-up over $109.88 and/or a weekly-up over $110.
-
Initial stop can be as tight at $108 or as loose as $105, (trader’s preference). Initial target for ⅓ trim is $112.50.
-
Go-To Watchlist
*Feel free to build your own trades off these relative strength leaders*
Relative strength leaders → Many losing steam.
-
AQUA
-
AEHR
-
GE
-
NVDA, TSLA
-
SBUX
-
MELI
-
NFLX
-
WYNN, LVS
-
AXP
-
BA & Airlines — AAL, DAL, UAL
-
TJX, ULTA, NKE
-
CAT
-
HCCI
-
XLE — XOM, CVX, COP, BP, EOG, PXD — (Weekly Charts)
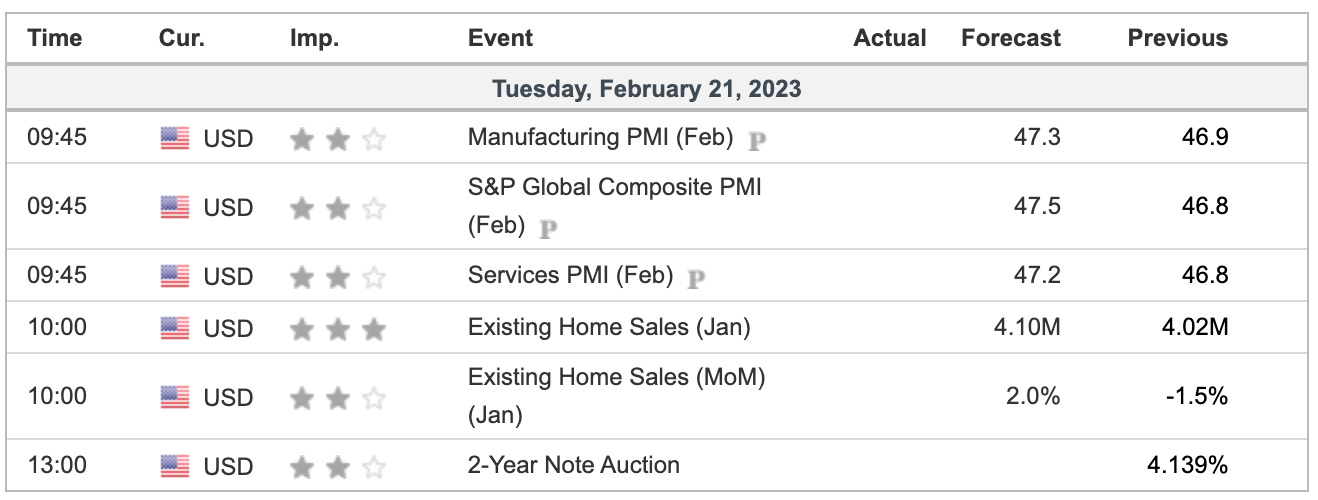
Economic Calendar
No responses yet