Follow @MrTopStep and @BretKenwell on Twitter and please share if you find our work valuable.
Our View
We get a lot of Goldman Sachs and JPMorgan bank research reports and you know what? When you add it all up, they don’t really know anything more than you and I. Sure they’ve got the ‘quants’ and all the research, but they get bombed too.
Why do I say that? Because there has never been anything like what we are seeing today. We have had geopolitical issues before, as well as high inflation and recessions. But never before have we had all of it once along with algorithmic trading.
How do you avoid getting chopped up in this? Well the first one is simple: Don’t trade. Put your money in bonds and make 5%+ until the smoke clears. The other option is to trade less and pick your spots better.
I know this is going to sound stupid, but these markets are going to do what they are going to do…chop people up. For me it’s simple, when everyone is long and convinced it’s going higher, the markets will sell off. When everyone gets bearish and short, it will go back up.
Our Lean
The ES closed lower yesterday, although not by much and it settled above 4000 — well off the low. There are four more trading sessions in February and my guess is we are in for more of the same action.
I am looking for a trade set up for Friday and will talk more about it tomorrow but as for today, if the ES somehow gaps lower (which doesn’t appear to be the case as of 7:00 a.m., but you never know) I am buying the open or the first dip under the open.
I am still looking to short the ES in the 4035 to 4040 zone.
MiM and Daily Recap
The ES traded down to 3995.50 on Globex and opened Wednesday’s regular session at 4009. The ES chopped around after the open, rallying up 4018, then falling down to 3992.75 at 10:18. From there, it rallied back up to 4005 — just above the prior day’s low — and then traded down to a new low of 3990.50 at 10:26. By 1:25, the ES rebounded to ~4023.
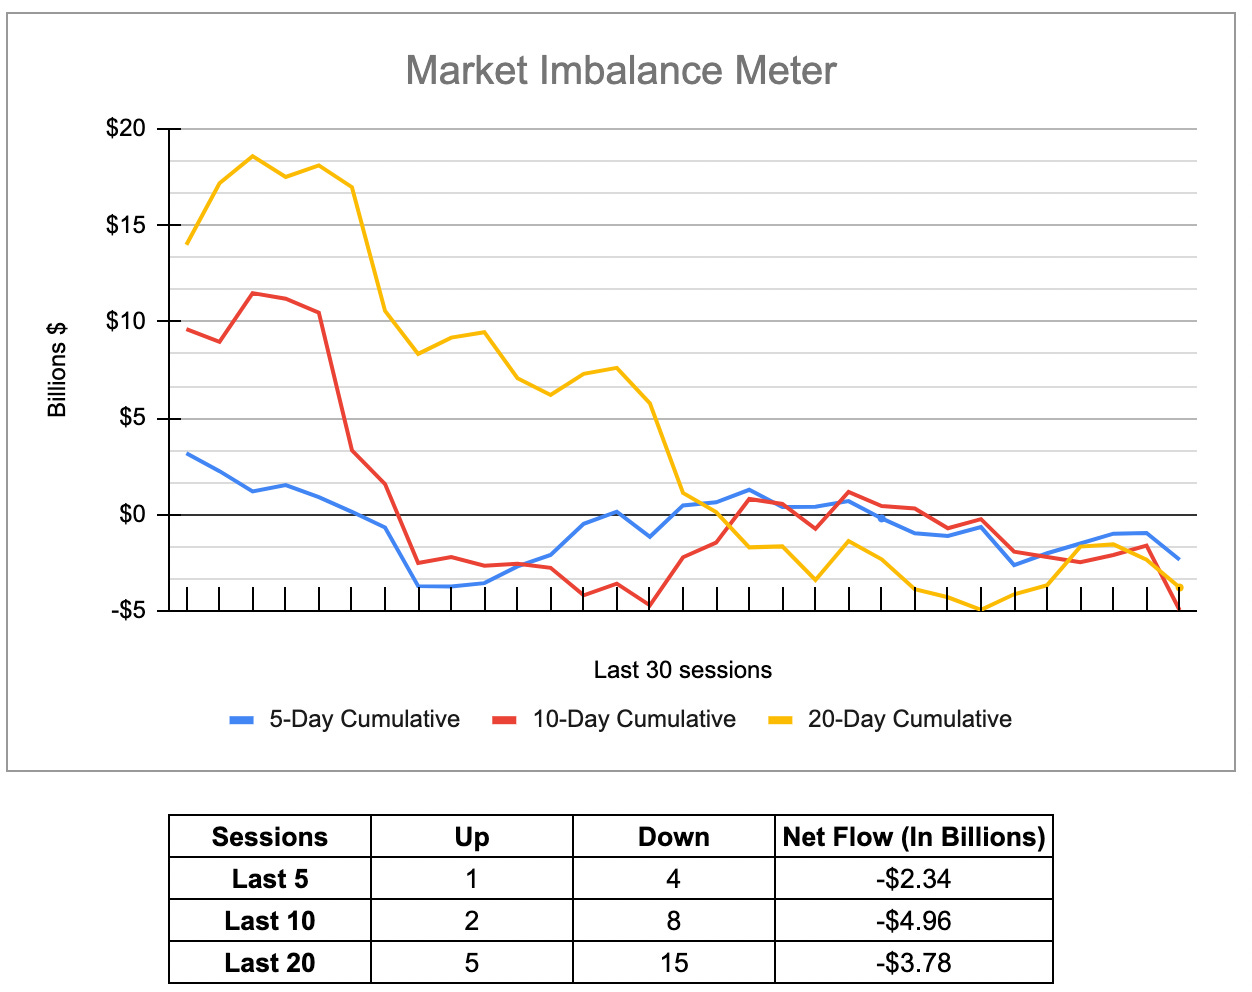
The ES sold off down to 4011.50 after the Fed Minutes hit the tape at 2:00, traded straight up to a new high at 4024, then dropped down to the 3986.25 at 3:00 before bouncing back up to 4006 at 3:26 and finally dropped down to 3985.25 at 3:41. The ES traded down to 3989.50 as the 3:50 cash imbalance showed $1.75 billion to sell, but then traded up to 3997 at 3:55 and traded 3998.75 on the 4:00 cash close. The ES settled at 4009 on the 5:00 futures close, down 6.75 points or 0.15% on the day.
In the end there were a lot of nervous shorts. In terms of the ES’s overall tone, there were a lot of two-way programs going off all day. In terms of the ESs overall trade, volume was in-line with what we have been seeing, with 1.87 million contracts traded.
Technical Edge —
-
NYSE Breadth: 53% Upside Volume
-
Advance/Decline: 54% Advance
-
VIX: ~$22
After a solid correction in the market, are we about to see a rebound back to the upside or will the sellers step in and knee-cap the rallies?
There’s no doubt that the bears are growing more confident. Particularly with the rise in the 10-year yield and the strong US dollar.
Keep both of those measures — (tickers are TNX for the 10-year yield and DXY and/or UUP for the dollar, respectively) — on your screen or watchlist, as they have become quite key lately.
For individual stock traders, please see the note down in the Stock section.
S&P 500 — ES
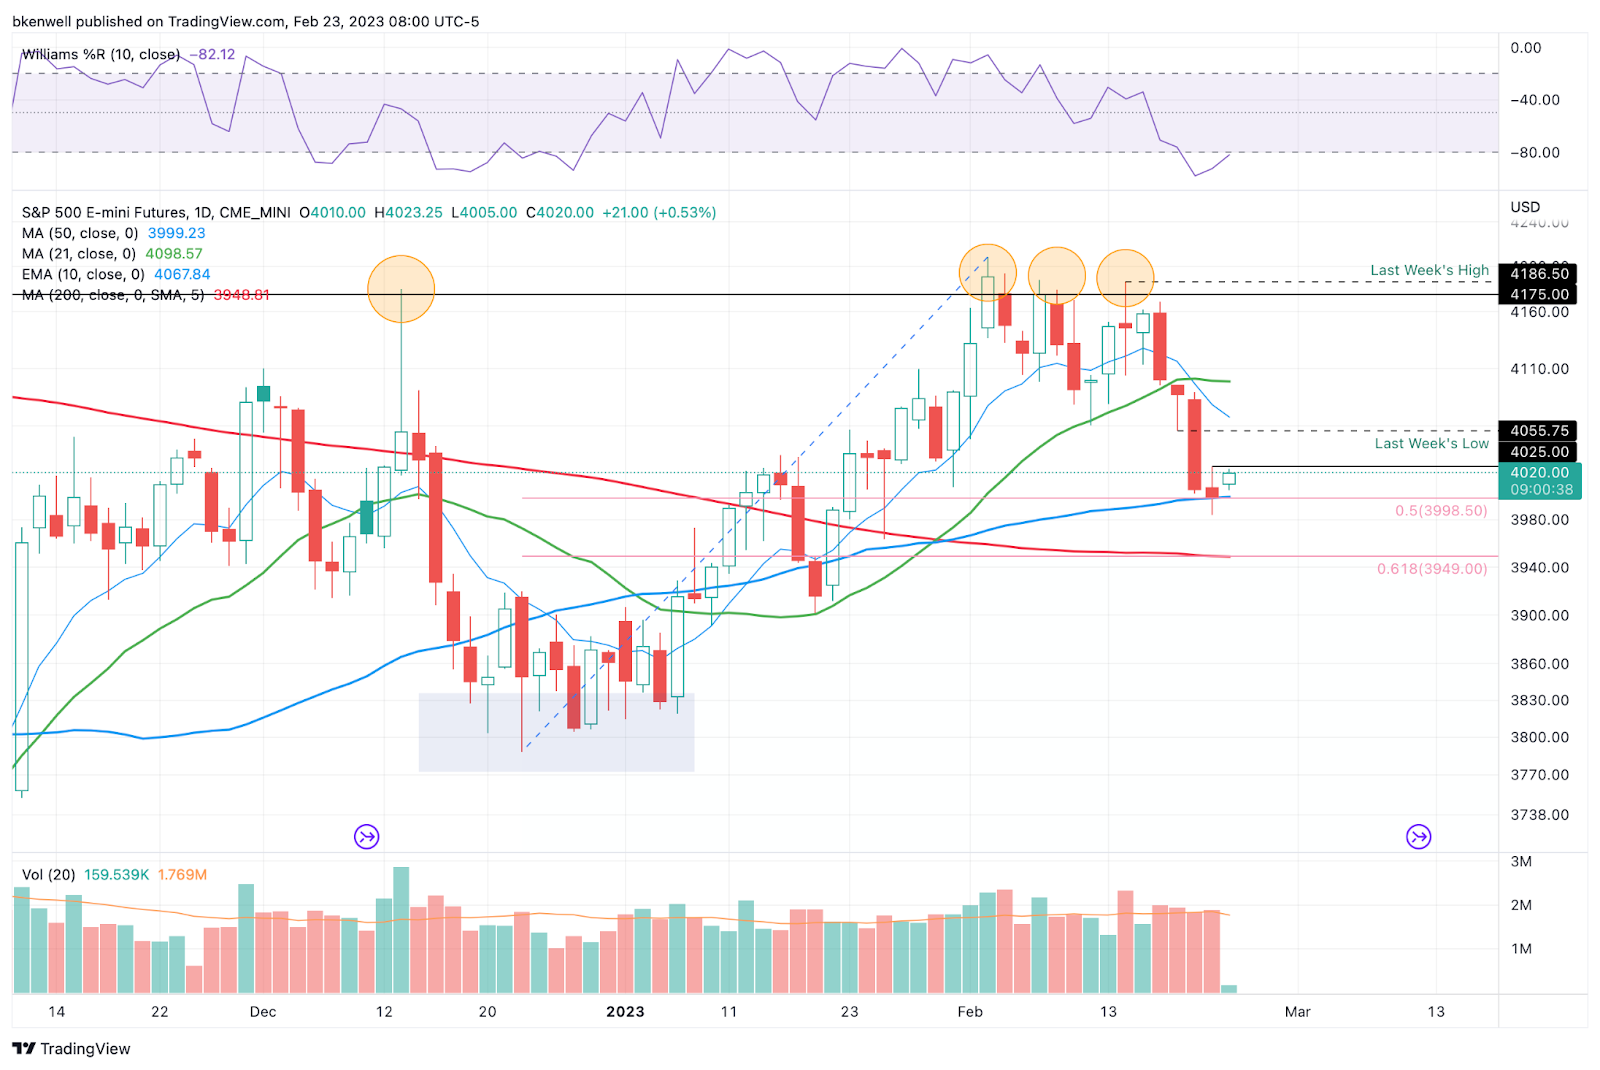
After a choppy start to the session, the ES did ultimately take out the Globex low before reclaiming Tuesday’s low and running 20+ points before a late-day spill.
Ultimately, the ES gave us a doji candle on Wednesday, with the potential for a daily-doji-up rotation over 4025. If we clear 4025, I could see a scenario where last week’s low is back in play and possibly a test of the 10-day ema.
On the downside, a break of 3998.50 does open the door down to yesterday’s low of ~3984. If that plays out, I think we need to keep 3950 on our radar.
SPY
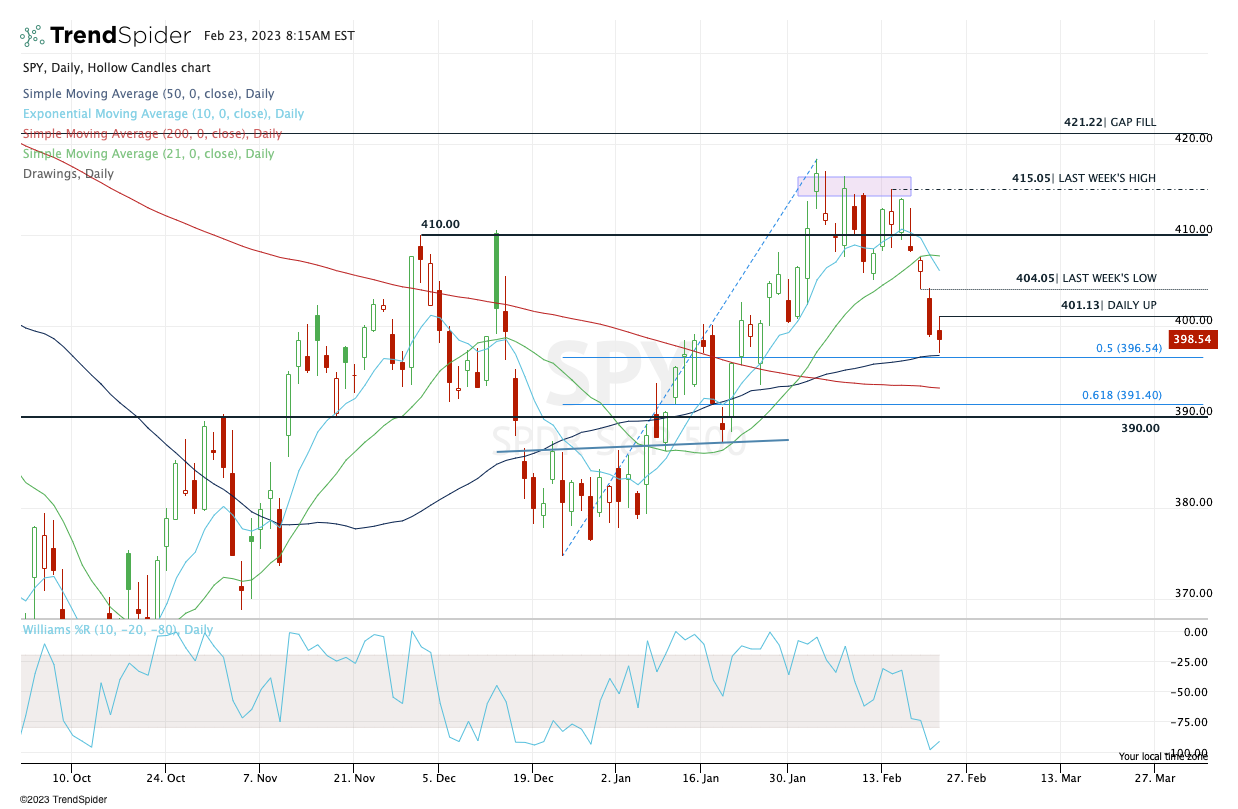
Yesterday we wrote, “don’t think we can’t go down to $396.50 and test the old ‘50-day + 50% retrace’ area.”
It didn’t quite get there, bottoming at $397. But you can see the strong reaction out of this zone.
If the SPY can go daily-up over $401.13 without reversing, last week’s low near $404 is in play.
Also, if breadth is strong today, it may be a buy-the-dips type of market after four straight down days.
ABNB
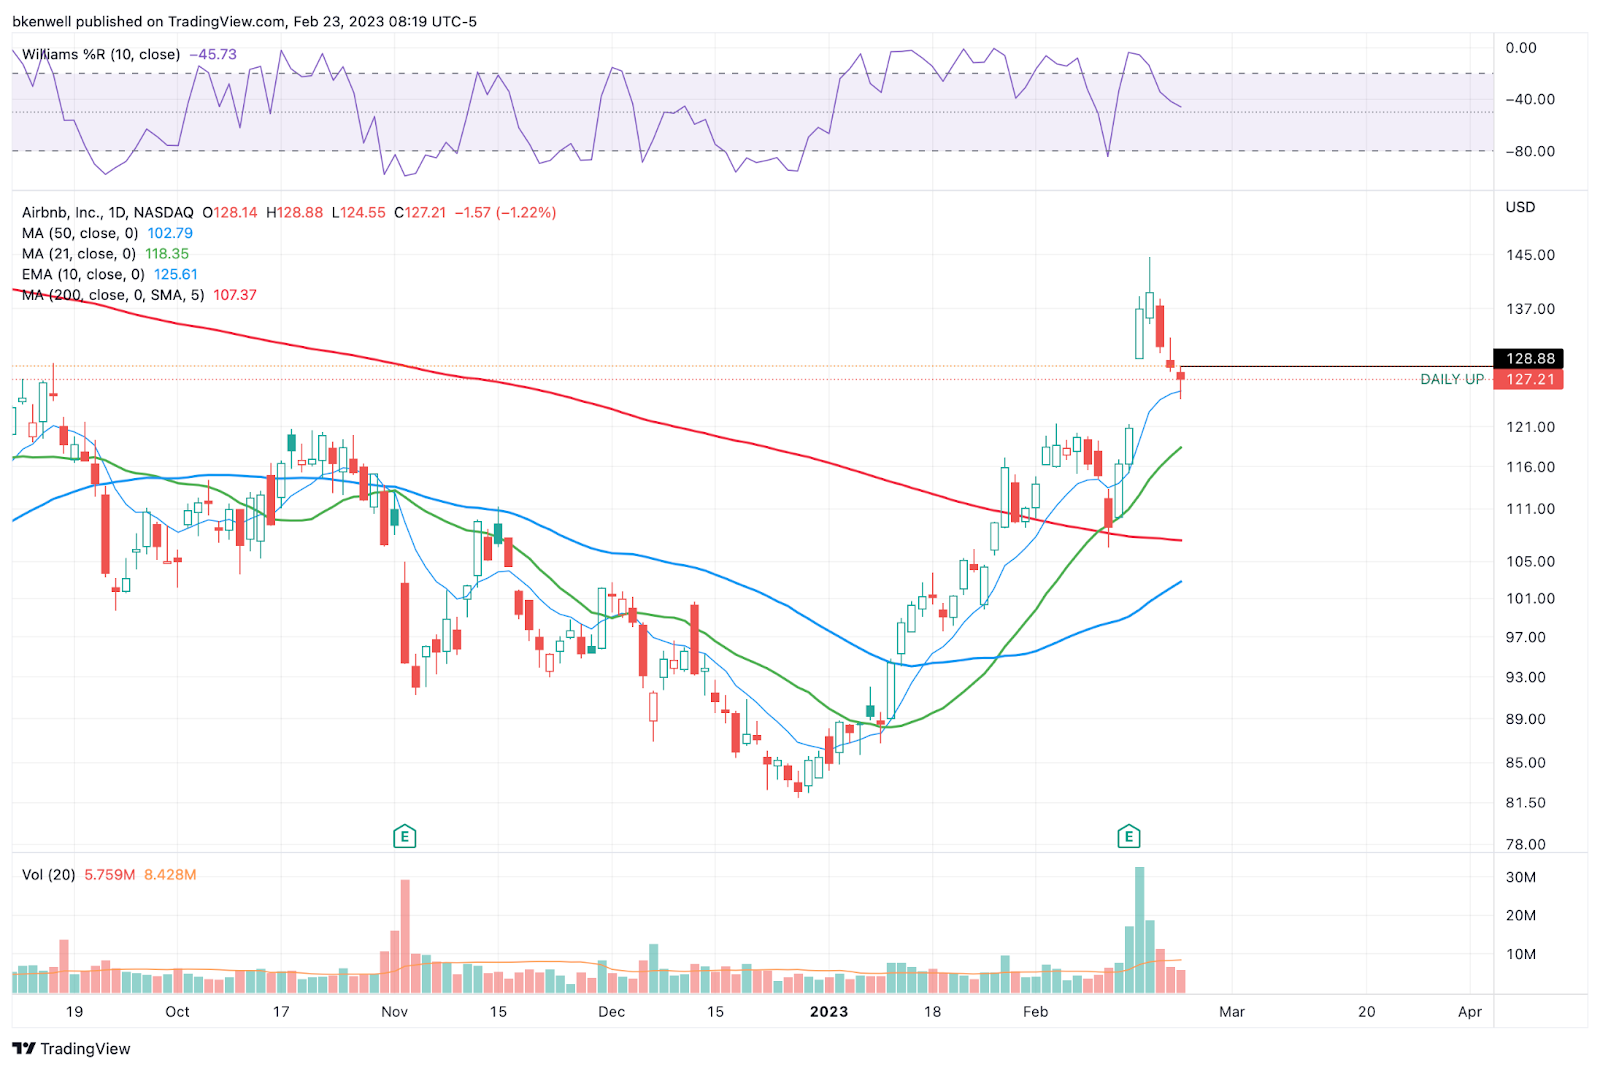
Very nice post-EPS reset in ABNB. Daily-up over $129 would have us long vs. a stop at $124. First target $134-$136.
NVDA
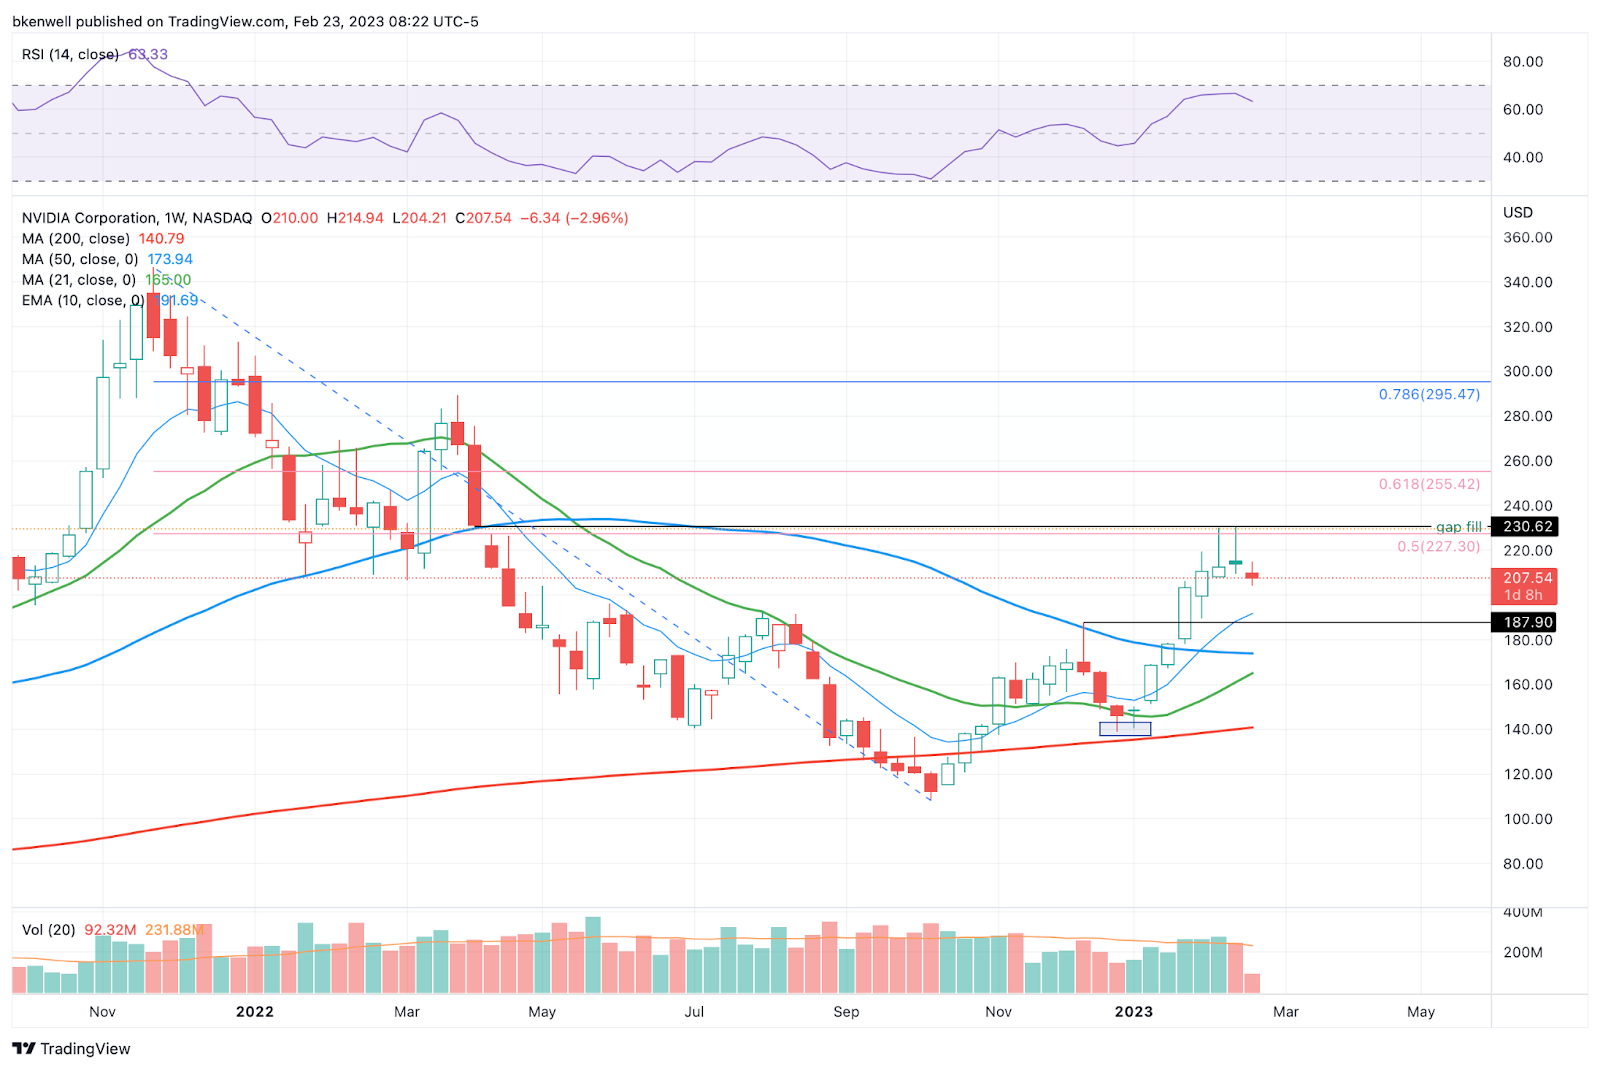
Less of a trade and more of an observation, but NVDA has to clear $230+
That’s the 2x weekly-up level and it’s also the gap-fill and 50% retracement of the range. Arguing about the fundamentals is pointless when price is the leading narrative for traders.
Over $230 is bullish. Below and there’s still a bit of caution in the setup.
Open Positions
-
Bold are the trades with recent updates.
-
Italics show means the trade is closed.
-
Any positions that get down to ¼ or less (AKA runners) are removed from the list below and left up to you to manage. My only suggestion would be B/E or better stops.)
-
** = previous trade setup we are stalking.
Some of you may already be long some of these and that’s fine too, particularly with DD and NFLX. Econ numbers may be key today.
-
**MRK — On watch for a daily-up over $110.32 and a weekly-up over $110.
-
Initial stop can be as tight at $108 or as loose as $105, (trader’s preference). Initial target for ⅓ trim is $112.50.
-
-
**DD — Can justify a long here, but I would like to see $72 to $72.50 first as a dip-buy opportunity.
-
**NFLX — $330 is the 50-day. Can justify a ½ position between $330 and $333
-
** BA — buying the $203-$204 dip if we see it today. Stop would be $199.50.
Go-To Watchlist
*Feel free to build your own trades off these relative strength leaders*
Relative strength leaders →
-
AQUA
-
AEHR
-
GE
-
NVDA, TSLA, SHOP
-
SBUX
-
MELI
-
NFLX
-
WYNN, LVS
-
AXP
-
BA & Airlines — AAL, DAL, UAL
-
TJX, ULTA, NKE
-
CAT
-
HCCI
-
XLE — XOM, CVX, COP, BP, EOG, PXD — (Weekly Charts)
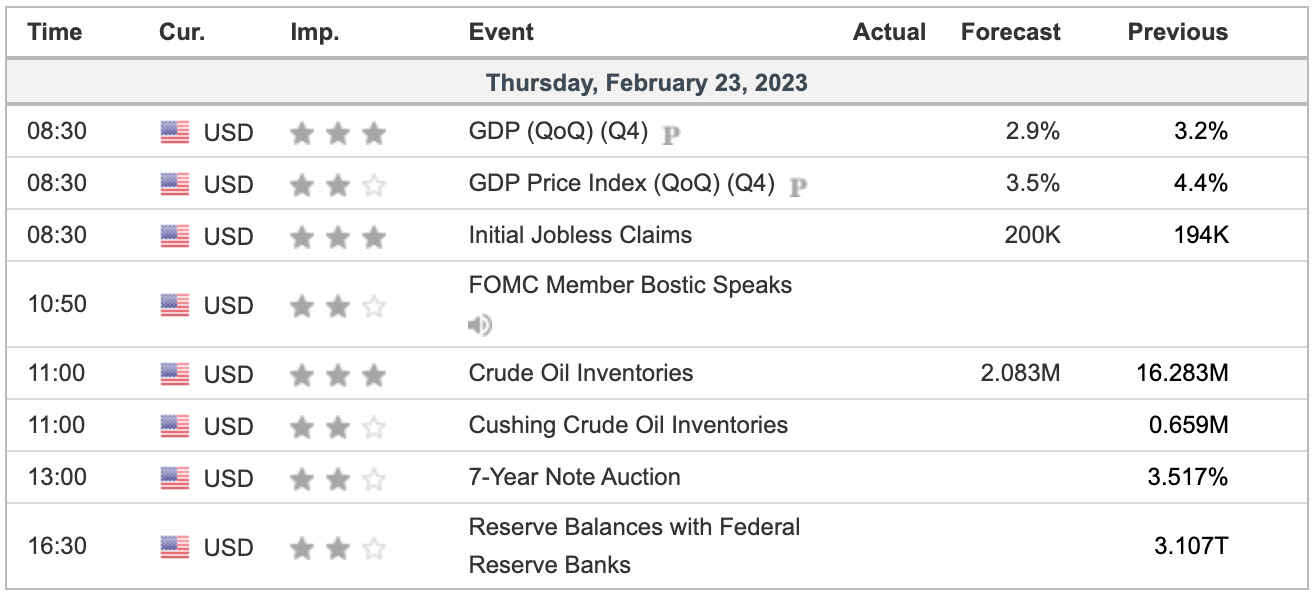
Economic Calendar
No responses yet