This post goes out as an email to our subscribers every day and is posted for free here around 2 PM ET. To get your real-time copy, sign up for the free or premium version here: Opening Print Subscribe.
$4.5 Trillion June Quadruple Witching
Follow @MrTopStep on Twitter and please share if you find our work valuable!
Our View
After an overnight rally and a pop up to 6073.75, the ES lost steam late Wednesday and settled at 6034.25, with 995K ES contracts traded. It opened Globex at 6038.25, down 39.25 points or -0.65%. The ES made a low at 5969.50 and closed at 5978 at 1 pm ET before reopening Thursday night at 5994.00. It then made a low at 5991.50, rallied up to 6029.00, and is currently (~11:00 pm) trading 6013.00, up 34.75 points.
Brent crude futures rose over 2% Thursday to top $78 a barrel, on track to settle at the highest level since January 22. Oil prices have jumped since the conflict began, and Bitcoin hovered just under $105,000. Cash stock and bond markets were closed.
I have to be honest — I said early Wednesday during the rally that the ES “acted funny,” and it did. After shrugging off the Iranian attack on Israel, the ES and NQ had a reality check and finally weakened. I think a lot of people believe the war will be short-lived. I don’t think that way.
Why? For starters, Israel is fighting on at least four fronts, and there has been sizable damage inflicted on both sides — and it’s ongoing. The fake news is saying Iran wants to talk, but both countries are going toe to toe. Trump has been saying the U.S. could jump into the war, then gave a two-week reprieve, while Russia and China are warning the U.S. to stay out.
I don’t like wars. As we’ve seen in Ukraine, small countries can stand up to bigger ones — but the question is, for how long? For years, Iran has warned the U.S. about its sleeper cells. Based on Iran’s history, it’s fair to say that if the U.S. does engage Iran, a terrorist attack, or several, could easily be executed.
Meanwhile, as the U.S. shifts focus to the Middle East, Russia is upping its game in Ukraine, and North Korea is sending another 6,000 troops to aid Russia.
When I was on the floor and had one of those days where I was fighting from the bell to the close, I never took it home with me. I always said, “Get up, it’s a new day.” But I don’t feel that way anymore. While Trump is shifting gears to the Middle East, there are only 19 days until the very disruptive 90-day tariff reprieve ends. Normally, I would ask, “How did we get here?” But we all know the answer to that.
I’ve always been the provider in my family. I met my wife when we were juniors in high school. When I was younger, things were easier to plan. I’m older now, and my family has a history of heart attacks on the men’s side. My problem is that neither my wife nor daughter are forward thinkers — and I’m not talking about careers. I’m talking about everything from the 2025 Florida hurricane season to the dollar.
I never used to think this way, but now I want to know what things are going to look like in 1 month, 3 months, 6 months, a year, 3 years, 5 years, 10 years. During the ‘87 crash, the 2000 tech bubble, and the credit crisis, I stayed steady — but I think the March 2020 COVID-19 crash irrevocably changed the course of the U.S. economy forever. I don’t have the confidence I once had.
China recently sold $50 billion in U.S. Treasuries, cutting its holdings to a 16-year low — their lowest level since March 2009. And Japan sold $22.5 billion in U.S. Treasuries.
Our Lean
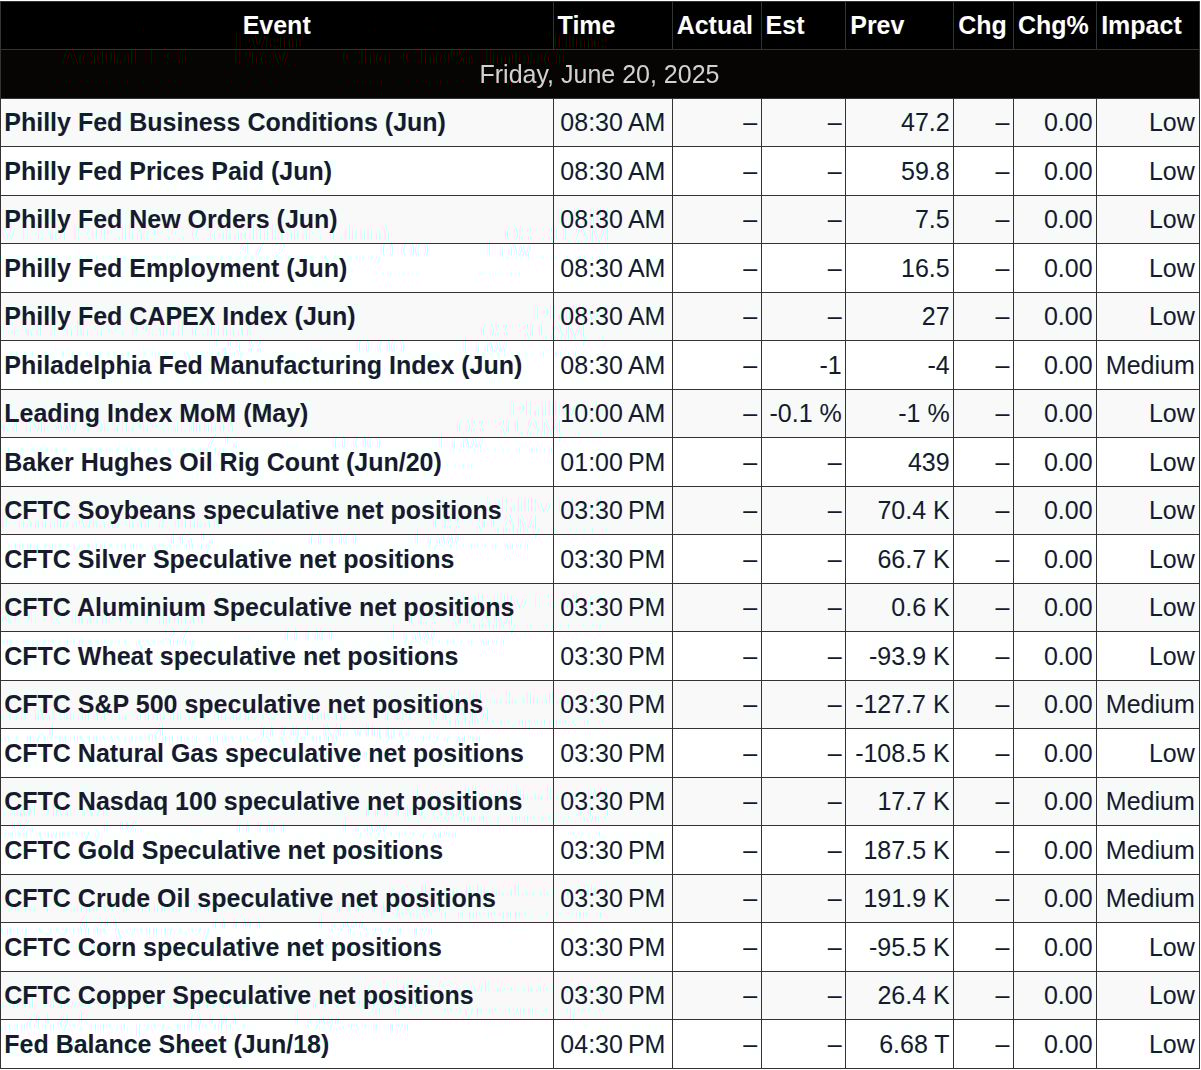
We have two economic numbers today: the Philadelphia Fed Manufacturing Survey at 8:30 a.m. and U.S. Leading Economic Indicators at 10:00 a.m., alongside the June Triple Witching — which is statistically negative.
According to the Stock Trader’s Almanac, the June Triple Witching day has been down 8 of the last 9 occasions, and the week after Triple Witching has been down 28 of the last 34 occasions, with an average loss of 0.90% since 1990.
Our lean: The ES can pop, but as long as Israel and Iran are blowing each other up, the ES and NQ will struggle into the rips. If the ES gaps down hard, I’d look to be a buyer on the first drop after the lower open, then sell a rip. If the ES gaps way up, I’m a seller, but I don’t think the ES will just fall out of bed without some rips.
Keep an eye on the bonds and the headlines. The total value of today’s June Triple Witching expiration is $4.5 trillion. We should see some big NYSE and NASDAQ volume print on the open and the 4:00 cash close.
And lastly, beware the end-of-the-day walkaway…
Guest Posts:

Get instant access to our partners’ real-time market data and insights not available anywhere else. Here is last night’s Founder’s note getting you ready for today’s market and explaining the constraints in yesterday’s market. – MrTopStep
Founder’s Note:
Futures are flat ahead of today’s OPEX, which is slated to be the largest expiration ever. Futures were about 40 handles lower overnight, which suggests the SPX was probing the ~5,925 area. We mention this as we still watch 5,900 as a major support/target zone into next week, and 6/30 expiration.
For today, 6,000 SPX is certainly the biggest OPEX strike, with ~500k total OI expiring. That is the major overhead level for today with 5,950 & 5,900 the big downside strikes.
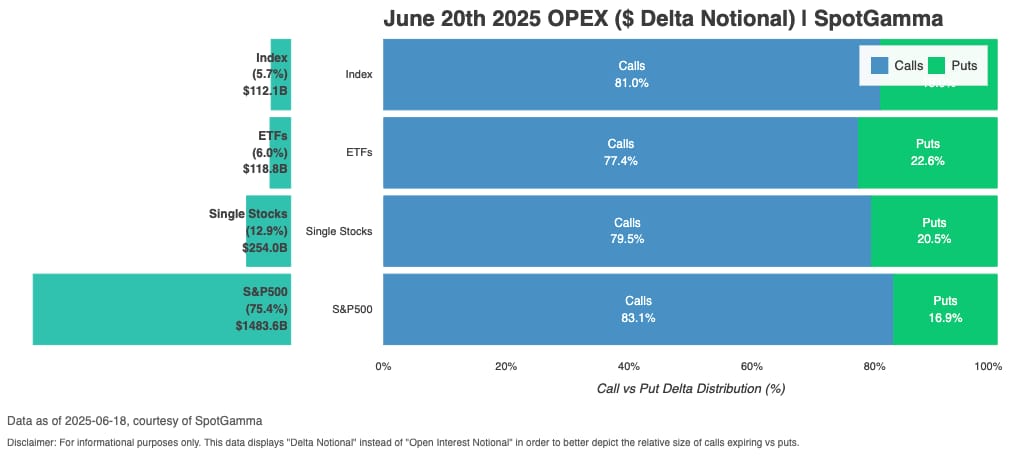
In terms of OPEX size, the delta of calls heavily outweighs that of puts which is only in part due to the stock market rally over the past month (+1%). Select single stocks have certainly rallied more that 1% in the last few weeks – but overall this has not been a massively bullish few weeks for stocks. However, when we see heavy call weightings into an expiration we generally think stocks will sell off or consolidate post-OPEX – and this situation is no different. Here, though, we see massive support at that 5,900. Post 6/30 expiration its less clear to us whats ahead. With that we last week recommended entering positions that benefit from a short term 5,900 test, and we reiterate that today.
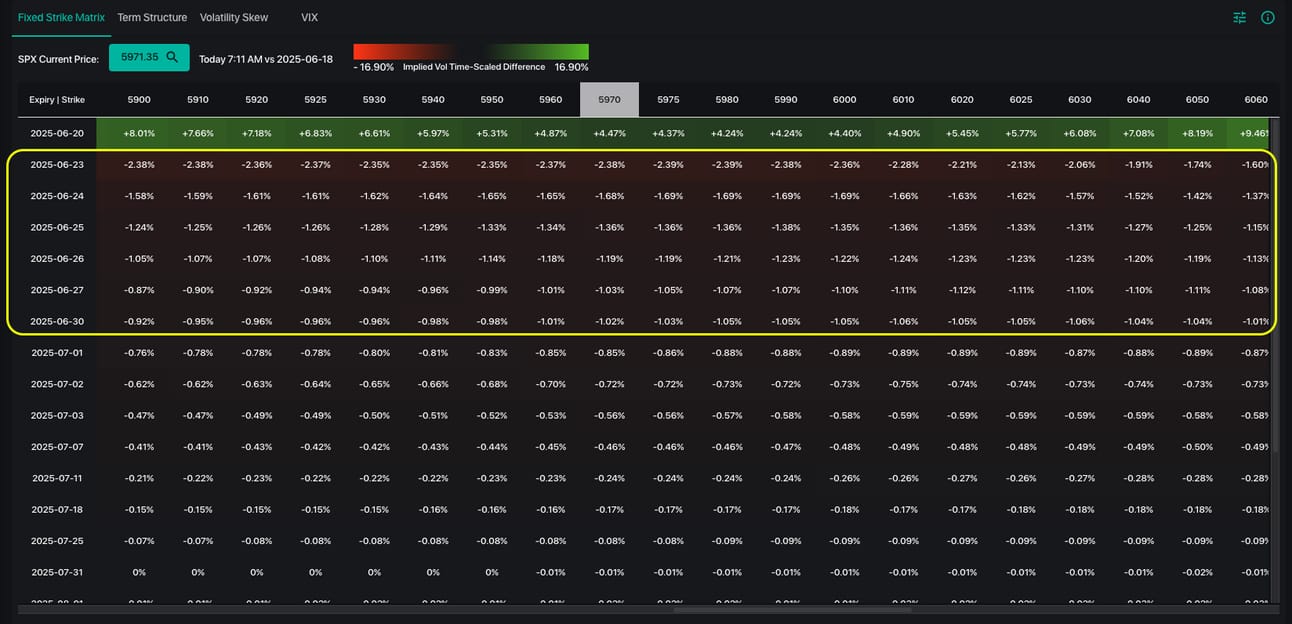
While the world is watching pizza deliveries to navigate geopolitical tensions, we will focus on vol & positioning. SPX fixed strike vols are ~1 point lower for any expiration before 6/30. Curious.
Trump supposedly gave a 2 week time frame to escalate with Iran, which seemed to have let short term-shorts back off a bit. If you look for any expiration >=July you see vols as flat.
This suggests that the vol contraction is related to the Trump tweet, but we’d suggest that it is the massive JPM call at 5,905 for 6/30 OPEX that is the vol suppressor. Dealers are long a boat load of gamma near that strike, which could be suppressive implied vols. Post 6/30 that huge position goes away, and the vol surface seems to be suggesting higher vols around that time.
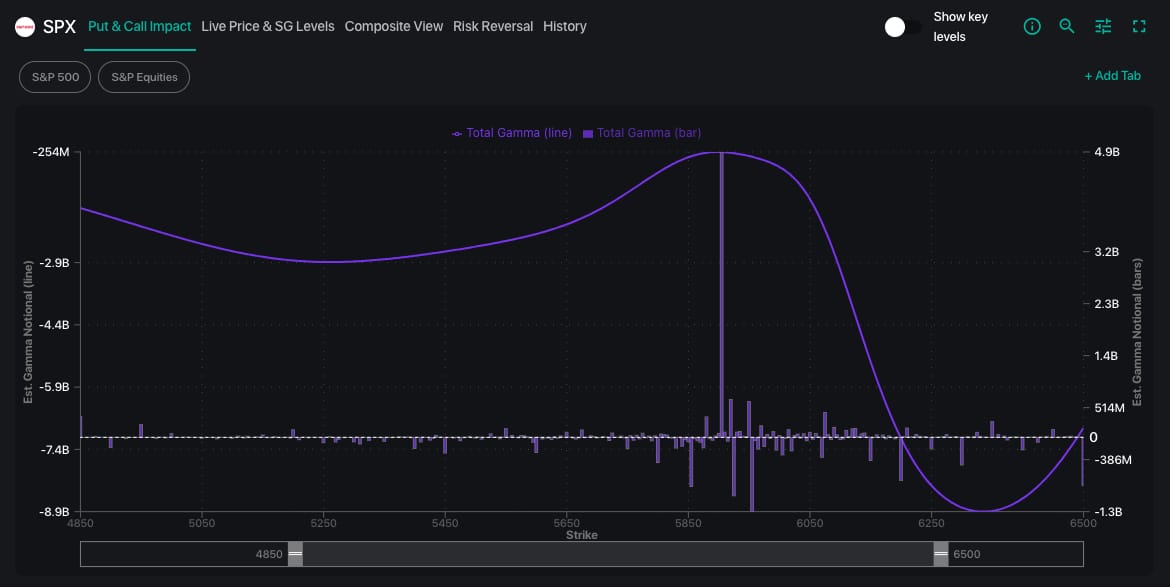
We don’t think we are overhyping the 5,905 position at this time – you can see it in the SPX GEX chart below as the massive positive bar. Below that level there are very few SPX dealer short puts, which indicates traders do not own a lot of put protection. This syncs up with the idea that this OPEX is quite call heavy – despite there not being a massive stock market rally over the past few weeks.
If we had to lay out a path here due to this positioning: 5,900 pin next week (to Monday 6/30), baring any significant Israel/Iran escalation. If that number is tagged between now and then, we would monetize put positions.
Get instant access to our partners real-time market data and insights not available anywhere else. Here is last night Founder’s note getting you ready for today’s market and explaining the constraints in yesterday’s market. – MrTopStep
MiM and Daily Recap
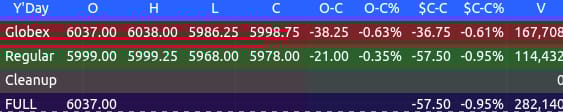
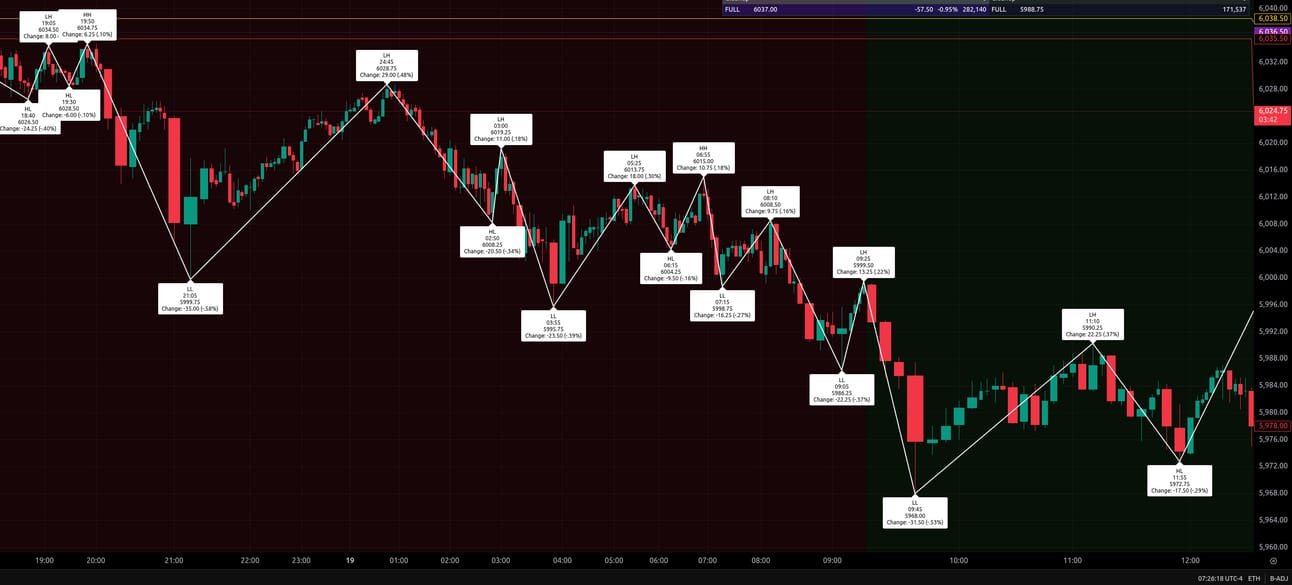
The ES futures experienced a session marked by an overall downtrend, operating exclusively as an extended Globex session that concluded at 1:00 PM ET. From the previous day’s cash close, the ES finished down 57.50 points, representing a 0.95% decline. The session’s opening price was 6037.00.
The overnight period saw early volatility. A high of 6038.75 was reached around 7:39 PM ET, followed by a decline to a low of 5981.50 at 9:03 PM ET, a pullback of 57.25 points (-0.95%). Prices then attempted a recovery, returning to 6038.75 by 2:29 AM ET before another dip took the ES to 5993.50 at 2:59 AM ET, shedding 45.25 points (-0.75%).
As the session progressed into the morning, a moderate bounce occurred, leading to a high of 6023.00 at 5:00 AM ET. However, this momentum was short-lived, with the ES finding a low of 5999.75 at 6:15 AM ET, a drop of 23.25 points (-0.39%). A minor recovery lifted prices to 6013.00 at 6:53 AM ET. The most significant move of the session came shortly after, as the ES saw a sharp decline to a low of 5961.41 at 9:43 AM ET, marking a substantial drop of 51.59 points (-0.86%) from the earlier high.
The market then attempted to stabilize, with a recovery pushing prices to 5988.00 at 11:20 AM ET. A final notable pullback occurred at 11:51 AM ET, when the ES touched 5971.75 before regaining some ground into the 1:00 PM ET close. The Globex session, which encompassed all trading activity for the day, closed at 5978.
The overall sentiment for the extended Globex session leaned bearish, with the market failing to sustain any significant rallies and showing a consistent pattern of lower lows and lower highs after early overnight activity. The session’s total volume reached 282,140 contracts.
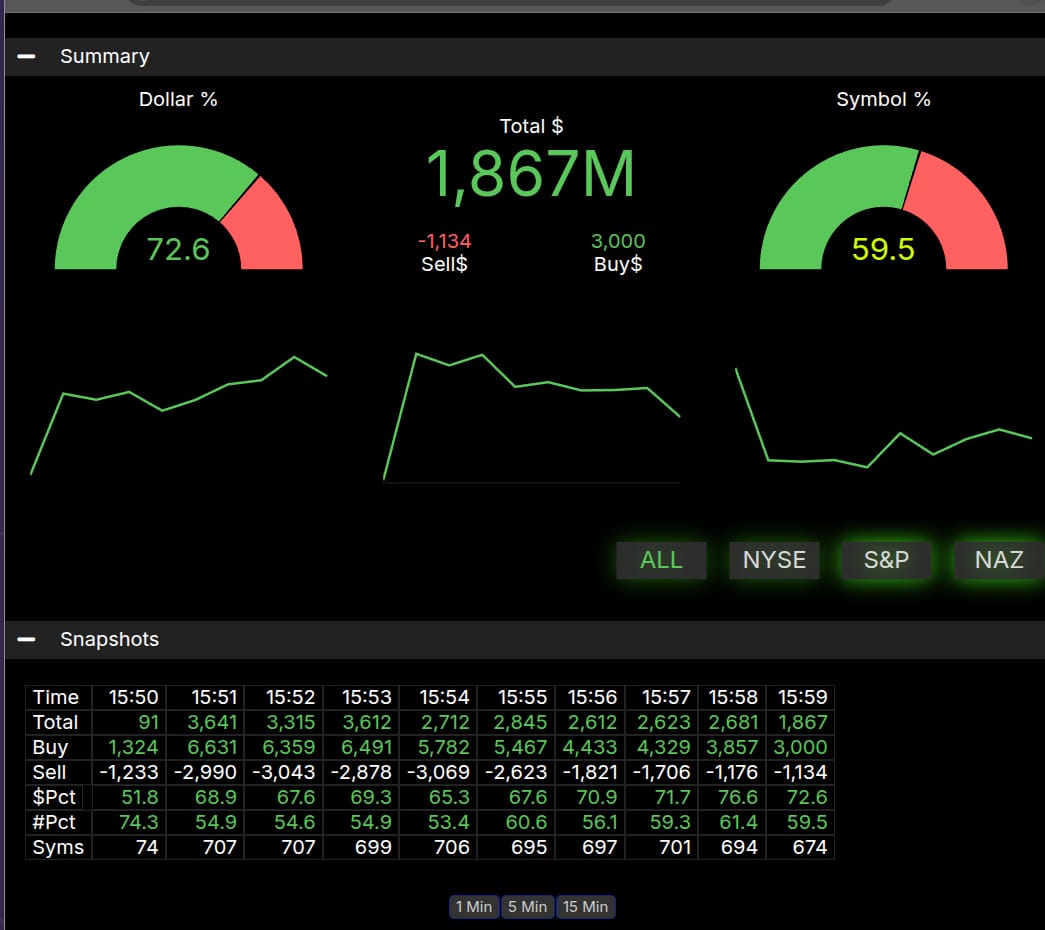
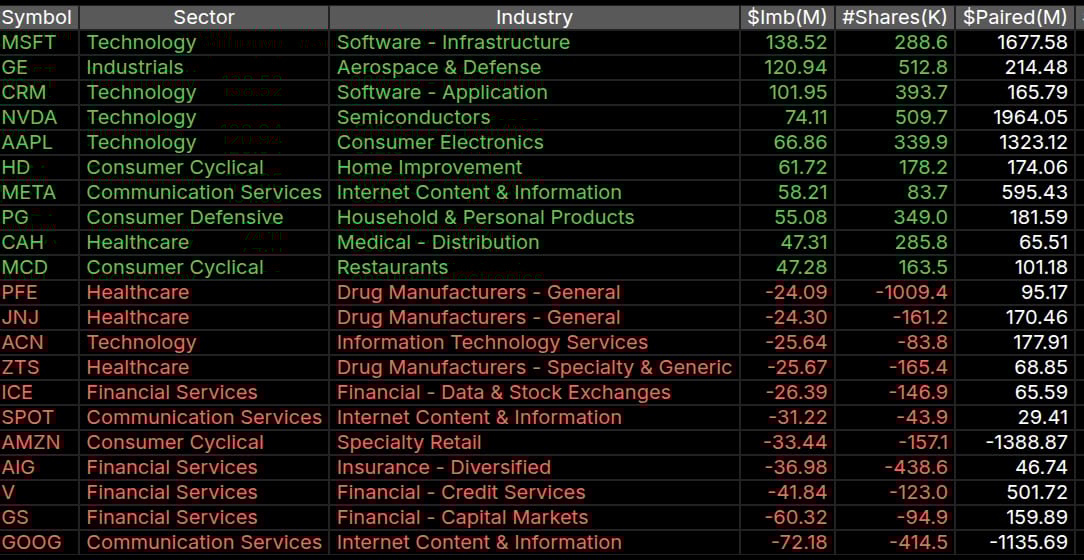
Looking back to Wednesday’s Market-on-Close (MOC) data, the total dollar imbalance registered 1,867 million dollars, with a strong dollar percentage of 72.6% on the buy side. However, the symbol percentage, which often indicates broader market conviction, ended at 59.5% on the buy side. While leaning bullish, this symbol imbalance did not cross the 66% threshold to be considered an extreme imbalance, suggesting a less dramatic impact from the prior day’s close on yesterday’s action. The session’s final outcome was a notable decrease from the previous cash close, indicating persistent selling pressure throughout the extended Globex hours.
ES
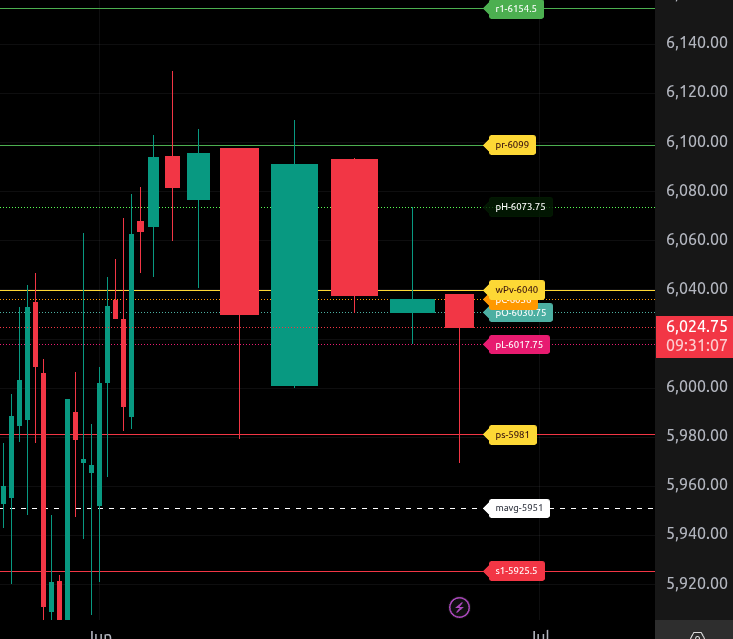
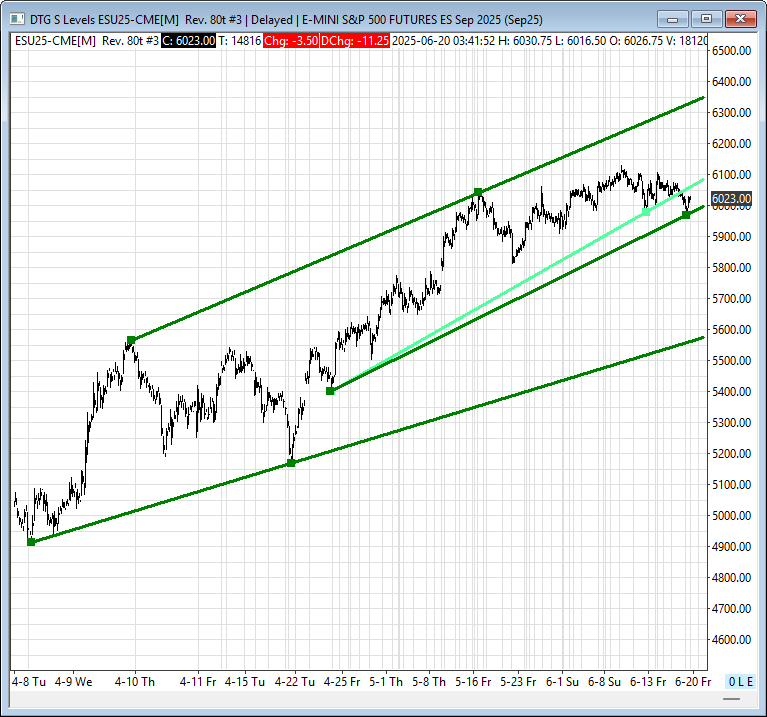
The bull/bear line for the ES is at 6040.25. This is the key level that must be reclaimed for bullish momentum to resume. Above this level, we look for potential buying opportunities on dips.
Currently, ES is trading around 6025.25, indicating weakness below the bull/bear line. If the price remains below this level, expect further downside pressure, targeting 6017.50, and then 5980.25, our lower range target for today. A break below these levels could extend the decline towards 5924.00 and eventually 5807.75.
On the upside, resistance comes in at 6073.75, and then at 6100.00, our upper range target. If ES can reclaim 6040.25 and hold above, a test of these resistance levels is likely. Bulls need sustained strength above 6100.00 to confirm a potential reversal.
Overall, the trend remains bearish below 6040.25, and caution is warranted until this level is reclaimed.
NQ
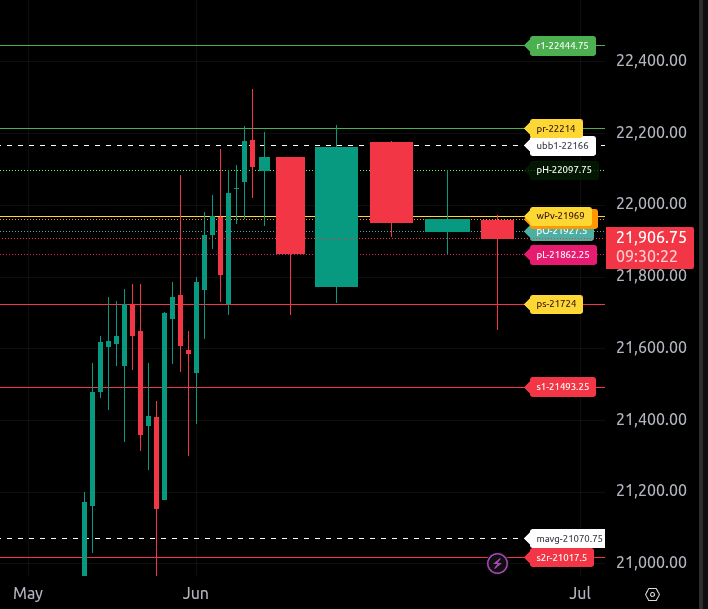
The bull/bear line for the NQ is at 21,960.00. This is the key level that must be reclaimed for bullish momentum to resume. Above this level, we look for potential buying opportunities on dips.
Currently, NQ is trading around 21,907.75, indicating weakness below the bull/bear line. If the price remains below this level, expect further downside pressure, targeting 21,862.25 and then 21,724.00, our lower range target for today. A break below these levels could extend the decline towards 21,493.25.
On the upside, resistance comes in at 22,097.75 and then at 22,214.00, our upper range target. If NQ can reclaim 21,960.00 and hold above, a test of these resistance levels is likely. Bulls need sustained strength above 22,214.00 to confirm a potential reversal.
Overall, the trend remains bearish below 21,960.00, and caution is warranted until this level is reclaimed.
Technical Edge
Fair Values for June 20, 2025
-
SP: 53.19
-
NQ: 225.36
-
Dow: 320.18
Daily Breadth Data 📊
For Wednesday, June 18, 2025
-
NYSE Breadth: 53% Upside Volume
-
Nasdaq Breadth: 64% Upside Volume
-
Total Breadth: 62% Upside Volume
-
NYSE Advance/Decline: 56% Advance
-
Nasdaq Advance/Decline: 58% Advance
-
Total Advance/Decline: 57% Advance
-
NYSE New Highs/New Lows: 54 / 37
-
Nasdaq New Highs/New Lows: 133 / 103
-
NYSE TRIN: 1.20
-
Nasdaq TRIN: 0.68
Weekly Breadth Data 📈
Week Ending Friday, June 13, 2025
-
NYSE Breadth: 49% Upside Volume
-
Nasdaq Breadth: 67% Upside Volume
-
Total Breadth: 61% Upside Volume
-
NYSE Advance/Decline: 41% Advance
-
Nasdaq Advance/Decline: 37% Advance
-
Total Advance/Decline: 38% Advance
-
NYSE New Highs/New Lows: 168 / 70
-
Nasdaq New Highs/New Lows: 385 / 195
-
NYSE TRIN: 1.76
-
Nasdaq TRIN: 1.20
Trading Room News:
Polaris Trading Group Summary – Wednesday, June 18, 2025
Wednesday’s trading in the PTG Room was a textbook example of how to navigate a structured morning and a volatile Fed-driven afternoon.
Morning Session: Textbook Execution
-
Overnight Targets Hit: The ES reached its upper target zone (6045–6050) and the NQ hit 22050 per the Daily Trade Strategy (DTS).
-
Cycle Day 3 setup brought a neutral open, and David highlighted a sandbox range of 6035–6050, preparing traders for balanced, two-way price action.
-
At 9:48 AM, David noted a shift to a long lean “gingerly”, and by 9:57 AM, he called a “Bull Stacker”, signaling a strong upward structure that was visually confirmed by a clean chart.
-
This morning’s bullish sequence played out smoothly and offered a solid setup for disciplined traders.
-
Members praised the structure as a “Textbook A.M. session,” emphasizing the importance of repetition, skill-building, and sticking to proven setups.
Afternoon Session: Snaps and Traps
-
As expected on a Fed Day, volatility kicked in pre-FOMC. David labeled 6051 as a “Volatility Trigger” and called the afternoon sell-off right on cue.
-
The Fed held rates steady, maintaining a 4.25%-4.5% range and signaling 50bps cuts by year-end.
-
Post-announcement price action turned into a “Range Runner” with sharp swings, described aptly as “Snaps n Traps.”
-
Key support zones (6023–6021) and gamma levels posted earlier provided important context for the downward move.
-
Traders faced challenging conditions, with David humorously noting trades were a bit “black & blue bruised” from the whipsaws.
Key Lessons & Takeaways:
-
Preparation matters: Knowing key levels and having scenarios mapped out made the morning session highly tradable.
-
Discipline in volatility: The Fed session underscored the importance of risk management and not forcing trades.
-
Gamma levels and daily ranges continue to serve as reliable guides.
-
Encouragement from the community, including motivational quotes and reminders on discipline, added value beyond the charts.
Looking Ahead:
-
The room is closed Thursday for Juneteenth (markets close early), with trading to resume on “FRYday.”
-
Eyes now shift toward geopolitical developments (Israel/Iran) that may impact futures action later in the week.
A solid day overall, with clear opportunities in the morning and lessons in volatility management through the afternoon Fed session.
DTG Room Preview – Friday, June 20, 2025
-
Fed Policy & Political Tension: Fed Chair Powell indicated no rate changes through summer as the Fed monitors inflationary impacts of tariffs. In response, former President Trump launched a harsh critique, demanding a 2.5% rate cut and blaming the Fed for economic setbacks.
-
Geopolitical Risk & Oil: Markets saw brief relief after the White House signaled a decision on Iran action would come in two weeks. Oil remains up ~2% this week amid concerns Iran might disrupt the Strait of Hormuz, though Iran is currently boosting oil exports.
-
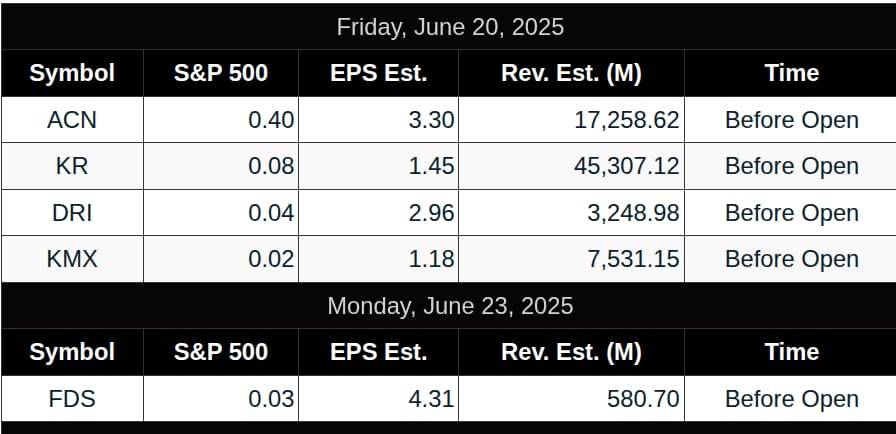
Earnings & Data: Premarket earnings reports include Accenture (CAN), Darden Restaurants (DRI), and Kroger (KR). Watch for Philly Fed Manufacturing Index at 8:30 AM ET and CB Leading Index at 10:00 AM ET.
-
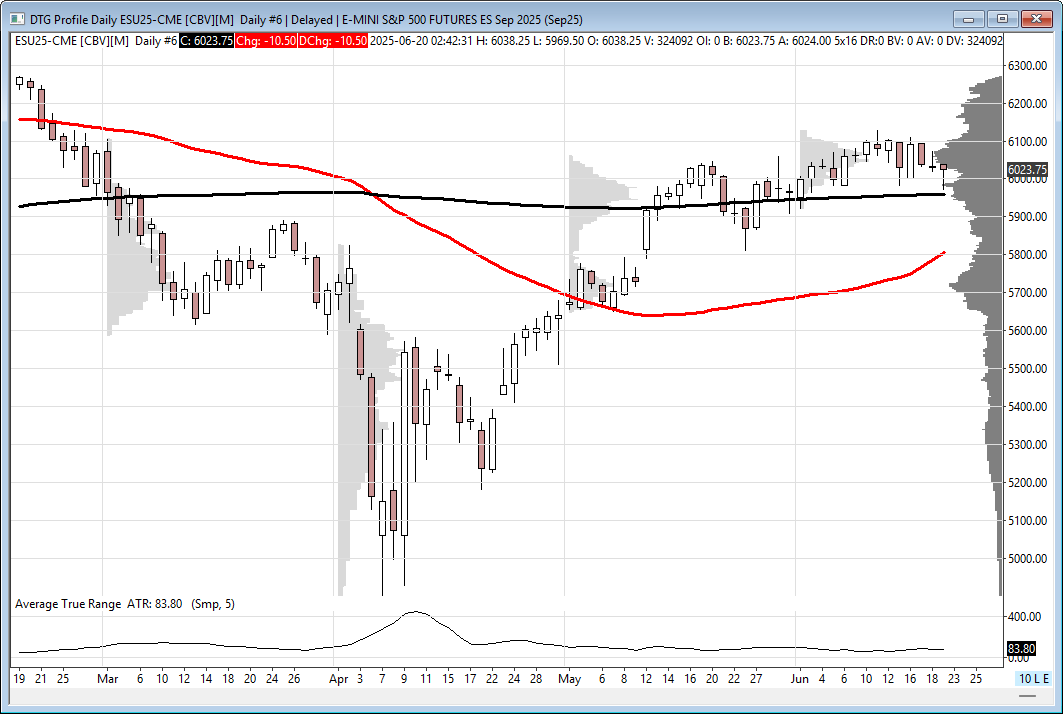
Market Technicals: ES remains volatile with a 5-day ADR of 82.75. The index broke its short-term uptrend and bounced near the 200-day at 5960.25. Resistance noted at 6068/71s and 6349/54s, with support at 5981/84s and 5578/83s. Whale volume remains light and mixed.
Calendars
Economic Calendar Today
This Week’s High Importance
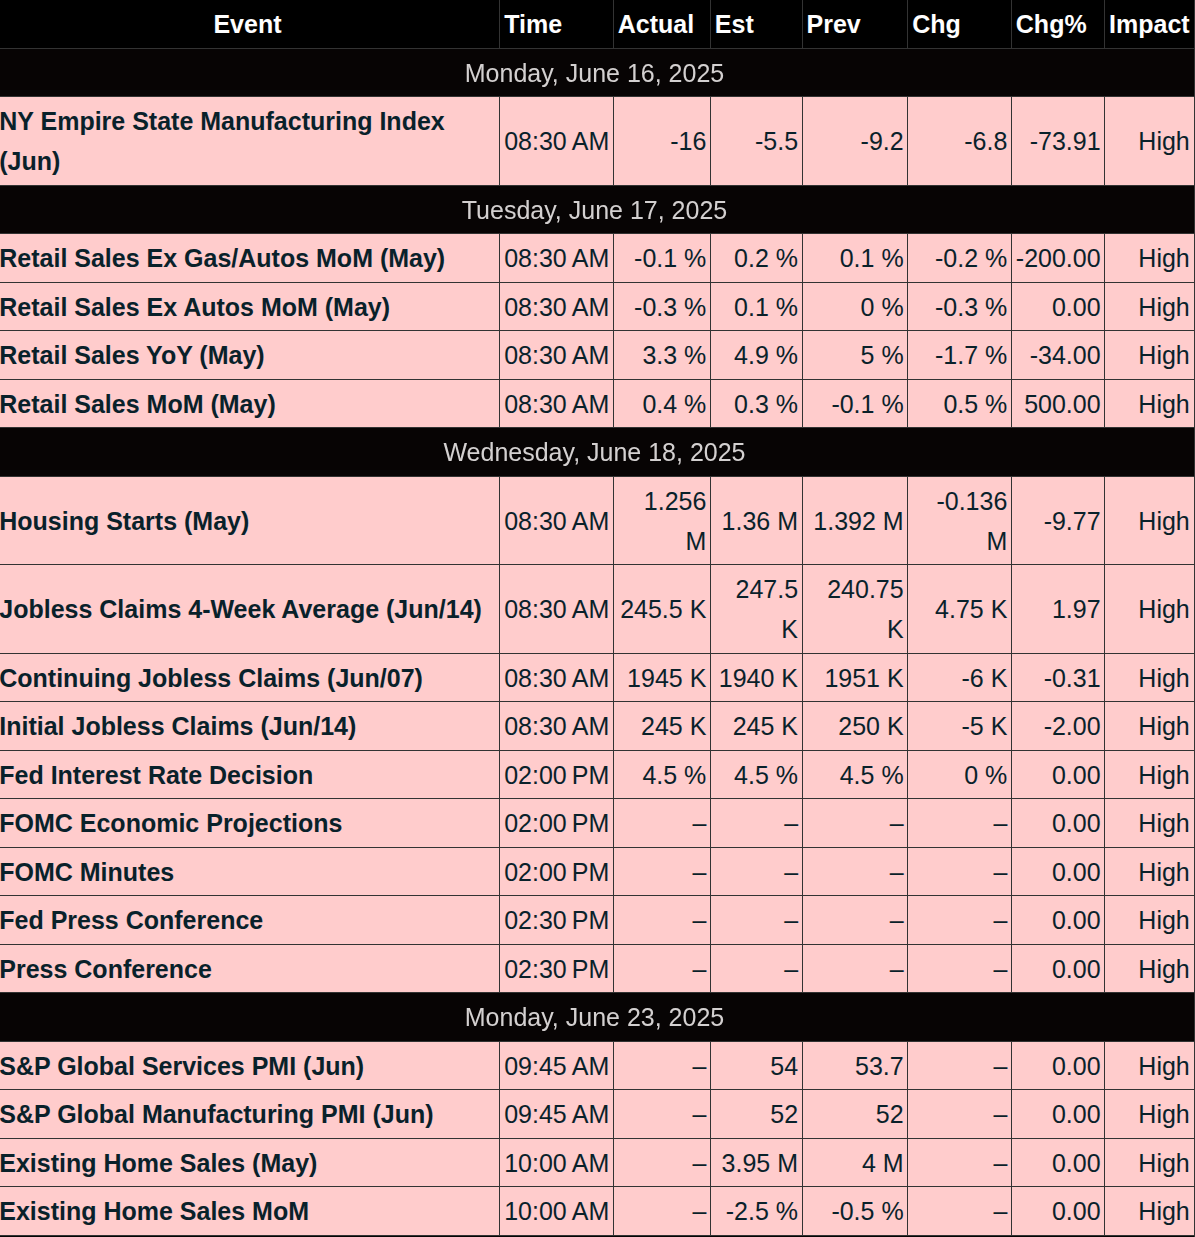
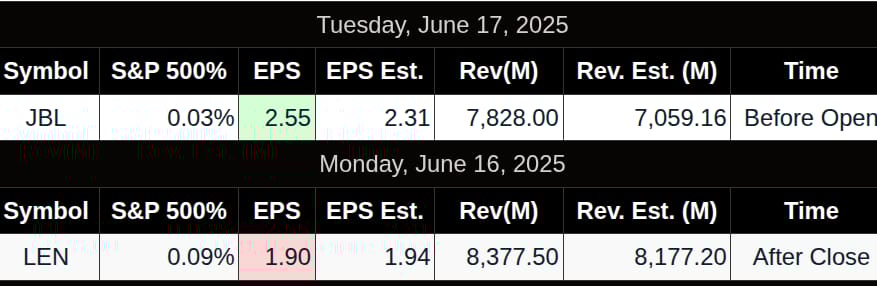
Earnings:
Affiliate Disclosure: This newsletter may contain affiliate links, which means we may earn a commission if you click through and make a purchase. This comes at no additional cost to you and helps us continue providing valuable content. We only recommend products or services we genuinely believe in. Thank you for your support!
Disclaimer: Charts and analysis are for discussion and education purposes only. I am not a financial advisor, do not give financial advice and am not recommending the buying or selling of any security.
Remember: Not all setups will trigger. Not all setups will be profitable. Not all setups should be taken. These are simply the setups that I have put together for years on my own and what I watch as part of my own “game plan” coming into each day. Good luck!!
Follow @MrTopStep on Twitter and please share if you find our work valuable!
This post goes out as an email to our subscribers every day and is posted for free here around 2 PM ET. To get your real-time copy, sign up for the free or premium version here: Opening Print Subscribe.
Comments are closed