This post goes out as an email to our subscribers every day and is posted for free here around 2 PM ET. To get your real-time copy, sign up for the free or premium version here: Opening Print Subscribe.
Tech on Edge: NVDA Earnings, Crypto Crash, and Market Uncertainty
Follow @MrTopStep on Twitter and please share if you find our work valuable!
Our View
The pain train continued Tuesday, with the NQ leading the markets lower. I posted in the MrTopStep Chat that someone hit the NQ sell button and kept their finger on it. At 10:32 AM, the NQ was down 374 points (-1.81%), and the ES was down 68 points (-1.17%) (not the session lows).
The ES sold off to a low of 5924, while the NQ made a low at 20990 before staging a decent bounce. I said early on that I was looking for 5940 and that the ES and NQ were oversold, but maybe part of that could have been in anticipation of NVDA’s earnings today.
After the rally, both the ES and NQ started going back down again. The day’s trade was down initially but ended up a two-way street with a firmer ES than the NQ.
I want to emphasize something: as a bull market guy, I find it very hard to be bearish—but the price action and news speak for themselves. The ES and NQ have now fallen for four straight days, and that’s not a good sign. We’re not even two months into the year, and the drop over the past four days has been a wake-up call for the bulls.
Consumer sentiment fell for a third consecutive month, dropping 7 points to 98.3 in February, the largest monthly decline since August 2021. Bitcoin dropped below $88,000 as part of a broader crypto selloff, following Friday’s $1.4 billion hack of Bybit, one of the world’s largest crypto exchanges. MicroStrategy, a major Bitcoin whale, fell 11% (they hold roughly $43 billion worth of BTC). Gold was up $13 early but then dropped $50. Treasury yields fell to 4.297%, marking seven declines in the past eight trading days, the lowest level since mid-December. Tesla’s market cap fell below $1 trillion for the first time since November. Nvidia shares dropped 2.8% ahead of its earnings report and Trump has said tariffs on Canada and Mexico are set to move forward next week.
As for Nvidia’s Q4 FY2025 earnings due after the close today, I found this from Cheddar Flow. As I have always said, I’m not an analyst but I think this is a good breakdown.
Everything is moving.
Our Lean
The PitBull said he is 100% in cash and reiterated that some stocks are reporting at 200 times their earnings, while many others are skyrocketing despite having zero earnings power. I look at it like this: for the past two years, it was the Magnificent 7 or the top 10 stocks making up over 34% of the market cap. I said it then, and I’ll say it again—it’s unsustainable. The top 10 stocks now make up around $18.2 trillion.
I don’t know how NVDA’s earnings are going to turn out, but I do think the ES and NQ are short-term oversold, and tech buyers may try to stage a rally. But it’s not just NVDA I’m worried about. I’m also concerned about Friday’s PCE number and an end-of-the-month walk-away.
Our lean: the gap-up has been a great selling opportunity recently, and while I can’t rule out selling into another gap-up, I think the ES has a good chance of moving higher especially if the futures gap lower. That said, I expect any rally to be short-lived, and we could very well see the ES in the 5800 handle or lower. If the ES does rally, we could see a retest of the 6020 level, with buy stops above. On the downside, I see 5950 and then back to yesterday’s lows.
There is a lot of noise out there, and it’s not going away.
MiM and Daily Recap


The ES traded higher in the overnight session, reaching a high of 6016. At 08:30, another attempt to push the premarket higher failed, with a price of 6010.75. Some jockeying in the gate put in a low at 09:27 AM of 5991.50, followed by a rise through the open (6000.50) to the day’s high of 6007.75 at 09:36. This move failed to sustain, leading to continued selling pressure shortly thereafter.
As the regular session began, the market experienced heavy selling, quickly dropping to 5933.50 at 10:30, a significant 74.25-point decline (-1.24%) from the prior high. This level acted as temporary support, with a bounce up to 5963.00 by 10:54. However, the market wasn’t done testing the downside and made another leg lower, hitting 5924.00 at 11:33, the session’s lowest point. This marked a total decline of 39.00 points (-0.65%) from the previous peak.
From there, a steady climb ensued, culminating in a high of 5990.50 at 13:06, a 66.50-point rally (1.12%). The afternoon session saw multiple swings as the market pulled back to 5964.25 at 13:30 before rising again to 5987.75 at 13:42. Another wave of selling took prices down to 5958.50 at 14:15, but a strong push into the final hour lifted the ES to 5995.50 at 15:24, its last high of the day before settling into choppy action into the close.
The ES closed the regular session at 5970.50, down 30.00 points (-0.50%) from the open, with the full session settling at 5979.75, a decline of 31.75 points (-0.53%) from the prior day’s close. Total volume across all sessions reached 2.1 million contracts.
The Market on Close (MOC) imbalance was a tale of two markets. The broader NYSE market showed a strong buy imbalance of 1.2 billion at the 3:50 PM reveal, while the Nasdaq stocks showed a 1.5 billion sell imbalance. A look at the top sellers’ list showed semiconductors being sold hard into the close, though TSLA had a notable buy.
Overall, the market exhibited volatile yet structured price action, with deep pullbacks followed by strong recoveries. The failure to hold highs and the persistent selling into the close highlighted a defensive market tone. Going forward, traders should monitor whether the 5924.00 low holds or if further downside momentum continues to build.

Filtered for NQ only stocks

Filtered for NYSE stocks

Technical Edge
MrTopStep Levels:

Fair Values for February 26, 2025:
-
SP: 14.47
-
NQ: 55.69
-
Dow: 66.09
Daily Market Recap 📊
-
NYSE Breadth: 45% Upside Volume
-
Nasdaq Breadth: 33% Upside Volume
-
Total Breadth: 37% Upside Volume
-
NYSE Advance/Decline: 58% Advance
-
Nasdaq Advance/Decline: 39% Advance
-
Total Advance/Decline: 46% Advance
-
NYSE New Highs/New Lows: 54 / 90
-
Nasdaq New Highs/New Lows: 67 / 353
-
NYSE TRIN: 1.83
-
Nasdaq TRIN: 1.27
Weekly Market 📈
-
NYSE Breadth: 46% Upside Volume
-
Nasdaq Breadth: 53% Upside Volume
-
Total Breadth: 51% Upside Volume
-
NYSE Advance/Decline: 34% Advance
-
Nasdaq Advance/Decline: 31% Advance
-
Total Advance/Decline: 32% Advance
-
NYSE New Highs/New Lows: 183 / 129
-
Nasdaq New Highs/New Lows: 396 / 312
-
NYSE TRIN: 1.18
-
Nasdaq TRIN: 0.88
Guest Posts — Polaris Trading Group
Prior Session was Cycle Day 1: Textbook Cycle Day 1 as price declined to the maximum Violation Statistical Extreme where buyers responded, absorbing the remaining sellers. Following a period of consolidation, aggressive buyers drove prices higher throughout the afternoon, touching the prior low before settling back in the upper quartile of the day’s range. Range for this session was 92 handles on 2.148M contracts exchanged.
FREE TRIAL link to PTG/Taylor Three Day Cycle
For a more detailed recap of the trading session, click on this link: Trading Room RECAP 2.25.25
…Transition from Cycle Day 1 to Cycle Day 2
Transition into Cycle Day 2: Part of this cycle’s rally is in-place, so we should be looking for some two-way consolidation to absorb the prior session’s “dip n rip.”
Given the nature of recent range-bound activity, we should not be surprised if price dips again for another test, or continue to rally to next targets.
CD2 Avg Range = 85.85 CD2 Avg Rally = 74.18
Of course, nothing changes for PTG…Simply follow your plan. Take only Triple A setups and manage the $risk. ALWAYS HAVE HARD STOP-LOSSES in-place on the exchange.
PTG’s Primary Directive (PD) is to ALWAYS STAY IN ALIGNMENT with the DOMINANT FORCE.
As such, scenarios to consider for today’s trading.
Bull Scenario: Price sustains a bid above 5980+-, initially targets 5995 – 6005 zone.
Bear Scenario: Price sustains an offer below 5980+-, initially targets 5965 – 5960 zone.
PVA High Edge = 5990 PVA Low Edge = 5945 Prior POC = 5975
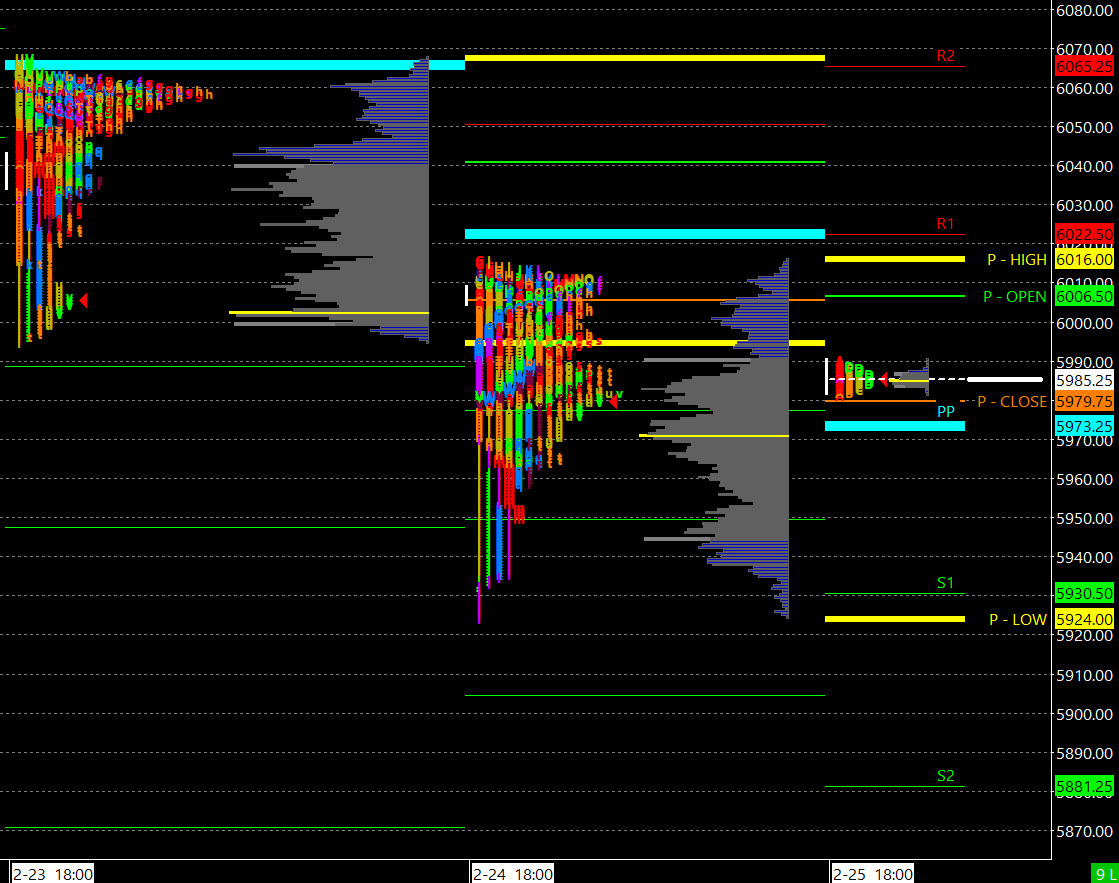
ES (Profile)
Thanks for reading, PTGDavid
Trading Room Summaries
Polaris Trading Group Summary – Tuesday, February 25, 2025
Morning Session: Bearish Momentum & Clean Short Opportunities
-
Key Level: 6010 was the “Line in the Sand” (LIS), acting as resistance overnight. A failure to reclaim this level led to an early bearish scenario.
-
Early Shorts: Price sustained below LIS, targeting 5995 – 5985 as planned in the Daily Trade Strategy (DTS).
-
@NQ Fulfillment: NQ also reached its lower target zone, showing strong follow-through on the bear case.
-
Market Traps & Stop Runs: There were signs of a “trappy” market early on, with stop-clearing action before the main move.
-
Short Positioning: PTGDavid initiated an A4 short, aligning with overall bearish structure.
-
Liquidation Move: Sellers remained dominant, and price action confirmed a downside extension with no real bullish shift.
-
Initial Balance (IB) Completed: The market showed some attempts to balance, but continued weakness suggested no significant shift in trend.
Midday Reversal – Beautiful A4 Long Setup
-
PEENAN Close & Extreme Low: Cycle Day 1 Statistical Extreme was hit at 5922.75, signaling a possible bounce opportunity.
-
Reversal Trade: PTGDavid executed an A4 long off this deep low, targeting VWAP.
-
Perfect Execution: The trade played out exactly as anticipated, running stops and achieving the VWAP target.
-
Lesson: Recognizing statistical extremes and market structure shifts provided a high-probability trade.
Afternoon Session – Slow Grind Higher & 2 PM Shakeout
-
VWAP Held as Support: Price action suggested a steady grind higher into the afternoon.
-
2 PM Shake n’ Bake: A brief shakeout move before stabilizing.
-
Market-On-Close (MOC): Ended the session flat, suggesting no strong continuation either way.
Key Takeaways & Lessons Learned
-
Precision Execution: Both short and long trades followed the trade plan with accuracy.
-
Statistical Extremes Work: The PEENAN flush & A4 long off deep lows was textbook.
-
Patience in Balance Zones: No forced trades during the midday consolidation, reinforcing discipline.
-
Recognizing Market Traps: Avoiding early long traps kept traders on the right side of the market.
A great day of disciplined trading with strong setups and solid execution!
Discovery Trading Group Room Preview – Wednesday, February 26, 2025
-
Consumer Confidence Plunges – February’s consumer confidence saw its biggest monthly drop in nearly four years, as 12-month inflation expectations surged.
-
Crypto Decline – Bitcoin dropped below $90K, hitting $86K before stabilizing around $88K, marking its lowest level since November. Ether fell nearly 6% to $2,500.
-
Tesla Under Pressure – European Tesla sales dropped 45% YoY in January, while overall EV sales rose 37.3%. TSLA fell 8%, facing stiff competition from Volkswagen, Renault, and China’s SAIC Motor. CEO Elon Musk’s political involvement in Europe may also be influencing sentiment.
-
Nvidia Continues to Slide – NVDA declined 2.8% on Tuesday, extending a 9% drop over the past five trading days.
-
Earnings Watch
-
Before Market Open: Lowe’s (LOW), Stellantis (STLA), TJX Companies (TJX), AER, BUD, and others.
-
After Market Close: Nvidia (NVDA), eBay (EBAY), Salesforce (CRM), Snowflake (SNOW), and more.
-
-
Economic Calendar
-
New Home Sales @ 10:00 AM ET
-
Crude Oil Inventories @ 10:30 AM ET
-
Fed Speakers: Richmond Fed’s Barkin @ 8:30 AM ET, Atlanta Fed’s Bostic @ 12:00 PM ET
-
-
Market Technicals & Volatility
-
The ES 5-day average daily range has increased to 76 points amid a 4-day selloff.
-
Whale trader bias leans bullish heading into the US session, though overnight large trader volume was light.
-
The ES tested its intermediate-term uptrend channel bottom, which briefly broke but ultimately held.

-
ES -Week to Week


The intraday bull/bear line for ES today is at 5970. Holding above this level could provide buyers with momentum toward 5986, with a potential push to 6016 as the upper-range target. If bullish momentum strengthens further, a move toward 6026 is our upper-range target today.
If sellers regain control below 5970, expect a test of 5950, which aligns with the lower boundary of the current structure. A breakdown below this level could open the door to 5924, followed by 5912.25 as a deeper downside target which is our range low today. Further weakness might bring the market toward 5,858 as the next major support level.
The bear/bull longer-term trend remains bullish. While the 5947 line was pierced, price did not stay there long enough. Watch that to change.
Market participants should watch price action around the 5970 level carefully, as it will dictate directional bias for the session. With recent market declines, volatility expansion could lead to sharper moves once a breakout or breakdown is confirmed.
NQ – Week to Week


The bull/bear line for NQ today is at 21,178. Holding above this level could encourage further upside, with the initial bullish target at 21,286 and an extended push towards 21,475, which is the range-high target for the day. If momentum remains strong, we could see an attempt to challenge the upper resistance at 21,568.
If NQ fails to sustain above 21,178, we may see downward pressure towards 21,149. Breaking below this could bring the market down to the lower support at 20,990, which serves as a key test for buyers. Further weakness would target the next key support at 20,881, which is our range-low target for the day.
The market remains volatile after recent selling pressure. Watch price action around the bull/bear line carefully, as a decisive move in either direction will provide clarity on today’s trend. Buyers need to reclaim and hold above 21,178 to resume upward momentum, while sustained selling below 21,114 could lead to deeper declines.
Prices from yesterday did trigger the bull/bear long-term trend, so we are in a bearish mode for the market looking forward. That is not the case for ES. Prices need to move above 22,291 now to reset back into a bull mode.
I am not as bearish as the data might suggest. We have not had a real capitulation day with a strong ‘everything is on sale’ and up/down volume of, say, 1:9. That might be coming; either way, expect a snap day and it will be a trend day either higher or lower.
Calendars
Today

Important Upcoming

Earnings


Affiliate Disclosure: This newsletter may contain affiliate links, which means we may earn a commission if you click through and make a purchase. This comes at no additional cost to you and helps us continue providing valuable content. We only recommend products or services we genuinely believe in. Thank you for your support!
Disclaimer: Charts and analysis are for discussion and education purposes only. I am not a financial advisor, do not give financial advice and am not recommending the buying or selling of any security.
Remember: Not all setups will trigger. Not all setups will be profitable. Not all setups should be taken. These are simply the setups that I have put together for years on my own and what I watch as part of my own “game plan” coming into each day. Good luck!
This post goes out as an email to our subscribers every day and is posted for free here around 2 PM ET. To get your real-time copy, sign up for the free or premium version here: Opening Print Subscribe.
Comments are closed