This post goes out as an email to our subscribers every day and is posted for free here around 2 PM ET. To get your real-time copy, sign up for the free or premium version here: Opening Print Subscribe.
Headlines Driving us Crazy: CPI Holds the Key to Market Direction
Follow @MrTopStep on Twitter and please share if you find our work valuable!
Our View
Well, forget spring break, it’s already started and it was another day in paradise for the ES and NQ. Both sold off on Globex and then rallied. After opening the regular session, the ES surged 101.75 points to 5635.75 at the 10 AM JOLTS release before chopping its way to the low of the day of 5554.50 at 1:21PM a drop top to bottom of 101.75 points. It then reversed again, rallying 109.75 points to a new high of 5643.75 at 2:54 PM, before selling off to 5572 after the MIM showed $1.2 billion to sell.
This, my friends, is what I call CNW (Crazy, Nuts & Wild). The problem is I do not see an end in sight. Maybe there are signs of a thaw in talks between the U.S. and Canada, and Ukraine has reportedly agreed to a ceasefire with Russia, but Putin hasn’t. Everything is a circle jerk, and the markets are reacting to every headline as all three indexes just notched their worst two-day drop since August.
Some say things are improving, but I don’t see it. If you get bullish into a rally, you lose. Maybe there’s potential for a relief rally, but the months ahead remain very uncertain. I don’t think this is just a pullback—I think it’s a prelude to something bigger. That said, I have to admit the ES, and especially the NQ, are very oversold.
Today is all about the CPI number. Economics. The median estimate (year-over-year, not seasonally adjusted) for the consumer price index for February 2025 is 2.9%. If the actual number comes in at 2.9%, it would mark a decrease from the previous month and would be below the trailing 12-month average of 3.0%.
I am going to keep this short and sweet: the ES is stuck in a 5540-5640 chop. How long can it remain like this? I have a feeling that today’s CPI number may change that. If the number fails to inspire, ES 5500 is dead meat, if it comes in better than expected, I think the NQ will take off.
Our Lean
Again, there are a lot of folks who think the ES is setting up for a larger bounce. In order to do that, the ES will have to get above 5650 and hold. There are tons of buy stops that extend up to 5720, but that still feels like it’s miles away. The big problem remains the competitiveness of tech companies in artificial intelligence, and that’s not something that’s going to get better overnight.
Our lean: I expect a range expansion today. The pattern has been some type of rally on Globex followed by a drop after the open. The big factor for the bulls is how oversold the NQ is, but even if it rallies 2% or 3%, that’s not going to change the overall picture much. There aren’t many times when I don’t take a stance on buy or sell, but this morning is one of them. If I had a gun to my head, I’d say we gap higher—but the big question is will it hold? How far will it go before it stalls? We shall see.
From Jeff Hirsch from @AlmanacTrader
March Madness Sets Up Ides of March Washout Bounce
Stormy March markets have battered stocks lower in the first half of
the month in recent years. Named after Mars, the Roman god of war, the
third month of the year often serves as a battleground for bulls and
bears. Julius Caesar may not have heeded the famous warning to “beware
the Ides of March,” but perhaps the bears should take heed this year,
at least for a bounce.
Several key technical levels have been breached which unfortunately
brings support around the September lows and last March’s highs in the
5300-5400 area into play. But a near-term bounce is setting up for
later this week or early next, though it will need some sort of
catalyst from President Trump, the Fed, Congress, rates, inflation or
geopolitics to trigger it.


MiM and Daily Recap


The ES ended the Globex session near the high of the full session at 5651.75 at 08:00 AM but quickly turned lower into the cash open, establishing a pattern of strong downside pressure through the morning. The market printed its first significant low of the day at 5597.50 at 09:33 AM, a 54.25-point drop (-0.96%) from the earlier high. The cash open price was 5609.00.
A quick price bounce from 09:33 AM took the ES up to 5637.75, riding the response from the JOLTs data release at 10:00 AM, a 38.25-point bounce. From there, the selling accelerated, and by 10:39 AM, the ES hit a new low of the day at 5554.50, marking an 81.25-point drop (-1.44%) from the morning peak. However, buyers stepped in, sparking a relief rally that carried prices back up to 5614.75 at 11:42 AM, a 60.25-point bounce (+1.08%).
The early afternoon session remained volatile, with a notable pullback to 5561.50 at 12:12 PM, dropping 53.75 points (-0.95%) before another reversal took hold. This next leg higher peaked at 5583.75 at 12:33 PM, a 22-point bounce before making the final drop to the day’s low of 5534.00 at 1:21 PM, down 48.75 points (-0.89%).
A strong rally from the day’s low took the ES up to 5643.75, a 109.75-point change or almost a 2% gain from the lows.
Into the final stretch, the ES reversed again, dipping to 5572.75 at 4:00 PM, a 71-point sell-off (-1.26%), before stabilizing into the close.
Market Tone and Closing Data:
The regular session closed at 5575.75, down 47.75 points (-0.85%) from the previous day’s close.
Volume was 1,984,300 contracts in the regular session, indicating high participation during the sell-offs and rallies. The full session saw 2.5 million contracts traded.
The Market on Close imbalance was bearish, with $1.01 billion in net sell imbalances (-54.3% on symbol count). The lack of symbol breadth made it lack any real market message.
Technical Edge
MrTopStep Levels:

Fair Values for March 12, 2025:
-
SP: 5.3
-
NQ: 20.55
-
Dow: 36.31
Daily Market Recap 📊
-
NYSE Breadth: 42.5% Upside Volume
-
Nasdaq Breadth: 58.5% Upside Volume
-
Total Breadth: 56.8% Upside Volume
-
NYSE Advance/Decline: 39.2% Advance
-
Nasdaq Advance/Decline: 45.9% Advance
-
Total Advance/Decline: 43.5% Advance
-
NYSE New Highs/New Lows: 16 / 158
-
Nasdaq New Highs/New Lows: 41 / 430
-
NYSE TRIN: 0.79
-
Nasdaq TRIN: 0.64
Weekly Market 📈
-
NYSE Breadth: 23.1% Upside Volume
-
Nasdaq Breadth: 50.8% Upside Volume
-
Total Breadth: 48.2% Upside Volume
-
NYSE Advance/Decline: 22.3% Advance
-
Nasdaq Advance/Decline: 37.7% Advance
-
Total Advance/Decline: 31.8% Advance
-
NYSE New Highs/New Lows: 42 / 289
-
Nasdaq New Highs/New Lows: 56 / 688
-
NYSE TRIN: 0.84
-
Nasdaq TRIN: 0.61
Guest Posts — Polaris Trading Group
Prior Session was Cycle Day 2: Normal CD2 as price tested both ends of the expected range outlined in prior DTS Briefing 3.11.25 as MATD – “Morning/Market After Trend Day” rhythms dominated the trade activity, consolidating, finding accepted balanced value. Range for this session was 133 handles on 2.471M contracts exchanged.
FREE TRIAL link to PTG/Taylor Three Day Cycle
For a more detailed recap of the trading session, click on this link: Trading Room RECAP 3.11.25
…Transition from Cycle Day 2 to Cycle Day 3
Transition into Cycle Day 3: Price closed above the CD1 Low (5571.50) and will need to trade above this level during RTH to satisfy a Positive Three-Day Cycle Statistic (89%). There also remains upside potential to fulfill the 5669.75 Cycle Target Objective.
CD3 Average Range = 76 CD3 Average Rally = 98
The Average Daily Ranges have expanded increasing the intra-day swing volatility, so adjust your trading plan’s $risk management appropriately to the current conditions. This may take the form of position size reduction and/or switching to micro-contracts. Do what is right for your individual situation and do not be concerned about what others may be doing.
Of course, nothing changes for PTG…Simply follow your plan. Take only Triple A setups and manage the $risk. ALWAYS HAVE HARD STOP-LOSSES in-place on the exchange.
PTG’s Primary Directive (PD) is to ALWAYS STAY IN ALIGNMENT with the DOMINANT FORCE.
As such, scenarios to consider for today’s trading.
Bull Scenario: Price sustains a bid above 5590+-, initially targets 5640 – 5650 zone.
Bear Scenario: Price sustains an offer below 5590+-, initially targets 5550 – 5540 zone.
PVA High Edge = 5623 PVA Low Edge = 5567 Prior POC = 5598
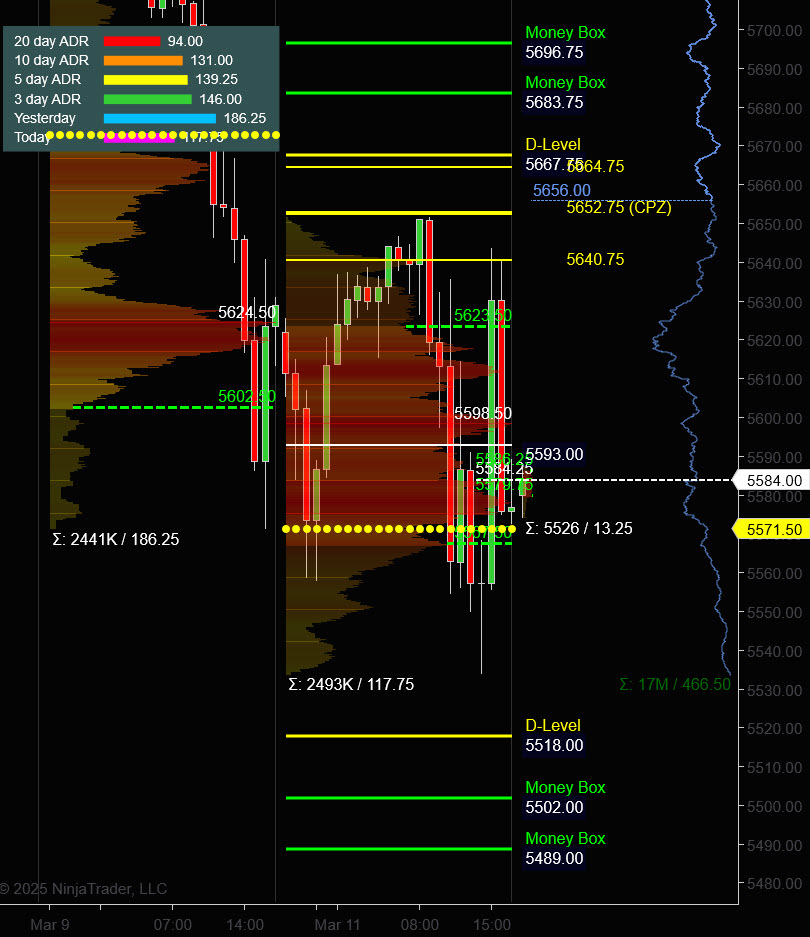
ES (Profile)
Thanks for reading, PTGDavid
Trading Room Summaries
Polaris Trading Group Summary – Tuesday, March 11, 2025
Market Overview & Key Levels:
-
The trading day started with bullish momentum as the ES reached the 5650 target early in the session, showing precise execution of the trade plan.
-
The Daily Pivot at 5652.75 acted as a rejection level, leading to a shift in market sentiment.
-
Increased intra-day swing volatility was noted, requiring traders to adjust their strategies.
-
The VIX hit 28, signaling heightened volatility.
Morning Session: Early Longs & Bearish Turn
-
The session started with a bullish scenario, targeting 5650–5665, which was quickly fulfilled.
-
However, the market turned bearish, breaking below 5625 and leading to a downside target of 5560–5545.
-
PTGDavid noted a “liquidation phase,” with sellers firmly in control.
-
Crude oil (CL) and Nasdaq (NQ) trades hit their first targets, showing early opportunities for profits.
Midday: Consolidation & No Clear Edge
-
By lunchtime, price action had stalled around the VWAP and Open Range zone, described as a “Romulan Neutral Zone” with no clear trading edge.
-
Bears remained dominant, with liquidation continuing until all weak hands were flushed out.
-
The S&P 500 was down nearly 1% across the board, continuing a broader market decline.
Afternoon: Bear Market Confirmation & Late Squeeze
-
The Nasdaq-100 (NDX) officially entered a bear market, down 21% from its all-time high in February.
-
The S&P 500 (SPX) declined 10% from its peak, indicating a confirmed correction.
-
A late-day short squeeze attempted to push prices higher, but sellers remained in control.
-
The session ended near the midpoint VWAP, reinforcing the bearish bias going forward.
-
Market on Close (MOC) imbalance was $1 billion to the sell side, confirming continued weakness.
Key Takeaways & Lessons:
-
Precision Pays Off – The 5650 target was hit early, proving the accuracy of the trade plan.
-
Adapting to Volatility – With expanded daily ranges, traders had to adjust their strategies accordingly.
-
Don’t Marry Trades – PTGDavid emphasized “Love ‘em or leave ‘em,” a reminder to stay flexible in changing conditions.
-
Volatility = Opportunity – Despite market weakness, sharp moves provided opportunities for skilled traders.
-
Cycle Day 2 Pattern Held – The expected rhythms played out perfectly, reinforcing the importance of cycle-based analysis.
Overall, a challenging but opportunity-filled trading day, with key levels respected and volatility offering both risk and reward. Traders who adapted to the shifting market dynamics had chances to capitalize on both the early long and later bearish setups.
Discovery Trading Group Room Preview – Wednesday, March 12, 2025
-
CPI Report & Inflation Outlook: The February CPI report at 8:30 AM ET is expected to show moderated inflation at 2.9% year-over-year, still above the Fed’s 2% target. Fed Chair Powell warned inflation remains persistent and the path back to target will be “bumpy.”
-
Stagflation Concerns: Analysts are raising stagflation fears, citing rising inflation, slowing growth, and trade policy shifts. The 10% increase in Chinese import tariffs in February is expected to boost CPI numbers.
-
Tariff Developments:
-
Trump’s Tariff Threats: Markets reacted to Trump’s 50% tariff threat on Canadian steel and aluminum, later softened after Ontario’s electricity surcharge decision.
-
Steel Industry Response: U.S. steel executives support tariffs, with domestic steel prices soaring from $700 to nearly $1,000 per ton.
-
Aluminum Industry Concerns: Alcoa’s CEO warns 100,000 U.S. jobs are at risk due to aluminum tariffs.
-
EU Retaliation: The EU announced $28 billion in counter-tariffs targeting U.S. steel, aluminum, textiles, home appliances, poultry, dairy, and more, while signaling openness to negotiations.
-
-
Market Movers:
-
Earnings Reports: Premarket releases from Dollar Tree (DLTR), LEN, WSM, and YPF. After-market earnings from Adobe (ADBE) and CCI.
-
Economic Data Focus: Besides CPI, key reports include Crude Oil Inventories at 10:30 AM ET and the Federal Budget Balance at 2:00 PM ET.
-
-
Market Trends:
-
Volatility: Ticked down Tuesday but remains high.
-
ES Futures:
-
Key levels include strong support at 5533/30s and resistance at 5687/82s.
-
A bullish CPI reaction could break the 5687/82s downtrend; a bearish reaction could challenge the 5533/30s support.
-
The 200-day moving average at 5852 remains out of play as resistance.


-
-
ES -Week to Week


The bull/bear line for the ES is at 5583.25. This is the critical level to watch for sentiment shifts. Below this level, selling pressure remains dominant, and further downside is likely.
Currently, ES is trading around 5612.50, slightly above the bull/bear line. If buyers can hold above this level, the next upside targets are 5622.00 and 5677.75. Reclaiming 5721.25 would indicate stronger bullish momentum, with resistance extending to 5766.75.
On the downside, a break below 5583.25 could trigger a move toward 5534.00, followed by 5489.00, our range low target for the day. A deeper decline could bring 5400.00 into play.
Overall, maintaining above 5583.25 could lead to a short-term rebound, but failure to hold this level may accelerate selling pressure. Keep an eye on price action around this zone for confirmation.
The intermediate bull/bear line currently sits at 5907, and price action above this would change our trading outlook to bullish, as opposed to our current bearish stance.
NQ – Week to Week


The bull/bear line for the NQ is at 19,404.50. This is the key level that must be reclaimed for bullish intraday momentum to resume. Above this level, we look for potential buying opportunities on dips.
Currently, NQ is trading around 19,546.75, slightly above the bull/bear line. If price sustains above 19,404.50, we can expect a potential move toward 19,846 our range high target for the day, followed by 19,962.25 as the next resistance level. A break above these could lead to a test of the 20,261 area.
If NQ falls back below 19,404.50, downside targets come into focus. The immediate support levels are 19,278.50, 19,193.25, and the lower range target at 18,963 . A break below 18,963 could accelerate selling pressure towards 18,547.50.
The overall trend remains bearish unless NQ can reclaim key resistance levels. Watch for how price reacts at the bull/bear line to determine direction for the session.
The intraday bull/bear line is at 20,807.
Calendars
Economic Calendar
Today

Important Upcoming

Earnings


Affiliate Disclosure: This newsletter may contain affiliate links, which means we may earn a commission if you click through and make a purchase. This comes at no additional cost to you and helps us continue providing valuable content. We only recommend products or services we genuinely believe in. Thank you for your support!
Disclaimer: Charts and analysis are for discussion and education purposes only. I am not a financial advisor, do not give financial advice and am not recommending the buying or selling of any security.
Remember: Not all setups will trigger. Not all setups will be profitable. Not all setups should be taken. These are simply the setups that I have put together for years on my own and what I watch as part of my own “game plan” coming into each day. Good luck!
This post goes out as an email to our subscribers every day and is posted for free here around 2 PM ET. To get your real-time copy, sign up for the free or premium version here: Opening Print Subscribe.
Comments are closed