This post goes out as an email to our subscribers every day and is posted for free here around 2 PM ET. To get your real-time copy, sign up for the free or premium version here: Opening Print Subscribe.
From 5195 to 5499: Two Sessions of ES Chaos
Follow @MrTopStep on Twitter and please share if you find our work valuable!
Our View
Did the Tariff King get caught at his own game? I think he did—but that doesn’t mean the swing up won’t swing back down again. The Trumpster was taking heat from his own staff, there were protests in the streets, and he lost a lot of friends around the world. He was even threatening the chairman of the Federal Reserve.
So, the stock market rallies. But that doesn’t mean everything has been forgiven—it hasn’t. While I’m always a bull market guy, I also don’t think the ES is going back to its highs. I had 5499.00 in the Opening Print as resistance, and the ES sold off 115 points from the high. Since Monday’s late afternoon low at 5195.50 to today’s high at 5499.75, the ES has rallied 303.25 points in just over two sessions.
Do I think we go higher? Sure. But Trump is playing nice now, and that doesn’t mean it’ll stay that way. That said, the ES was up 1.6%, had a few pullbacks and rallies, but started breaking down as the NQ tumbled lower. The ES made a high at 5499.75 (which was the top level I posted in the lean), sold off all the way down to a new low at 5385.00, rallied back up to 5441, and then sold off again to a new low at 5383.75 after 3:30.
This is what I was pounding out in the MrTopStep chart, the IMpro:
IMPRO | Dboy (3:23:53 PM): feels like a crash but the NQ is still up 400
IMPRO | Dboy (3:26:44 PM): I think we are at or near the low of this move down
IMPRO | Dboy (3:27:26 PM): everyone is short and 4485 held
IMPRO | Dboy (3:27:55 PM): it’s time for the bots to squeeze the shorts
IMPRO | Dboy (3:28:16 PM): you can’t always get what you want
IMPRO | Dboy (3:30:05 PM): a big fat rip is coming
IMPRO | Dboy (3:30:38 PM): if I’m right, 5430
IMPRO | Dboy (3:30:52 PM): buy 0DTE now
IMPRO | Dboy (3:31:07 PM): 5x your money
The ES started to pop before the 3:50 cash imbalance showed $1.3 billion, but it immediately jumped after it. The PitBull said, “We are humans fighting bots—there is no way to keep up with this!” Helping the late-day rally?
DONALD TRUMP TO EXEMPT CARMAKERS FROM SOME US TARIFFS – FT
There’s just no telling what’s going to happen next. I keep going back to that study I talked about based on historical VIX data for first-quarter volatility. It said the S&P would average a 2% move every day for the rest of the year—and so far, April hasn’t let us down.
And lastly, I know it’s hard out there. It is for me, too. It’s all fun and games when you’re making money, but losing is never fun. If you’re caught in something like that, take a step back. Regroup. The ES and the volatility will still be here when you come back.
When people talk about trading rules, rule No. 1 is having a clear head and recognizing your mistakes. I assure you—you’ll come back a better trader. Like the PitBull says, “You can’t make the money if you don’t do the work!” So instead of going out at night, stay home and study like the PitBull and I do. Make a trading game plan. Look at the big companies reporting earnings, keep an eye on the economic reports, any Fed speak, bond or note auctions, options open interest, and the headlines.
And last but not least: trade less and pick your spots better.
Our Lean
The calendar for that day focuses on economic releases such as Durable Goods Orders, Initial Jobless Claims, Pending Home Sales, the EIA Natural Gas Report, and the Kansas City Fed Manufacturing Index, $69 billion 2 Yr note auction, $25 billion 5 Yr TIPS auction, no Fed speak, and earnings from P&G, MRK, PEP, UNP, HOOG, TMUS, GLID, and INTL.
Our Lean: The ES sold off to 5355.25 overnight before bouncing to the 5391 area. I don’t expect a retest of yesterday’s 5499.75 high. The PitBull reminded us to watch for Thursday lows into Friday’s expiration. I’m open to buying early weakness, but my lean is to sell into big rips.
Debt Spotlight – $6.75 Trillion Rollover Pressure
The U.S. Treasury must roll over approximately $6.75 trillion in debt, a massive figure driven by pandemic-era deficits and prolonged government spending. In April alone, $1.3 trillion was borrowed—more than all of 2019.
-
Drivers of the debt:
COVID-19 relief, wars in Iraq and Afghanistan, and stimulus during downturns have fueled this growth. -
Scale:
National debt stands at $35.46 trillion, compared to $395 billion in 1924. -
Economic impact:
Rising debt burdens risk pushing interest rates higher and squeezing public services. -
Risk factor:
Any disruption in rolling over this debt could trigger severe financial instability globally.
MiM and Daily Recap
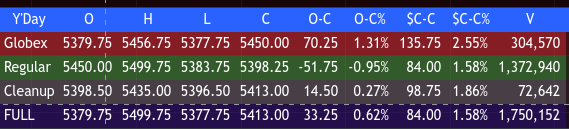
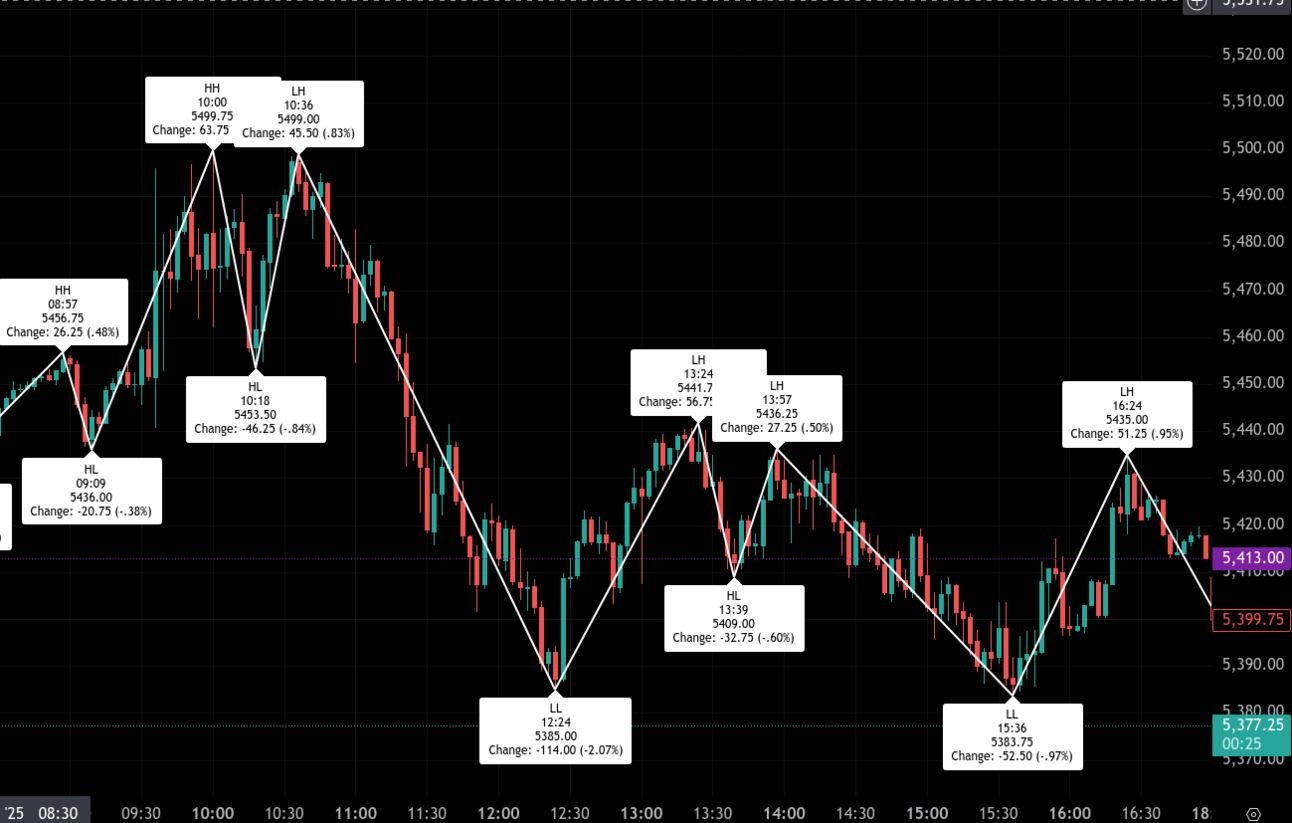
Wednesday’s ES action began with firm overnight strength, as prices rallied to a high of 5456.75 and settled the Globex session at 5450.00 — a 70.25-point gain (+1.31%) from the prior day’s close. Heading into the cash open, a premarket dip to 5436.00 at 9:09 AM marked an early higher low as buyers began setting the stage.
The regular session officially opened at 9:30 AM at 5450.00. The market initially held firm, supported by the premarket momentum, and within minutes pushed to retest the earlier Globex high of 5456.75. The rally continued with strong momentum, climbing to the session’s peak of 5499.75 by 10:00 AM — a 63.75-point gain off the premarket low. However, this sharp move was quickly met with selling pressure, leading to a retracement to 5453.50 by 10:18 AM, down 46.25 points (-0.84%) from the session high.
After the dip to 5453.50 at 10:18 AM, buyers returned with an attempt to reclaim the highs, pushing the ES back up to 5499.00 by 10:36 AM. However, this retest fell just short of the earlier session peak and marked a lower high. Sellers then struck hard, initiating a sustained decline that drove the market down to the session’s low of 5385.00 by 12:24 PM. The 114-point drop (-2.07%) from the morning high represented the most significant pullback of the day.
A midday recovery emerged, lifting ES back to 5441.75 by 1:24 PM, followed by a lower low of 5409.00 at 1:39 PM and a weaker rally to 5436.25 at 1:57 PM. The bounce attempts lost steam, leading to another drop toward 5383.75 by 3:36 PM.
A final push higher materialized late in the day, with ES climbing to 5435.00 by 4:24 PM. The regular session settled at 5398.25, down 51.75 points (-0.95%) from the open but up 84.00 points (+1.58%) from Tuesday’s 5314.25 close.
Cleanup trading added modest gains, bringing the full session closing print to 5413.00 — a net increase of 33.25 points (+0.62%) from the prior day.
Despite an early bullish continuation, Wednesday’s tone turned defensive after the post-open high. The sharp 114-point reversal off the 10:00 AM high set a bearish tone through midday, but dip buyers remained active, evidenced by multiple recovery attempts.
Total volume was strong at 1.75 million contracts, with 1.37 million traded during the regular session, confirming active participation from institutions.
The closing Market-on-Close (MOC) data showed a notable buy imbalance of $1.45 billion, with 90.5% of dollar flow and 80.3% of symbols favoring the buy side. This imbalance at 4:00 PM helped support the late lift into the 5430s, suggesting institutional demand into the close.
Overall, the session closed with mixed sentiment: early strength faded sharply, but buyers defended key support and absorbed midday weakness, keeping the broader trend resilient heading into Thursday. How to read the MiM
Technical Edge
Fair Values for April 24, 2025
-
S&P: 28.16
-
NQ: 112.54
-
Dow: 165.85
Daily Breadth Data 📊
For Wednesday, April 23, 2025
-
NYSE Breadth: 70% Upside Volume
-
Nasdaq Breadth: 81% Upside Volume
-
Total Breadth: 79% Upside Volume
-
NYSE Advance/Decline: 75% Advance
-
Nasdaq Advance/Decline: 74% Advance
-
Total Advance/Decline: 74% Advance
-
NYSE New Highs/New Lows: 22 / 11
-
Nasdaq New Highs/New Lows: 69 / 40
-
NYSE TRIN: 1.20
-
Nasdaq TRIN: 0.63
Weekly Breadth Data 📈
For the Week Ending Friday, April 18, 2025
-
NYSE Breadth: 58% Upside Volume
-
Nasdaq Breadth: 56% Upside Volume
-
Total Breadth: 57% Upside Volume
-
NYSE Advance/Decline: 69% Advance
-
Nasdaq Advance/Decline: 60% Advance
-
Total Advance/Decline: 64% Advance
-
NYSE New Highs/New Lows: 45 / 124
-
Nasdaq New Highs/New Lows: 110 / 329
-
NYSE TRIN: 1.07
-
Nasdaq TRIN: 0.96
Guest Posts:
Dan @ GTC Traders
Six Inches Off of Sea-Level
If you were at 41°43′35′′N, 49°56′54′′W on the night of April 14, 1912 and could stay just six inches above sea level, that alone would have determined whether you lived or died.
Those coordinates, of course, mark the final location of the RMS Titanic. As the ship disappeared beneath the waves over the next ten minutes, bound for the ocean floor nearly two and a half miles below, the difference between survival and death came down to one thing: elevation. Anyone caught in the water either froze to death or was dragged under. Anyone just six inches above the waves? Lived.

In this space on July 11 th , 2024, we illustrated that flat is absolutely a position. Knowing when to get flat—holding no position at all—can create a tremendous advantage over time. One that can beat market returns by many multiples.
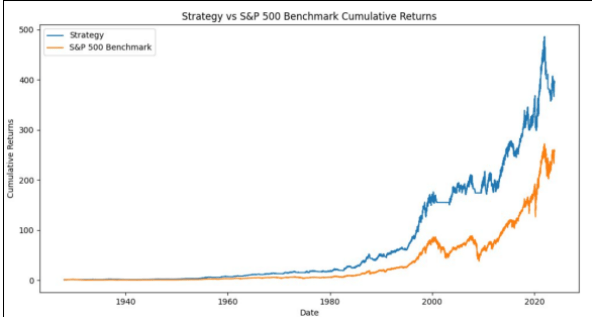
Of course, over time. We backed that up with an educational piece of research from the 1920s …
Six inches above sea level isn’t exciting. It’s not glamorous. It can even feel a bit boring. The same is true of maintaining a flat position.
But in terms of market performance? It can be the thin, quiet line between surviving… and going under.
The GTC Sample Portfolio has been enjoying this flat position for some time now—and in doing so, has avoided the worst of recent market turmoil.
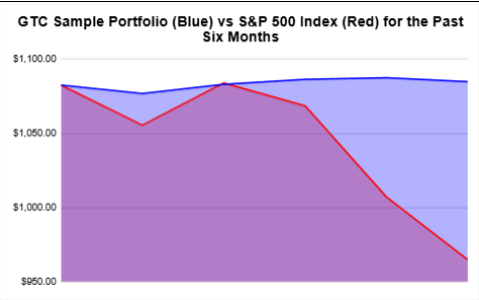
We accomplished this even while making what we’d consider several mistakes, including trades we “should have” taken. Yet despite that, we’re outperforming. In a very, very simple way.
Because the real trick isn’t just being flat—
It’s knowing when to get flat…
And how to stay flat when everyone else is thrashing in the water.
Naturally, the next question is: When will it be time to put risk back on, and how will we know?
That answer—like the sea—is always moving. But we will keep to our processes and overall mandate in order to navigate those questions.
Most of all? The patience and discipline to wait for such a time and to keep to the process? That’s where the real edge lives.
Until next time, stay safe and trade well …
Trading Room News:
Polaris Trading Group Summary: Wednesday, April 23, 2025
The PTG trading room experienced a dynamic day with strong early movement, midday volatility, and a quieter close. Here’s a detailed recap:
Morning Session: Fast Moves and Fast Trades
-
PTGDavid highlighted breaking macro news: potential tariff reductions between the US and China, Fed comments, and Tesla’s premarket strength despite earnings.
-
The NASDAQ surged over 19,000, up as much as 4%.
-
David executed what he called the fastest trade ever using the PTG Auto Trade Assistant — a 1.129-second scalp, entry to exit.
-
The ES Open Range Mid at 5453.50 attracted immediate buy interest and served as a key price reference throughout the day.
Midday: Choppy Action and a Sharp Drop
-
As the market lost momentum, price action turned whippy, prompting David to label the environment a “Chop Zone.”
-
Around 11:25 AM, a strong stop-run drove price sharply below the Open Range Mid, triggering fast downside and stopping out several traders.
-
Slatitude39 described the environment as “nosebleed territory,” noting elevated price levels and fragile structure.
Afternoon: Narrow Range and End-of-Day Watch
-
The afternoon session was quiet, with price holding the overnight gap but showing no strong directional bias.
-
David took a midday break and lightened the mood with photos of local utility work outside his house.
-
By late afternoon, he pointed out a $5.9 billion ETF rebalance expected into the close, hinting at possible buying pressure.
-
The last 30 minutes brought the usual back-and-forth, but neither bulls nor bears took control. The session ended quietly.
Highlights and Lessons
-
Positive Trade: David’s 1.129-second automated scalp demonstrated the precision and power of the PTG Auto Trade Assistant in high-speed environments.
-
Key Level: 5453.50 Open Range Mid was instrumental—first offering support, then serving as a breakdown trigger.
-
Lesson Learned: High volatility doesn’t guarantee high opportunity—when the market shifts to chop, patience and discipline are essential. Letting setups come to you was the right approach today.
A solid session overall with a standout scalp and useful insight into adapting to shifting conditions.
DTG Room Preview – Thursday, April 24, 2025
-
Top Concern: Trade Policy Turmoil Trump’s evolving trade policies continue to unsettle markets. A coalition of a dozen U.S. states filed a lawsuit challenging the legality of his tariffs, citing abuse of emergency powers under the International Emergency Economic Powers Act. Meanwhile, Trump expanded the trade war by launching a probe into foreign truck part imports, citing national security risks, and suggested Canadian auto tariffs could rise.
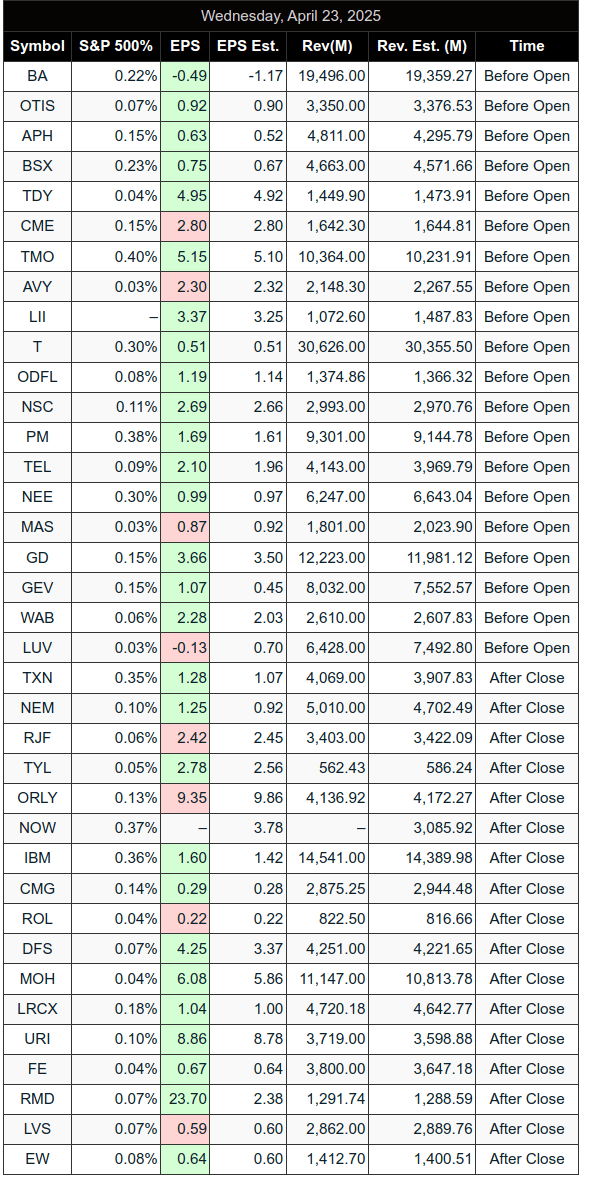
Earnings Snapshot
-
IBM: Despite a surprise revenue beat, shares dropped 6% as news broke of 15 government contracts (worth ~$100M) being shelved.
-
Chipotle (CMG): Posted its first same-store sales decline since 2020; CEO cites consumer caution amid economic uncertainty.
-
Alaska Air (ALK): Joined other airlines in pulling full-year guidance due to macro headwinds.
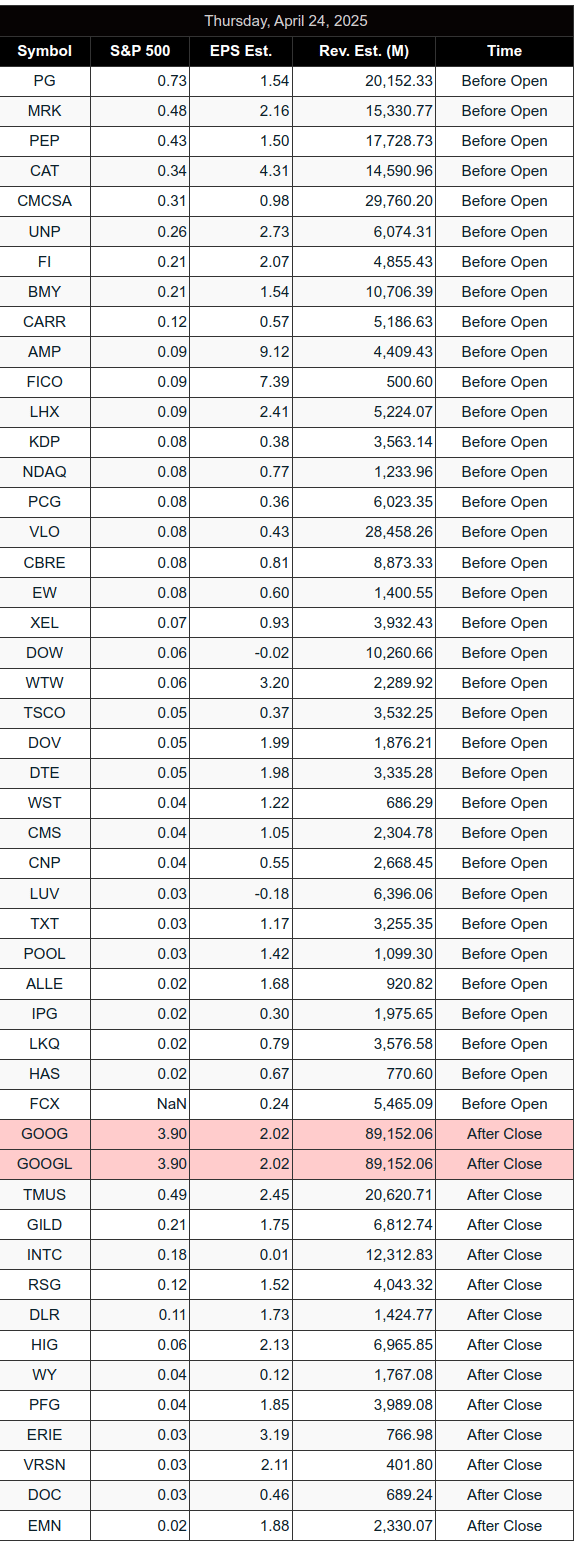
Today’s Earnings Lineup Premarket: PG, PEP, MRK, CMCSA, FCX, UNP, WST, among others.
After Close: GOOG, GOOGL, INTC, TMUS, GILD, and more.Economic Data on Deck
-
8:30am ET: Jobless Claims & Durable Goods Orders
-
10:00am ET: Existing Home Sales
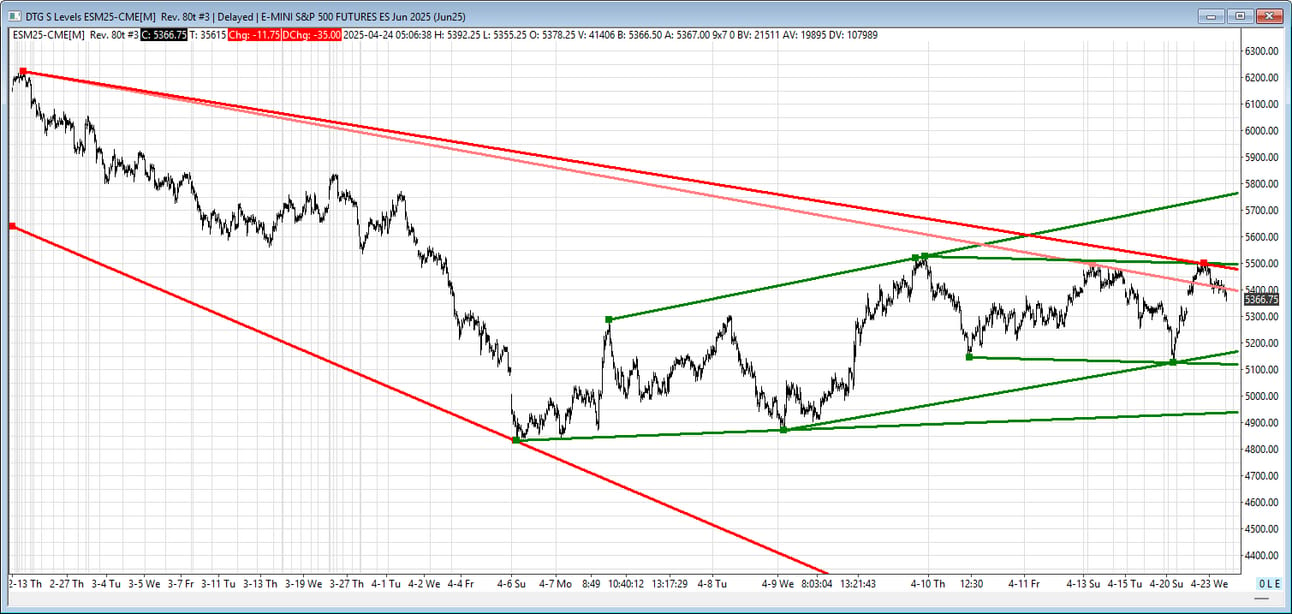
Volatility & Technicals Volatility remains elevated; ES 5-day ADR at 160.25 points. No strong whale bias noted. ES continues navigating within overlapping short-term trend channels, with key levels to watch:
-
Resistance: 5478/73, 5498/93, 5765/75
-
Support: 5162/72, 5113/23, 4933/43
Stay nimble – this market is moving fast.
-
ES
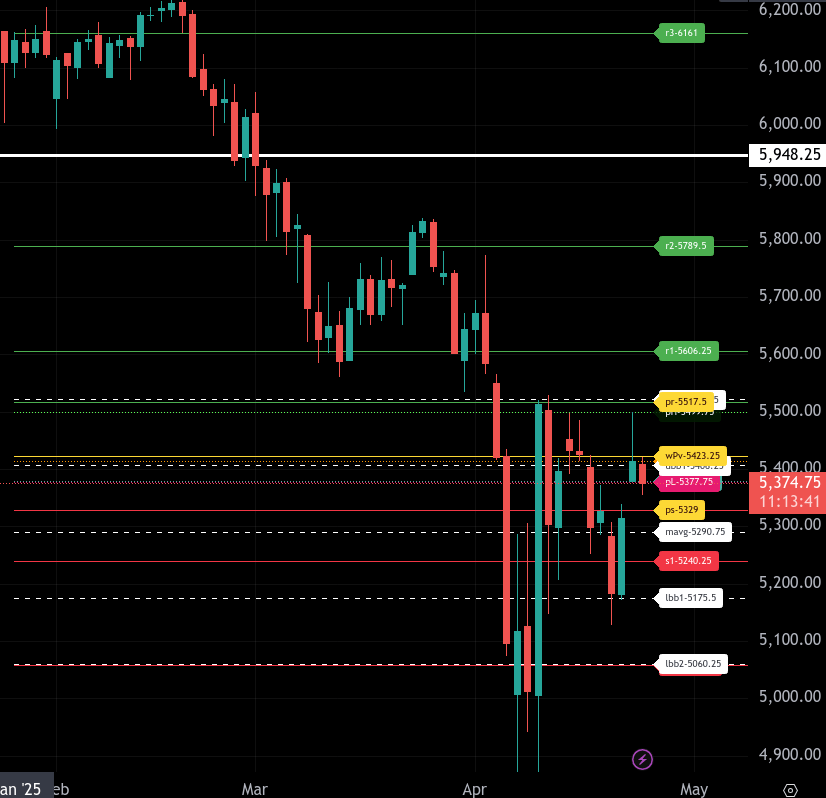
The bull/bear line for the ES is at 5315.00. This is the critical pivot for determining intraday bias. Holding below this level suggests continued bearish momentum, while reclaiming and holding above could shift the tone to bullish.
ES is currently trading around 5332.75, just above the bull/bear line, indicating a potential attempt by bulls to regain control. For sustained upside, the bulls must hold above 5315.00 and push toward resistance at 5411.00, the upper intraday range target. Higher targets are at 5425 and 5501.25.
If the market fails to hold above 5315.00, expect sellers to step in, targeting initial support at 5299.50. A break below this opens the door to test deeper support levels, first at 5251.00 and then the lower intraday range target at 5218.75. If downside pressure accelerates, the next meaningful support sits at 5128.50.
Overall, the short-term outlook hinges on whether the market can sustain above the bull/bear line at 5315.00. Caution is advised near this level, as it may act as a battleground for control of the day’s direction.
NQ
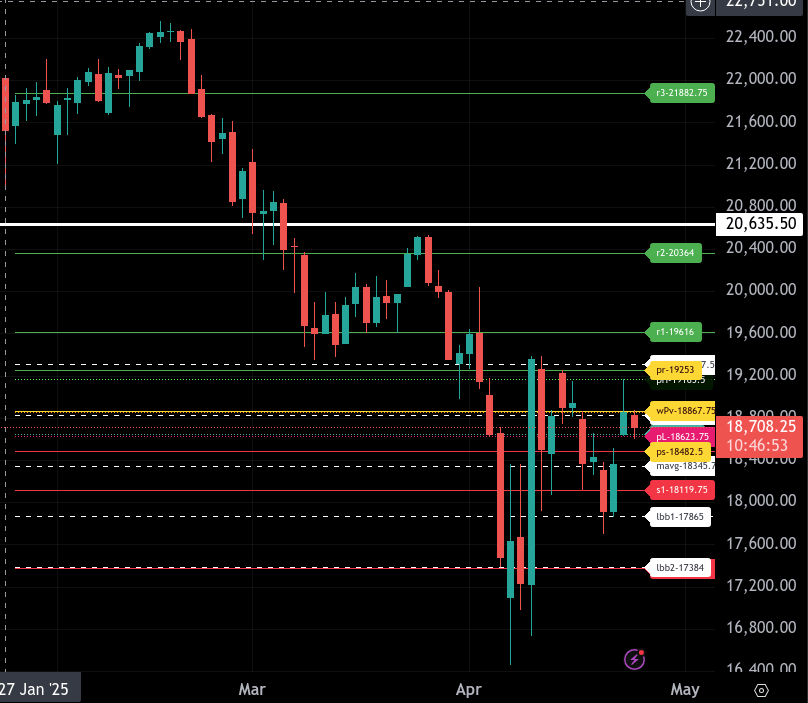
The bull/bear line for the NQ is at 18,867.70. This is the key pivot for today — price must stay above this level to maintain bullish momentum.
Currently, NQ is trading around 18,692.25, which is decisively below the bull/bear line. This signals early weakness and a bearish tone for the start of the session. If sellers maintain control below this level, we look toward downside targets.
The lower range target is 18,482.50. This is the primary level to watch if pressure continues. A clean break of that opens potential for a move into 18,345.00, then 18,119.75 as deeper support. If broader risk-off sentiment takes hold, an extended move could test 17,865.00.
On the upside, the upper range target is 19,253.00. If buyers reclaim 18,867.70 and sustain momentum, a grind higher toward 19,165.50 and then 19,253.00 is possible. Above that, the next resistance band sits at 19,307.00 and 19,616.00.
The trend bias remains bearish below 18,867.70, with key reaction expected near 18,482.50. Watch for potential intraday traps or reversals around the 18,600.00 zone if volatility picks up.
Calendars
Economic Calendar Today
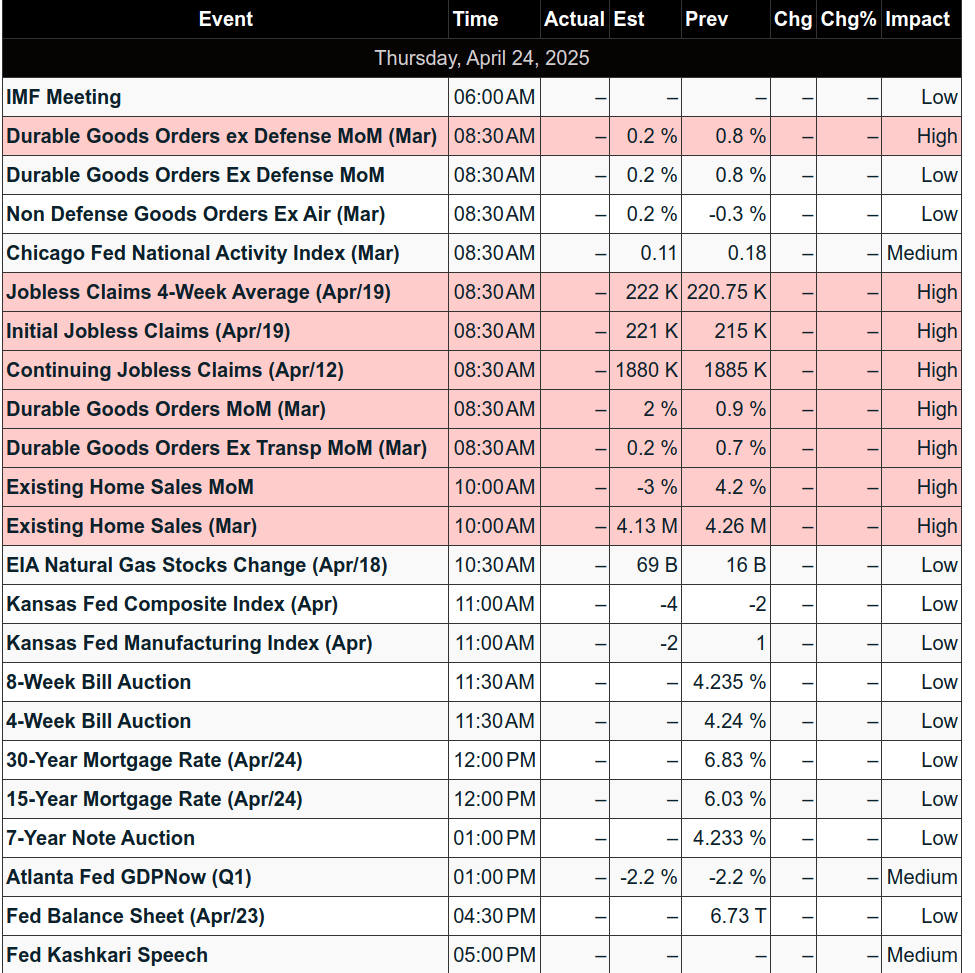
This Week’s High Importance
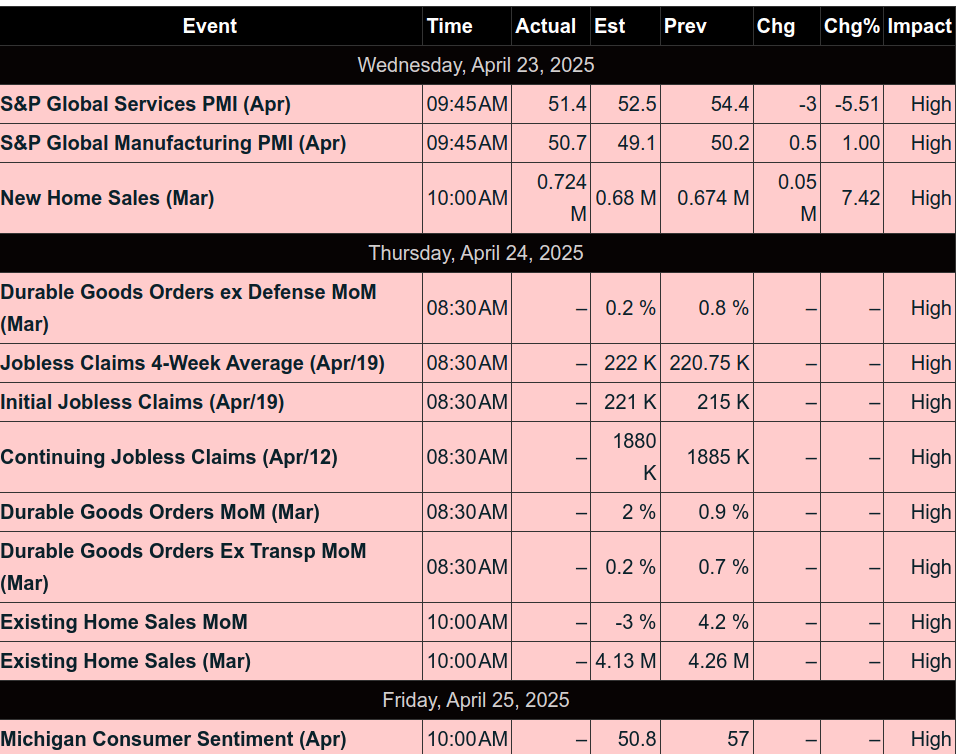
Earnings:
Released
Affiliate Disclosure: This newsletter may contain affiliate links, which means we may earn a commission if you click through and make a purchase. This comes at no additional cost to you and helps us continue providing valuable content. We only recommend products or services we genuinely believe in. Thank you for your support!
Disclaimer: Charts and analysis are for discussion and education purposes only. I am not a financial advisor, do not give financial advice and am not recommending the buying or selling of any security.
Remember: Not all setups will trigger. Not all setups will be profitable. Not all setups should be taken. These are simply the setups that I have put together for years on my own and what I watch as part of my own “game plan” coming into each day. Good luck!
This post goes out as an email to our subscribers every day and is posted for free here around 2 PM ET. To get your real-time copy, sign up for the free or premium version here: Opening Print Subscribe.
Comments are closed