This post goes out as an email to our subscribers every day and is posted for free here around 2 PM ET. To get your real-time copy, sign up for the free or premium version here: Opening Print Subscribe.
Fryday Trading Plan: Buy Early Weakness, Watch for the Rip
Legal Challenge to Tariffs
-
The New Civil Liberties Alliance filed a lawsuit in Florida federal court.
-
The suit, on behalf of Florida-based retailer Simplified, aims to block the implementation of the new tariffs and reverse changes to the U.S. tariff schedule.
Fed Rate Expectations Shift
-
Markets now anticipate 3–4 rate cuts in 2025 amid slowing growth concerns tied to the tariffs.
-
The Fed remains cautious, with Governor Lisa Cook suggesting tariff-driven inflation could support maintaining a restrictive policy longer.
Focus on Jobs Report (8:30am ET)
-
The March Jobs Report is the central economic release today.
-
While important, it’s unlikely to outweigh recession fears stemming from the tariff regime.
-
No notable corporate earnings on the calendar.
Fed Speaker Schedule Today
-
Fed Chair Jerome Powell – 11:25am ET
-
Fed Governor Michael Barr – 12:00pm ET
-
Fed Governor Christopher Waller – 12:45pm ET
Volatility and Key ES Levels
-
Volatility has surged, with the ES 5-day average range now at 176.50 points.
-
Overnight positioning shows a large trader “whale” long bias ahead of the Jobs Report.
-
ES technicals:
-
Support: 5380/75s (intermediate-term channel bottom), 5237/32s
-
Resistance: 5707/02s, 6205/00s
-
-
Thursday’s selloff respected the channel bottom, but today’s Jobs Report could trigger a breakout in either direction.
Follow @MrTopStep on Twitter and please share if you find our work valuable!
Our View
From Goldman Sachs
Will tariffs lead to a recession?
The Trump administration’s tariffs have upended decades of US trade policy, sparking a rapid reassessment of the economic outlook in the US and beyond. Goldman Sachs Research’s Top of Mind report examines what lies ahead for the US economy amid this radical shift in trade policy.
Paul Krugman, the Nobel-winning economist, explains that the size and speed of the rise in tariff rates makes this “the biggest trade shock in history.” But he’s more concerned about the uncertainty created by the trade policy shift than the scale of the shift itself when it comes to US recession risk. Even high tariffs don’t normally cause recessions, he says, but unpredictable tariffs that leave businesses hesitant to make long-term investment decisions very well might. As a result, Krugman says “a recession seems likely,” and argues that policy reversals may actually hurt rather than help, given that the reversals themselves may be reversed at a moment’s notice, which only increases uncertainty.

Jan Hatzius, Goldman Sachs Research’s chief economist, also expects a sizable tariff-induced hit to US GDP growth owing to reduced business investment, the tax-like effect of tariff increases on real income and consumer spending, and tighter financial conditions as markets price a dimmer outlook. He forecasts low US growth and a 45% chance of recession within the next year, assuming the full slate of the “Liberation Day” tariffs won’t take effect. Goldman Sachs Research would probably shift to a recession call, he says, if they do take effect. That said, Hatzius is more optimistic than Krugman that a policy reversal could stabilize near-term conditions.
Oren Cass, founder of American Compass, argues that although the Trump administration’s goal of reordering the global trade system will entail some short-term costs, “there is no reason the trade policies the administration is pursuing would need to cause a recession.” In his view, while the abruptness and lack of communication around the implementation of the shifts in tariff policy were understandably frustrating, the administration has already taken helpful steps to course correct, which should continue to resolve any uncertainty. And, Cass says, companies already have enough information about the administration’s tariff goals to work out the right strategy: Invest significantly more in US-based production.
Our Lean
It is 1:30 a.m., and the ES just traded 5553.00, which is up 425.25 points from its 5127.75 low on Monday. After I wrote this, the ES sold off down to 5486.75 and, at 8:20 a.m. Friday morning, was trading 5507.00.
Today is the Week 4 options expiration, and I am expecting a big two-way trade. The low in Globex is a big support area, and if it breaks, 5450 comes into play. Originally, I wanted to see the gap up, but the ES is more than likely going to open lower.
Our lean: I don’t doubt the ES can rally again today, but it has rallied a lot over the last few days—and it’s FRYday! My lean is to buy the early weakness and then get a look at the price action. Just about everyone I know said we were going to 5600 today, but I think that could happen next week when big tech reports, such as Meta and Microsoft, are slated to report on Wednesday, and Amazon and Apple are scheduled to report on Thursday. Alphabet’s earnings report is expected to come out on Thursday as well.
MiM and Daily Recap
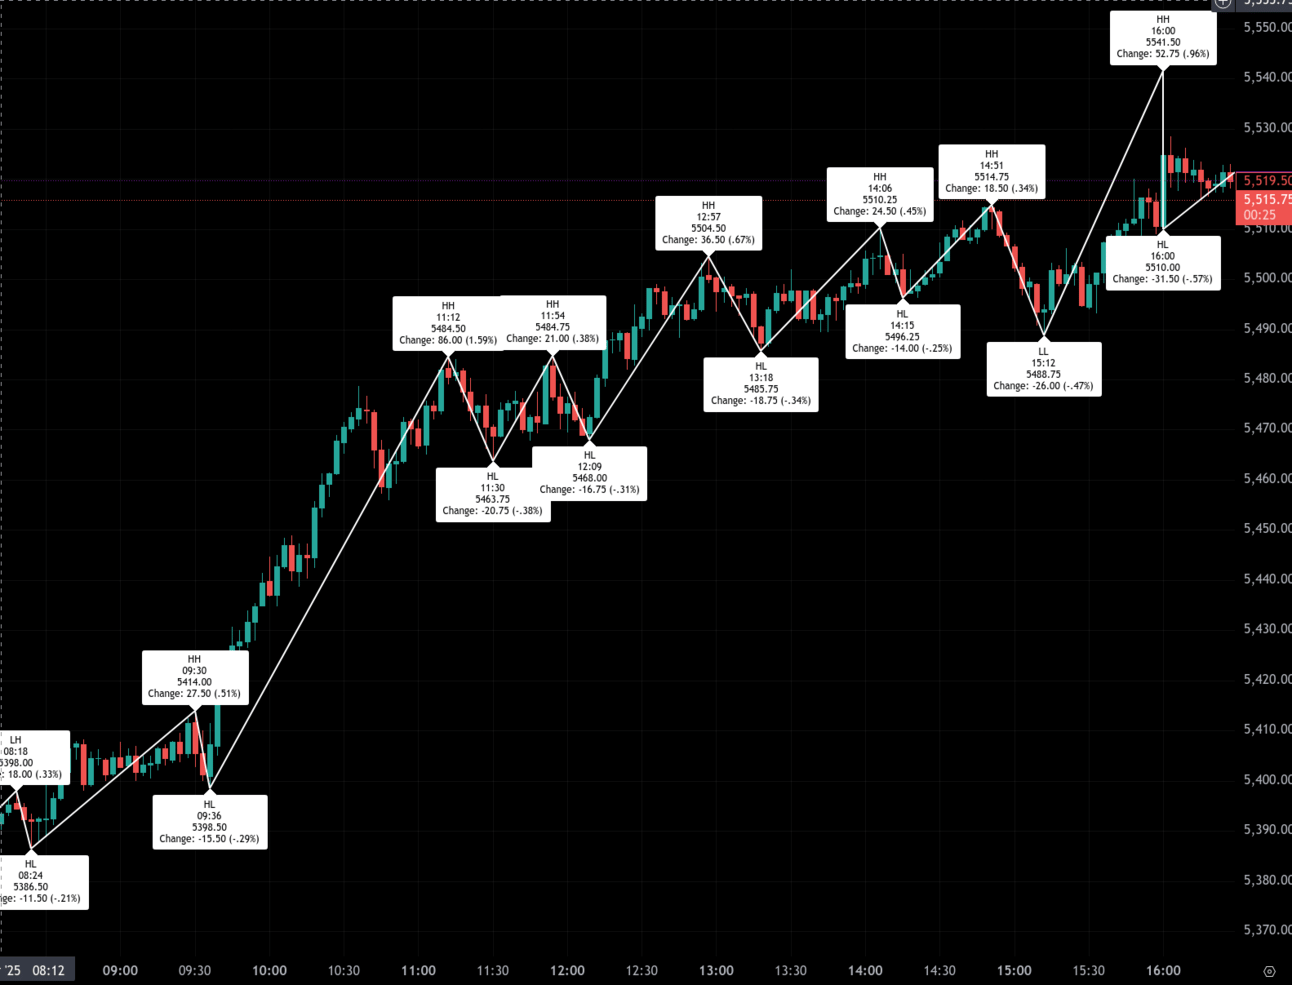
Thursday’s ES session began with upward momentum in the premarket, lifting off the Globex low of 5386.50 at 8:24 AM. A steady rise followed into the open, peaking at 5414.00 by 9:30 AM, up 27.00 handles or 0.51%. A modest pullback to 5399.50 at 9:36 AM (-13.50 / -0.25%) set a higher low, which was quickly followed by a strong rally to 5482.50 at 11:12 AM—a morning high that marked an 86.00-point surge (+1.59%) from the prior dip.
After reaching that level, sellers pushed ES down to 5463.75 by 11:30 AM (-20.75 / -0.38%), but bulls resumed control, printing another high of 5484.75 at 11:54 AM. However, this only added a modest 21.00 points before another retracement to 5468.00 at 12:09 PM (-16.75 / -0.31%).
The afternoon saw rotation but maintained an upward trajectory. A push to 5504.75 at 12:57 PM (+36.75) was met by a steeper pullback to 5485.75 at 1:18 PM (-18.75 / -0.34%). After consolidating through early afternoon, ES retested the highs at 5510.25 by 2:06 PM, then faded to 5496.25 at 2:15 PM (-14.00 / -0.25%).
From there, a brief lift to 5514.75 at 3:14 PM was followed by a sharper drop to a new low at 5488.75 at 3:32 PM (-26.00 / -0.47%). Yet bulls stepped back in during the final hour, driving ES up to the session high of 5541.00 at 4:00 PM on the closing candle — marking a 52.25-point rally from the prior swing low (+0.96%).
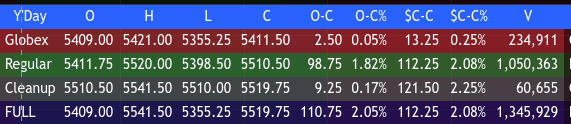
The market settled during the cleanup session, closing at 5519.75. The final regular session close came in at 5510.50, representing a gain of 112.25 points or 2.08% from the previous day’s 5398.25 close.
Thursday’s tone was bullish throughout, with the index trending higher on strong dips being bought steadily across the day. Volume was robust, with over 1.05 million contracts exchanged during the regular session and 1.345 million for the full day.
The day’s performance was driven largely during the regular session, which outpaced the modest 13.25-point gain in Globex. Cash-to-cash change totaled +112.25 points (+2.08%), while the open-to-close move added 98.75 points (+1.82%), reflecting strong participation from the open bell.
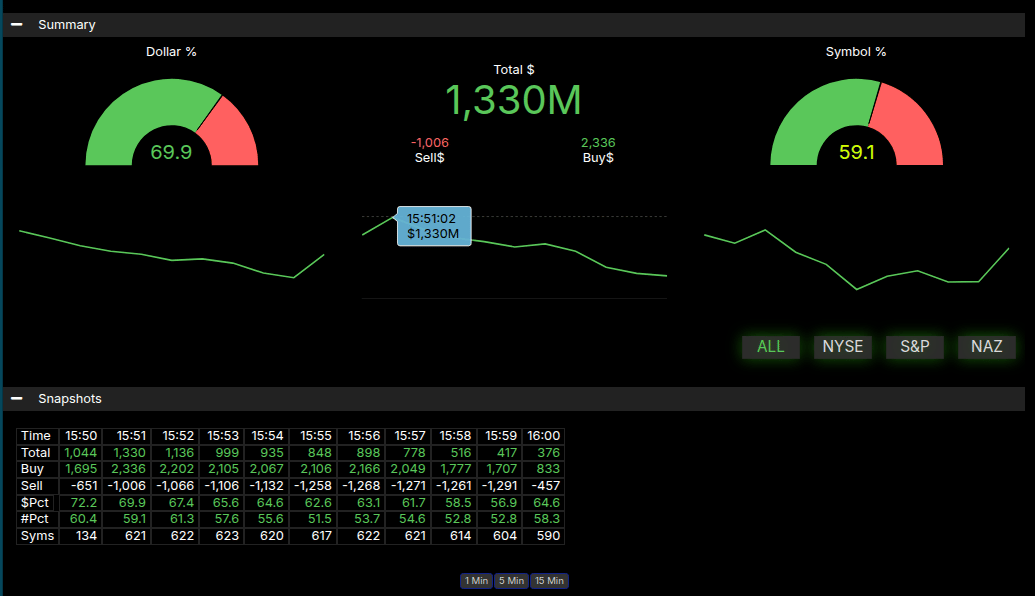
The Market-on-Close (MOC) imbalance showed a meaningful tilt toward buyers. With $2.336B to buy and $1.006B to sell, the net buy imbalance of $1.33B pushed the dollar percentage to 69.9%—just above the ±66% threshold. However, the symbol imbalance ended at 59.1%, just under the trigger line, limiting the urgency of late-day flows. Still, the strength into the 4:00 PM peak suggests buyers had the upper hand heading into the final auction.
Overall, Thursday marked a continuation of bullish momentum with multiple higher highs and higher lows throughout the session. Closing strength and above-average volume suggest positive carryover potential into Friday’s trade.
Technical Edge
Fair Values for April 25, 2025
-
SP: 27.82
-
NQ: 112.72
-
Dow: 160.7
Daily Breadth Data 📊
For Thursday, April 24, 2025
-
NYSE Breadth: 81% Upside Volume
-
Nasdaq Breadth: 74% Upside Volume
-
Total Breadth: 75% Upside Volume
-
NYSE Advance/Decline: 84% Advance
-
Nasdaq Advance/Decline: 77% Advance
-
Total Advance/Decline: 80% Advance
-
NYSE New Highs/New Lows: 21 / 15
-
Nasdaq New Highs/New Lows: 74 / 59
-
NYSE TRIN: 1.19
-
Nasdaq TRIN: 1.19
Weekly Breadth Data 📈
Week Ending Friday, April 18, 2025
-
NYSE Breadth: 58% Upside Volume
-
Nasdaq Breadth: 56% Upside Volume
-
Total Breadth: 57% Upside Volume
-
NYSE Advance/Decline: 69% Advance
-
Nasdaq Advance/Decline: 60% Advance
-
Total Advance/Decline: 63% Advance
-
NYSE New Highs/New Lows: 45 / 124
-
Nasdaq New Highs/New Lows: 110 / 329
-
NYSE TRIN: 0.92
-
Nasdaq TRIN: 0.95
Guest Posts:
Get instant access to our partners’ real-time market data and insights not available anywhere else. Here is last night’s Founder’s note getting you ready for today’s market and explaining the constraints in yesterday’s market. – MrTopStep
Founder’s Note:
Futures are -10bps after yesterday’s strong rally.
GOOGL +5% after earnings to 167
All the chatter yesterday was “Is the selling really over???”
Its not hard to understand why nearly all investors are bearish given the US political stance of imposing tariffs and informing us that the US economy may hit a “speed bump”. Put all that macro aside for a moment…
From an options perspective, for the US equity rally to lose steam we need to see options-induced resistance (gamma) and/or signs that options prices are shifting towards a bearish tone (vol/skew).
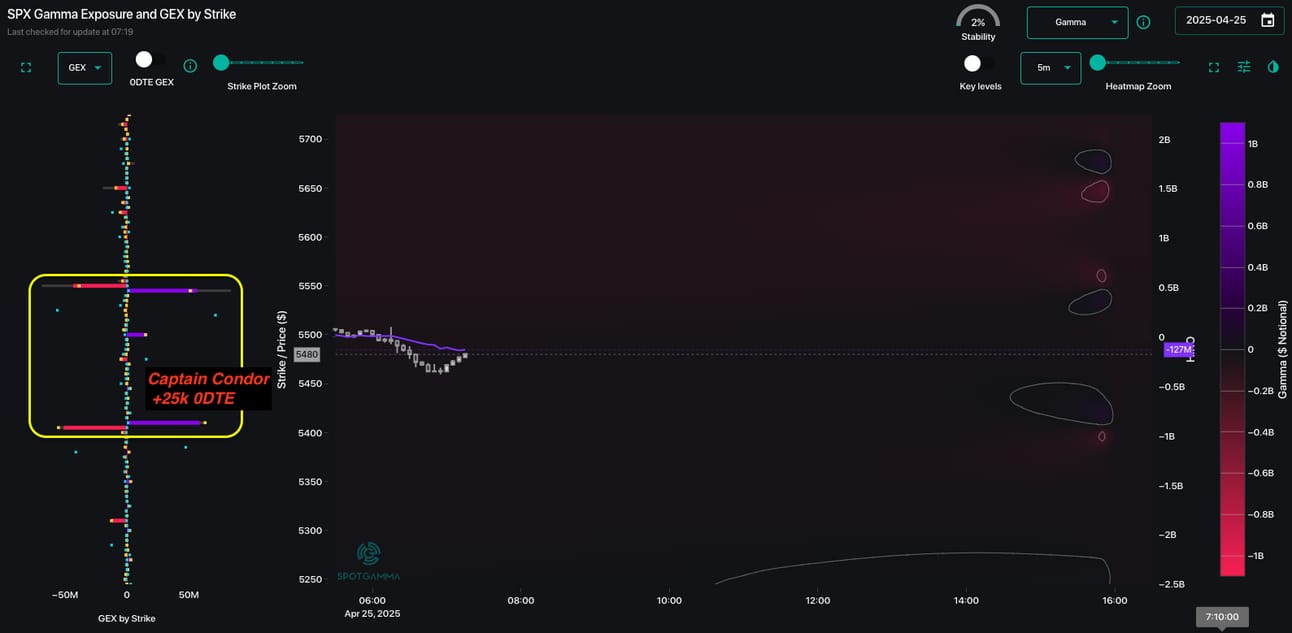
Looking at the SPX gamma landscape via TRACE we see the massive +25k Captain Condor at 5,545 above & 5410 below (see last nights note on CC) – but thats 0DTE. Outside of that is, quite frankly, nothing.
Our thesis has been dealer positive gamma would fill in on sharp market rallies, and this morning we just don’t see that. There is also little to the downside, until we get to 4,800 wherein large positive gamma puts still exist. Through this lens, past today’s big condor strikes (which we look to play as targets for today) there is no real edge to extract from this positioning.
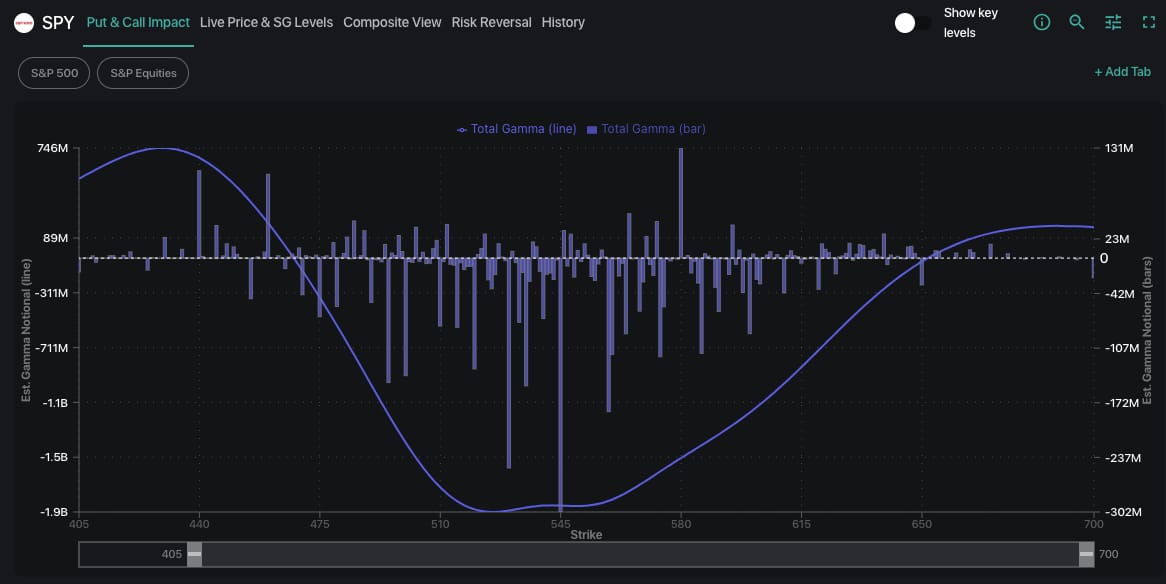
If you look at SPY gamma positioning, its quite large, and very negative. As you can see from the SGOI curve below, peak negative gamma is at 545, and that negative gamma pressure tails off into SPY 475 to the downside, and not until ~600 to the upside. Thats not bullish or bearish – it is conducive to fluid price action through to and above what we’ve called “no mans land”: the 500->580 range.
What about vol?
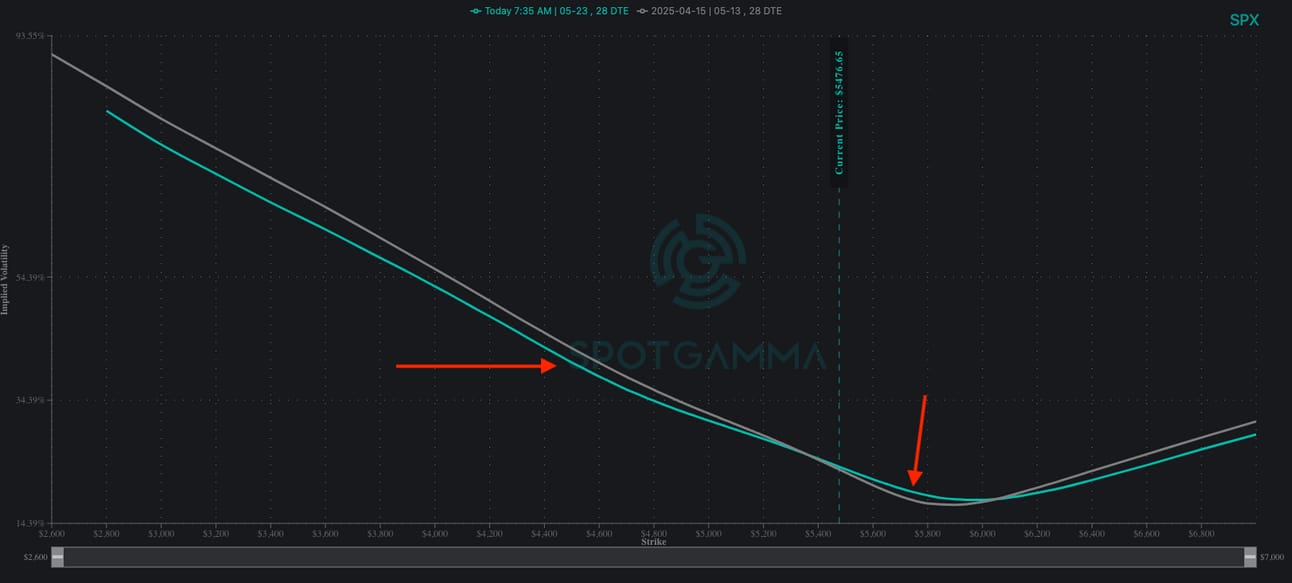
Starting with skew, we’ve compared 1-month skew from last week (gray) to today (teal). Last week was the most recent time the SPX neared the 5,500 area (into VIX exp/OPEX).
What is interesting is the put skew has declined at exactly the area wherein we mark large dealer positive gamma (~4800), and we now see a small lift to call skew >=5,600, which reads like a relative call bid.
This is a bullish development, signaling the repricing of upside vs downside.
But here is where things hit a snag…
>=1week ATM IV for the SPX is ~25%, with the VIX at 27, and SPX 5-10 day realized vol in the 25% area. This tells us that implied vols are too cheap, because IV/VIX at 25-27 is simply matching the amount of movement the SPX has been experiencing. This doesn’t account for any unknown related to a policy tweet, upcoming data points (earnings, NFP, ISM, etc). In order to justify lower IV in the future, you would generally need to see a removal of the known unknown (tariffs).
Its possible the market is sniffing out some deals, and that is leading to the decline in volatility. But the risk with this low IV is that if a bad tweet or headline fires across the wires, then IV’s have to “untwist” as call IV would decline and put IV rises. This downside would occur into the SPX flat/SPY negative gamma construct, which would allow/provide a sharp downside move (3-5%).
So, whats the trade?
We do not want to be short stock/delta here, because there quite frankly is no reason to be. If anything the strong equity options flow last night, combined with the call skew bid is a win for bulls.
That being said we think buying ~1-month puts and or put spreads makes a ton of sense given the lower prices, and the SPX rally into what has been a strong resistance zone (5,450) and the cheapening vol. This is a “great risk reward” trade as opposed to “the market has to crash from here” type view.
If you want to play further price upside, we can’t fault that, but you have to be weary of the fact that call skew will likely contract into further rallies. Given that, we recommend call spreads vs long calls. To be clear, we remain short of +1 month OTM calls from Wednesday’s big market rally. If/when traders start selling puts into near-the-money SPX prices (i.e. supplying positive gamma), then we would start to add long stock/delta to our portfolio.
Get instant access to our partners real-time market data and insights not available anywhere else. Here is last night Founder’s note getting you ready for today’s market and explaining the constraints in yesterday’s market. – MrTopStep
Trading Room News:
Polaris Trading Group Summary – Thursday, April 24, 2025
Yesterday was a textbook bullish trend day in the PTG Room, with a game plan that played out nearly to perfection, guided by David Dube’s premarket DTS briefing and sharp intraday commentary.
Market Context & Opening
-
Both ES and NQ opened lower, having fulfilled overnight downside targets from the DTS Briefing: ES hit 5360 and NQ reached 18625.
-
David laid out potential bear scenarios early on, but warned that price action may transition to a “Wild Card” Cycle Day 3 with the bulls still in control.
-
A key note from the briefing: a 5375–5340 open gap in ES could either get filled or become a bullish fuel if left open — which turned out to be a critical piece of the puzzle.
Trade Highlights & Key Levels
-
Early Morning: Bears had brief control, but the bulls quickly reclaimed momentum. David marked 5385 as the pivot zone, and once it held, bullish scenarios targeting 5455–5500 came into play.
-
9:49 AM: NQ Open Range Long target was fulfilled — a strong start to the morning session.
-
10:20 AM: ES tagged 5455, hitting the first upper-level bull target. David confirmed the game plan was playing out “perfectly.”
-
12:57 PM: BOOM! 5500 target hit — a major milestone in the day’s roadmap. Notably, the 5375–5340 gap was not filled, which aligned with the scenario that propelled the rally.
-
Room members were enthusiastic, recognizing the accuracy and execution: “GREAT job David!!”
Afternoon Session & EOD
-
Post-lunch turned into a grind zone between 5485–5505 as bulls maintained control and shorts struggled.
-
2:51 PM: Next ES target called at 5516.25, with chatter about testing April highs in the 5520–5565 zone.
-
3:15 PM: Market reversed off the D-Level Money Box Zone — possibly a dip and rip setup into the close.
-
3:50 PM: MOC order came in strong — $1.2B BUY, adding late-day fuel.
-
Post-Close: Alphabet (GOOGL) earnings beat expectations (Rev: $90.23B vs. $89.1B, EPS: $2.81 vs. $2.10), leading to a strong after-hours rally.
Lessons & Takeaways
-
Follow the Game Plan: The DTS Briefing nailed both the downside targets early and the bullish roadmap once key support held.
-
Gap Insight Was Gold: The unfilled open gap between 5375–5340 was the bullish ignition point for a run to 5500 — a clear lesson in the power of market structure.
-
Cycle Day Awareness: Understanding the transition from Cycle Day 2 to Day 3 helped frame expectations for range and direction.
-
Discipline Pays: Sticking to the plan, staying patient, and waiting for confirmation above key levels rewarded traders.
DTG Room Preview – Friday, April 25, 2025
-
Market Rally Continues:
-
Nasdaq +8%, S&P 500 +6%, Dow +5% over the past 3 sessions
-
Boosted by optimism around potential U.S. tariff deals with South Korea, India, and Norway
-
-
China Trade Update:
-
Considering easing tariffs on U.S. goods as cost pressures mount
-
Rejected U.S. overtures, demanding full removal of existing tariffs
-
Denied any recent progress in trade talks
-
-
Fed Watch:
-
Cleveland Fed’s Beth Hammack signals openness to a June rate cut if supported by data
-
-
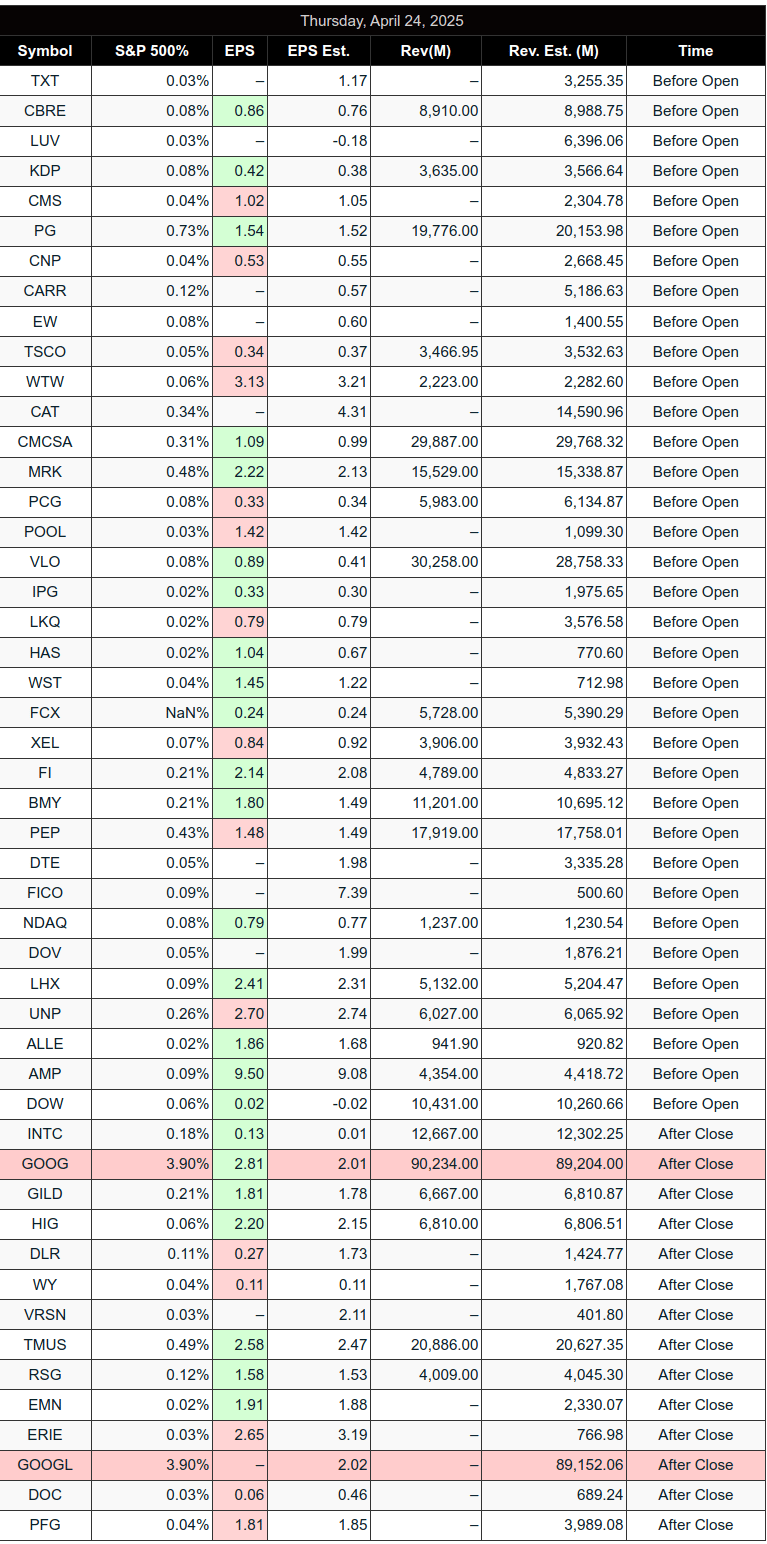
Earnings Highlights:
-
Alphabet (GOOG):
-
Beat Q1 EPS and revenue
-
+5% dividend hike
-
$70B stock buyback announced
-
Shares +3% AH
-
-
Intel (INTC):
-
Beat top and bottom line
-
Issued conservative outlook citing macro uncertainty
-
Shares -6% AH
-
-
-
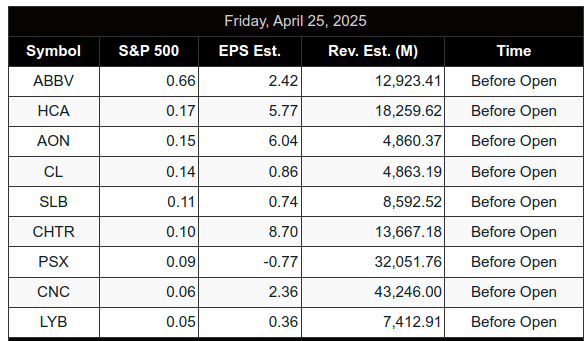
Premarket Earnings to Watch:
-
AbbVie (ABBV), AON, AVTR, Centene (CNC), Charter (CHTR), Colgate (CL), HCA Healthcare (HCA), LYB, NWG, Nomura (NMR), Phillips 66 (PSX), Schlumberger (SLB)
-
-
Economic Calendar:
-
University of Michigan Consumer Sentiment & Inflation Expectations @ 10:00am ET
-
-
Volatility Watch:
-
ES 5-day average daily range elevated at 182 points
-
-
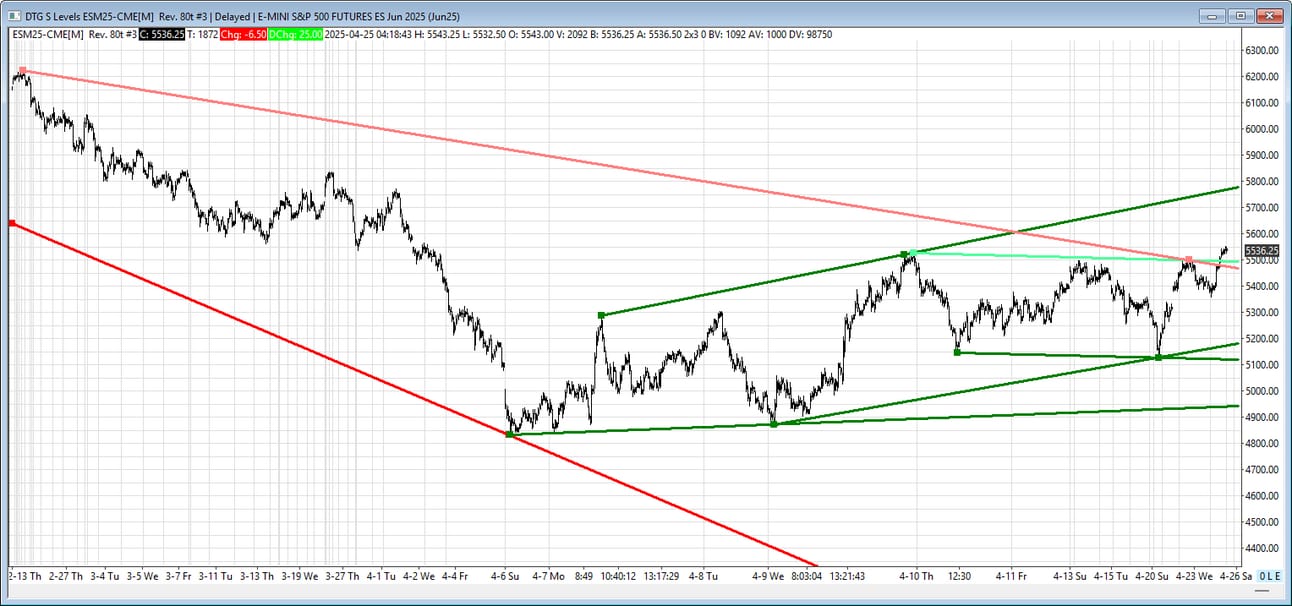
Market Structure (ES Futures):
-
Bullish breakout above intermediate and short-term downtrend channels
-
Resistance (TL Rs): 5775/85s
-
Support (TL Ss): 5475/70s, 5181/86s, 5117/12s, 4946/56s
-
Whale bias remains bullish heading into U.S. session on lighter overnight volume
-
ES
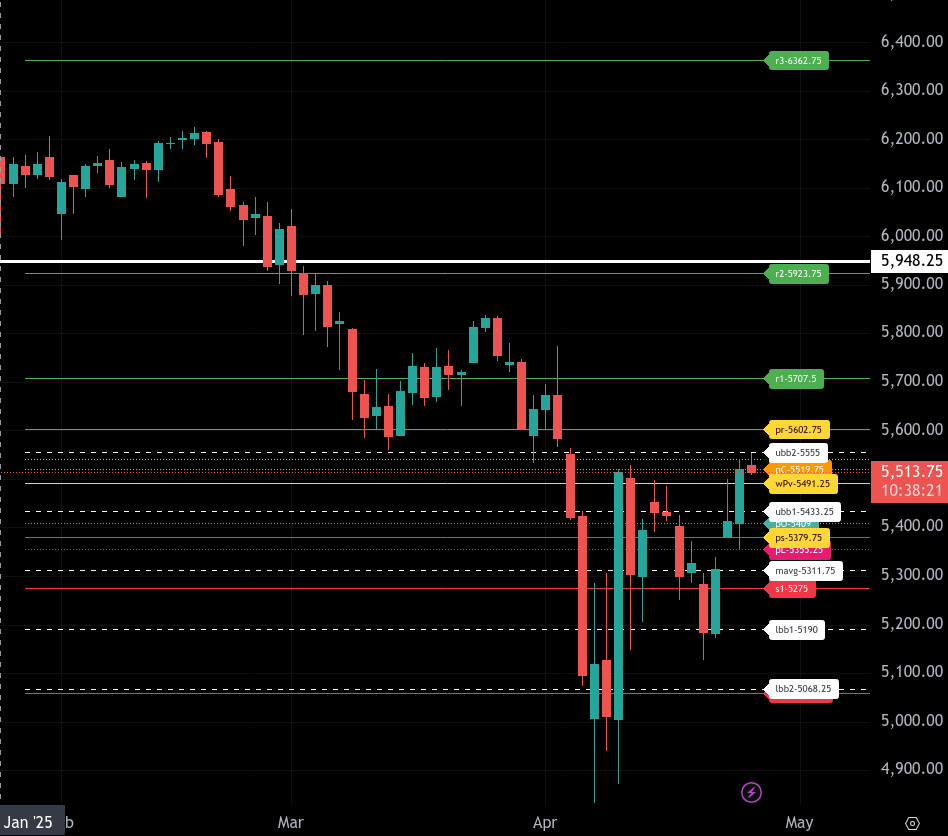
The bull/bear line for the ES is at 5491.25. This is the key pivot that determines directional bias today. Price is currently trading above it, around 5510.00 as of 6:38 AM ET, showing strength after reclaiming this critical level.
As long as ES holds above 5491.25, buyers maintain the advantage. Immediate resistance sits at 5519.75 (previous close) and 5541.50 (prior session high). A break above these levels could target 5602.75, which is the upper intraday range target.
If ES loses 5491.25 again and fails to hold above it, sellers could regain control. Downside targets in that case include 5433.25, 5409.00, 5379.75, 5355.25, and 5275.00, with 5379.75 as the lower intraday range target. A break below 5355.25 could trigger an accelerated drop toward 5311.75 (200-day average reference).
Overall, the posture has turned bullish above 5491.25, and buyers are in control as long as price holds this pivot level.
NQ
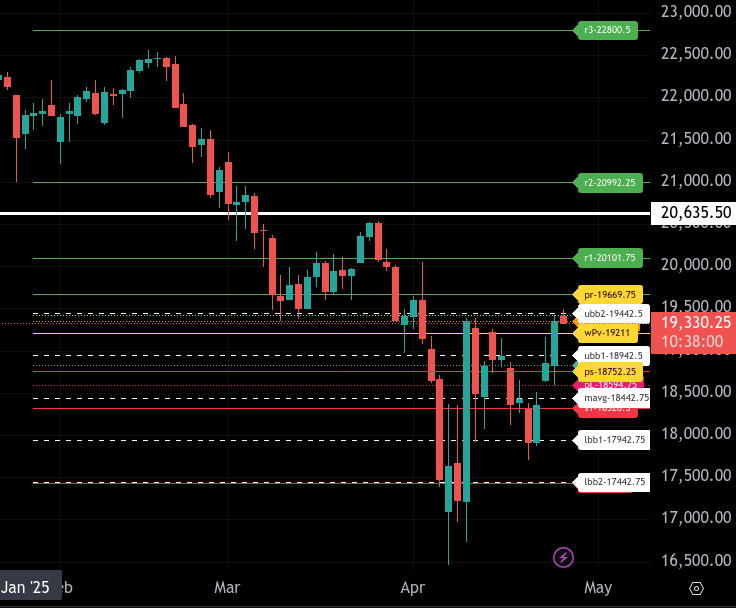
The bull/bear line for the NQ is at 19,211.00. Price is currently trading above this level, suggesting the potential for continued bullish sentiment if support holds here.
The immediate intraday upside target is 19,669.75, which aligns with the upper range level. If that level breaks, further resistance lies at 20,101.00 and then 20,635.50. A sustained rally could even stretch toward the major resistance level at 20,992.25.
On the downside, if NQ loses the bull/bear line at 19,211.00, the next levels to watch are 19,037.50 (initial support), followed by the lower range target at 18,752.25. If selling intensifies, further support comes in at 18,594.75 and 18,320.50.
As long as NQ holds above 19,211.00, dips can be viewed as potential buying opportunities toward the upper target range. A confirmed break below 19,211.00, however, would flip the bias to bearish for the session and open the door for a deeper pullback.
Calendars
Economic Calendar Today
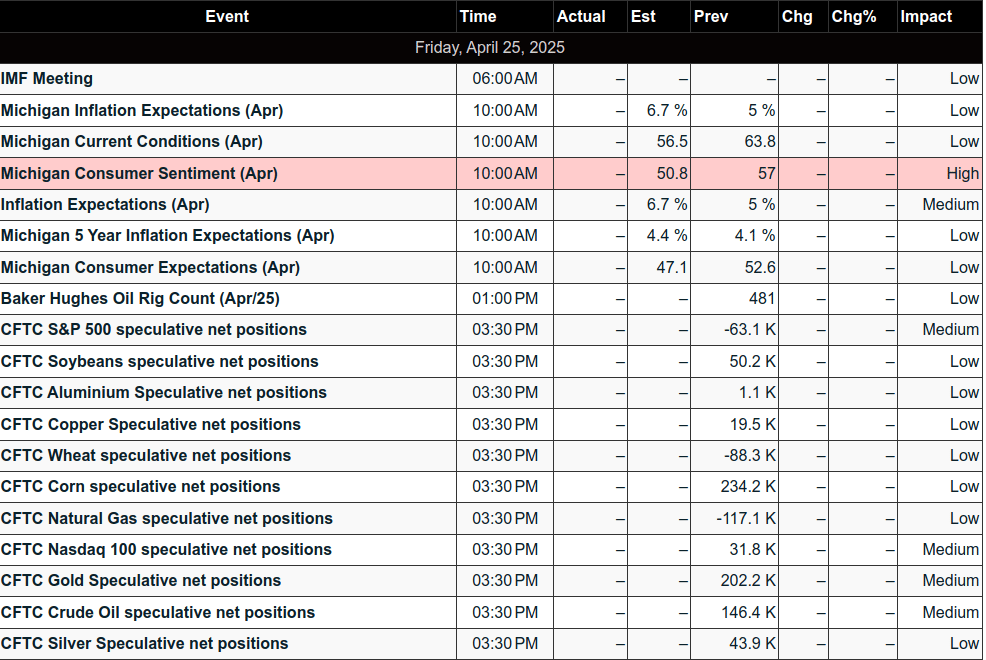
This Week’s High Importance
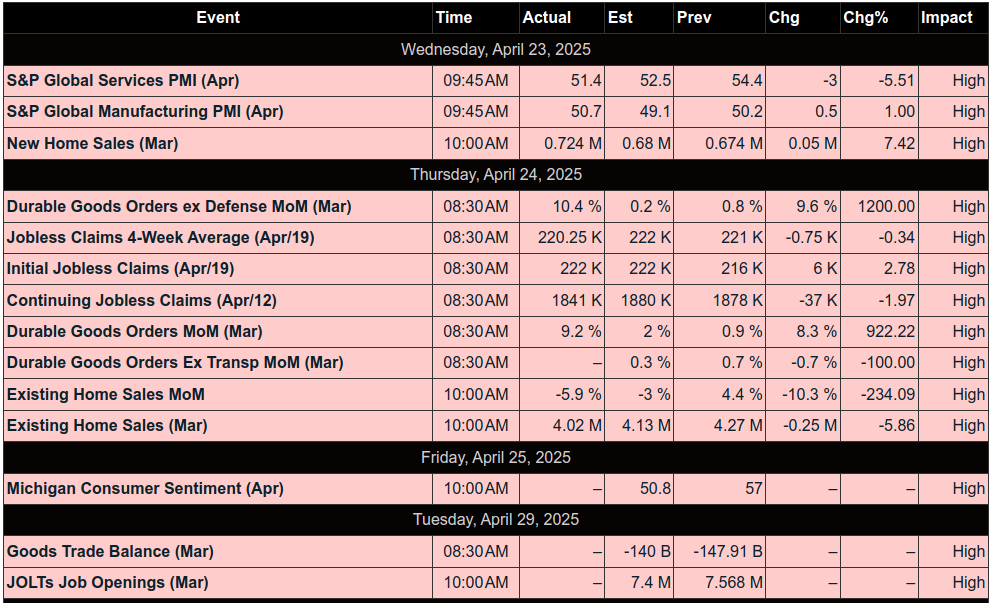
Earnings:
Affiliate Disclosure: This newsletter may contain affiliate links, which means we may earn a commission if you click through and make a purchase. This comes at no additional cost to you and helps us continue providing valuable content. We only recommend products or services we genuinely believe in. Thank you for your support!
Disclaimer: Charts and analysis are for discussion and education purposes only. I am not a financial advisor, do not give financial advice and am not recommending the buying or selling of any security.
Remember: Not all setups will trigger. Not all setups will be profitable. Not all setups should be taken. These are simply the setups that I have put together for years on my own and what I watch as part of my own “game plan” coming into each day. Good luck!!
Follow @MrTopStep on Twitter and please share if you find our work valuable!
Follow @MrTopStep on Twitter and please share if you find our work valuable!
Our View
Over-investment in the top 7 to 10 stocks, the Fed cutting rates while inflation was going up, the U.S. deficit at $36.7 trillion, lower consumer confidence and spending, slower growth, recession fears, earnings growth at risk as tariffs raise costs and erode margins, a softening labor market, geopolitical clashes, and last but not least, President Trump’s unending tariffs. These problems have created an environment of uncertainty and a big jump in the CBOE’s fear gauge, the VIX, which traded all the way up to 30.02. The last time it was this high was August 5, 2024.
The index markets had their steepest declines since 2020 and wiped out $2.7 trillion in market cap. The Dow dropped 1,679 points or 4%, and the tech-heavy Nasdaq—which powered the market higher for years—was down 6%, pulled lower by big declines in $NVDA, $AAPL, and $AMZN. The S&P 500 fell 4.8%, and the other benchmarks suffered their sharpest declines since the early days of the Covid-19 pandemic.
There are thousands of ways to get fooled by the ES and NQ when they start going up, it’s human nature, but the down move sees no bounds. I know there are a lot of really good newsletters out there, some even give “tips.” That is not how this works. First, I try to provide a newsletter that supplies a feel of the markets. Sometimes it’s a few sentences, and other times it’s just a straight look at what’s going on.
Today is the March jobs report, and it could be a pivotal day. Let me explain. In the MrTopStep Trading Rules 101 (https://mrtopstep.com/trading-101/), there are some rules that still work. If you scroll down, you’ll see one called Counter Trend Friday.
Counter-Trend Friday: Over the years, this trade works best on monthly NFP jobs Fridays when the S&P futures gap sharply higher or lower on oversized pre-market Globex volumes of 400k+ ES contracts before the 8:30 am CT open. This is a fade, “the bus is too full” type of trade.
Example: The S&P is down 15 handles at 6:00 am and then down another 20–30 or more handles after the jobs number is released. Now, the S&P is down sharply at the 9:30 am open. With 400k+ minis traded before the open, this tells us that traders have already voted (sold). Depending on the price action, the idea is to buy a sharply lower open or allow the first drop after the gap down. The idea behind this is that with so many minis traded and it being a Friday—and knowing most traders can’t hold the futures over the weekend—they put in buy stops, and the algorithms go right for the buy stops. With all the selling used up pre-open, the ES will start to short cover into the buy stops that lift the offer side of a buy program.
I revised one part of the rule: you buy the lower open or the first drop below the gap down. This would also work in reverse for a big gap up. My gut tells me it’s “FRYday” today, and with the E-mini S&P 500 (ES) falling from its Wednesday high of 5,771 to last night’s early Globex low of 5,407.50—a drop of 364 points in just over 26 hours—the pace is stunning. Yesterday’s breakdown opened the door to 5,300–5,400, yet I didn’t expect it to happen this fast. The decline is accelerating.
Meanwhile, the dollar suffered its sharpest drop since 2023. When asked about the decline, Trump said, “I think it’s going very well; the markets are going to boom.” Oil plunged 6%, and gold fell 1.5% early in the day to $3,087 before rallying $72 from its low, climbing back to $3,140.00.
Our Lean
Like I said, these are great markets for retail traders, but that is a very small segment of the entire marketplace. That said, with the ES and NQ down so much so fast, I think we could bounce. Does it happen after a lower open, or will the ES make an early low and bounce?
Today is the March jobs report, and Goldman Sachs has forecast a 150,000 increase in nonfarm payrolls (NFP) for March 2025. Specifically:
-
They expect a +150,000 rise in total nonfarm payrolls, slightly above the consensus estimate of +140,000 but below the three-month average of +200,000,
-
Private payrolls are projected to grow by +160,000, with the unemployment rate (UR) holding steady at 4.1%, consistent with their February outlook where the BLS reported 151,000 jobs added.
Our lean: I’m looking for an early bounce. I could be wrong, but Fridays tend to be counter-trend days. This is not a switch in my opinion, but more of a feeling that the ES and NQ are short-term oversold and due for a bounce that will eventually get sold. If I’m wrong and the ES starts falling again, I have 5390, 5360, and then down to 5320 as the next levels. Everything is moving!
MiM and Daily Recap
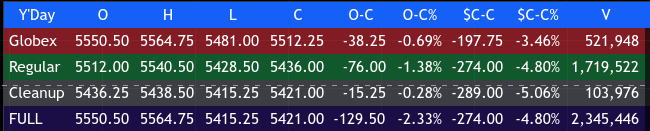
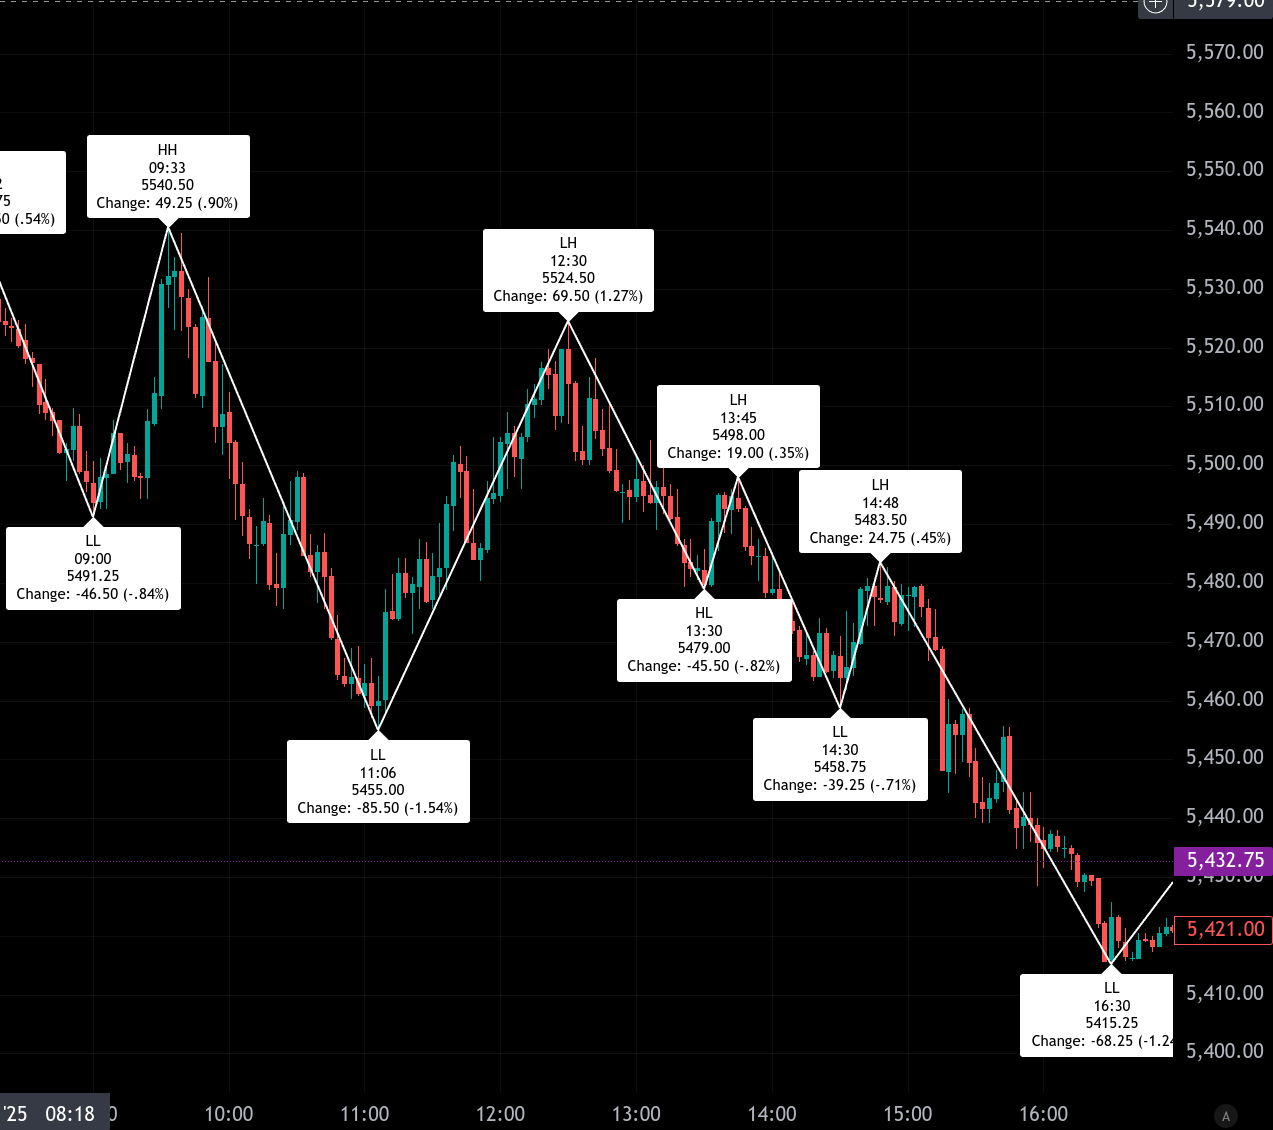
The S&P 500 futures (ES) endured a volatile and directional session Thursday, closing markedly lower with consistent selling pressure across the day. The market opened the regular session at 5512.00 and briefly pushed to an early high of 5540.50 at 9:33 AM. This initial strength added 49.25 points from the 9:00 low of 5491.25, but it marked the session’s highest print.
A sharp reversal followed, driving ES down to 5455.00 by 11:06 AM, the morning’s deepest pullback, registering a 1.54% drop from the early high. Buyers briefly regained control through midday, carrying prices to a lower high of 5524.50 at 12:30 PM—an impressive 69.50-point rebound.
That midday strength was again met with selling. A lower high of 5498.00 printed by 1:45 PM, followed by a sharp move down to 5458.00 at 2:30 PM, and a minor lower high at 5483.50 at 2:48 PM. Late-session selling intensified, with the market cascading into a final low of 5415.25 at 4:30 PM, capping a 68.25-point slide from the prior swing high and a full-session loss of 2.33%.
From session to session, ES declined 274.00 points from Wednesday’s cash close of 5695.00 to Thursday’s 5436.00 cash close, a 4.80% drop. The regular session also saw a steep 76.00-point fall from the open to the 4:00 PM close. Volume was robust, with over 1.7 million contracts traded during regular hours and 2.34 million total on the day.
Thursday’s tone leaned decisively bearish, marked by a steady sequence of lower highs and lower lows, and capped by a powerful end-of-day liquidation move. The inability of the midday rally to break above the early high confirmed sellers’ control throughout the day.
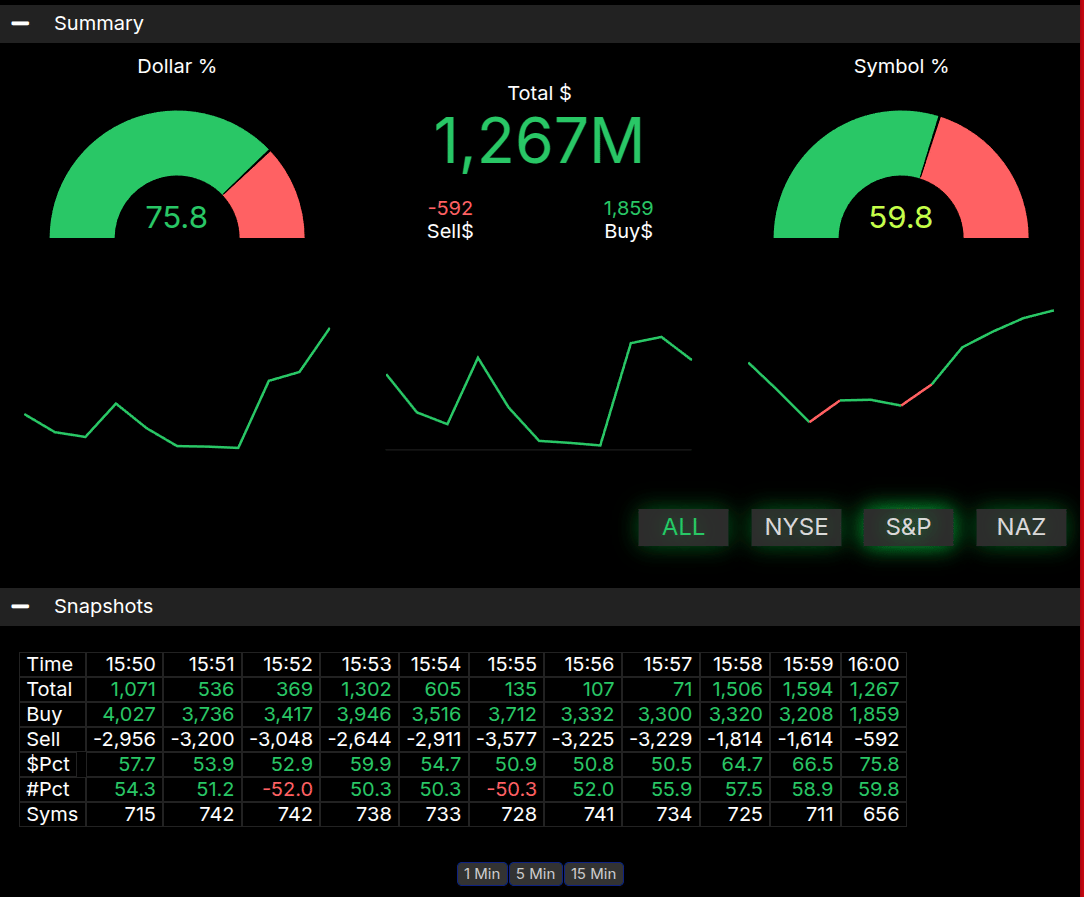
The Market-on-Close (MOC) imbalance was notable, with $1.267 billion to buy and a strong dollar imbalance of 75.8% to the buy side. Despite this, the late-session rally failed to materialize. Symbol imbalance reached only 59.8%, below the 66% threshold for a decisive directional read. This suggests that while there was a buy imbalance in dollar terms, it was not broad-based across symbols, and thus didn’t shift the market’s downward momentum.
Technical Edge
Fair Values for April 4, 2025
-
SP: 37.05
-
NQ: 149.71
-
Dow: 236.48
Daily Breadth Data 📊
For Thursday, April 3, 2025
-
NYSE Breadth: 12% Upside Volume
-
Nasdaq Breadth: 29% Upside Volume
-
Total Breadth: 26% Upside Volume
-
NYSE Advance/Decline: 13% Advance
-
Nasdaq Advance/Decline: 17% Advance
-
Total Advance/Decline: 15% Advance
-
NYSE New Highs/New Lows: 53 / 547
-
Nasdaq New Highs/New Lows: 54 / 856
-
NYSE TRIN: 1.09
-
Nasdaq TRIN: 0.49
Weekly Breadth Data 📈
Week Ending Friday, March 28, 2025
-
NYSE Breadth: 42% Upside Volume
-
Nasdaq Breadth: 51% Upside Volume
-
Total Breadth: 48% Upside Volume
-
NYSE Advance/Decline: 35% Advance
-
Nasdaq Advance/Decline: 29% Advance
-
Total Advance/Decline: 31% Advance
-
NYSE New Highs/New Lows: 112 / 204
-
Nasdaq New Highs/New Lows: 187 / 610
-
NYSE TRIN: 1.20
-
Nasdaq TRIN: 0.61
Guest Posts:
Get instant access to our partners’ real-time market data and insights not available anywhere else. Here is last night’s Founder’s note getting you ready for today’s market and explaining the constraints in yesterday’s market. – MrTopStep
Founder’s Note:
Futures are -2% after China announced tariff retaliation.
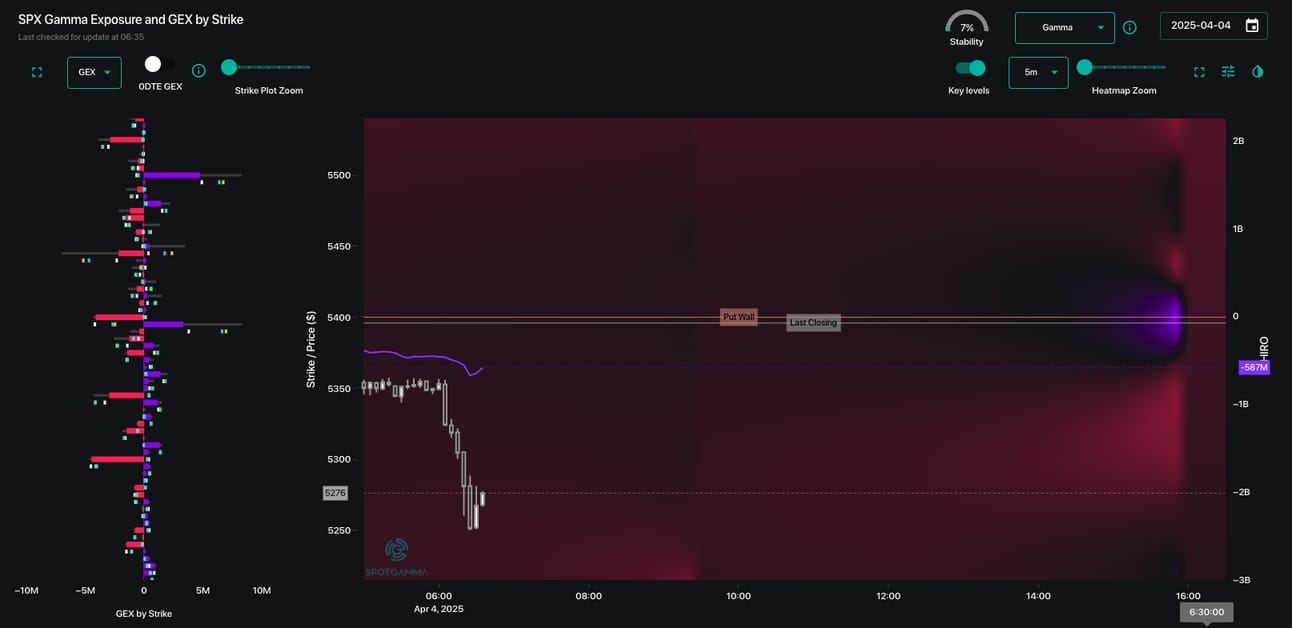
HIRO is showing unusually large pre-market/overnight put buying, as shown below. Anecdotally we cannot recall seeing -$650mm of prem-market S&P500 deltas (HIRO signal).
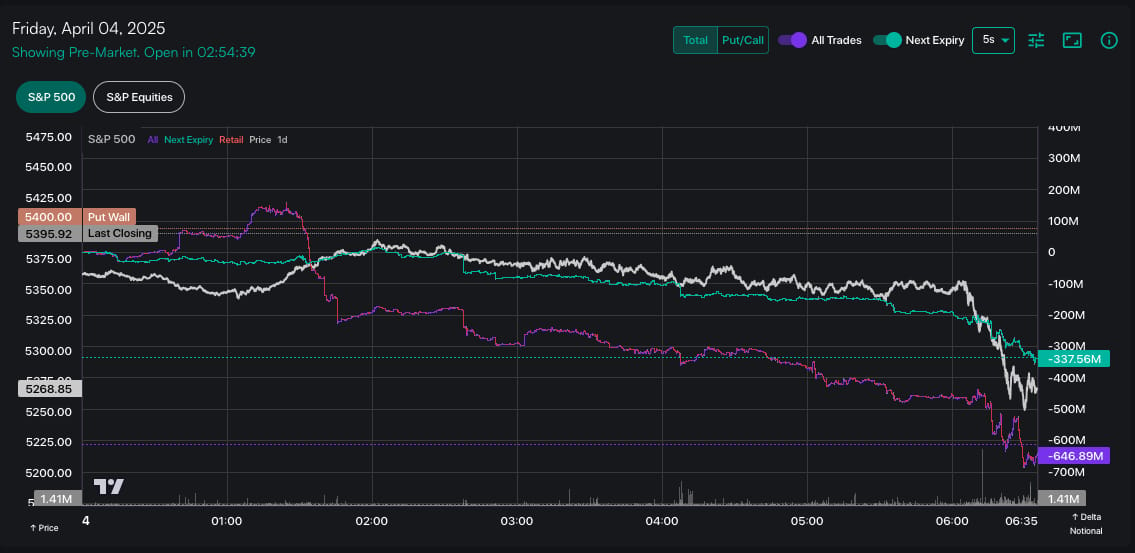
Yesterday AM we were flagging 5,400 as major support, and that served to provide a ~1.2% bounce. However, as noted last night, the positive gamma support at 5,400 deteriorated greatly on that bounce (dealers lost positive gamma), and HIRO signaled longer dated put buying from 2PM – 4PM ET.
Our partners at SpotGamma introduced two new products this week during a webinar. You watch that webinar here:
And take advantage of their 50% off an annual subscription here:
Get instant access to our partners real-time market data and insights not available anywhere else. Here is last night Founder’s note getting you ready for today’s market and explaining the constraints in yesterday’s market. – MrTopStep
Trading Room News:
Polaris Trading Group Summary – Thursday, April 3, 2025
Today’s trading session in the PTG room, led by PTGDavid, was marked by a steady downtrend and persistent bearish pressure, culminating in what David humorously referred to as an “Ass-Whooping” — a technical term coined for days with index drops exceeding 3%.
Early Session Highlights:
-
Initial Bias: David signaled a long side lean early on, but emphasized flexibility based on the developing rhythm of the market.
-
First Trade: @CL OPR Short Target 1 was successfully filled, marking a solid start.
-
MATD (Morning After Trend Day) rhythms played out within expected range rules.
-
The market was choppy around 10am with econ data releases (ISM, SVC) and a reclaim attempt of the overnight low.
Midday Action:
-
The bears dominated, sending the indexes tumbling. The phrase “bulls continue to slip on the soap bar” summed it up as price levels like 5470 were tagged.
-
Trump-related headlines spiked volatility in NQ, spoiling a potential long.
-
By lunchtime, David noted a mid-VWAP consolidation, and the room recharged for the afternoon.
Afternoon Breakdown:
-
2PM brought the “shake n bake” as selling pressure continued. Bulls failed to defend IB Low (5475), suggesting intent to test lower price levels.
-
High Volume Climax Bars began appearing, but were met with more resistance.
-
Despite a late 600M MOC Buy Imbalance, there was no real bullish follow-through—just continued exhaustion of buyers.
Lessons & Takeaways:
-
Key technical zones (like IB Low and the DLMB) acted as inflection points, but resistance was strong at every bounce.
-
Staying flexible and following rhythm-based trading was emphasized again today—David guided the room through the chop and the downtrend effectively.
-
Humor helped lighten the intense bearish tone, but the market offered great lessons in discipline and recognizing failed bounce attempts.
Notable Quotes & Moments:
-
“The Selling Will Continue Until Morale Improves!” – PTGDavid
-
“Bulls continue to slip on the soap bar” – A vivid image of the day’s failed rallies
-
“Ass-Whooping” – Now officially defined on the PTG glossary!
Overall, it was a challenging but educational day with successful early shorts, clear intraday structure analysis, and reinforcement of patience when bulls show no strength. Great work by the team keeping it light in a heavy market!
Let me know if you’d like charts or key price levels highlighted!
DTG Room Preview – Friday, April 4, 2025
-
Market Meltdown on Tariff Shock
-
The S&P 500 and Nasdaq suffered their worst single-day drops since 2020.
-
Roughly $2.5 trillion in market cap was erased following Trump’s “Liberation Day” tariff announcement.
-
Trump stated the rollout is “going very well” and that he’s open to “phenomenal” offers to negotiate new tariff terms.
-

ES – Week over Week
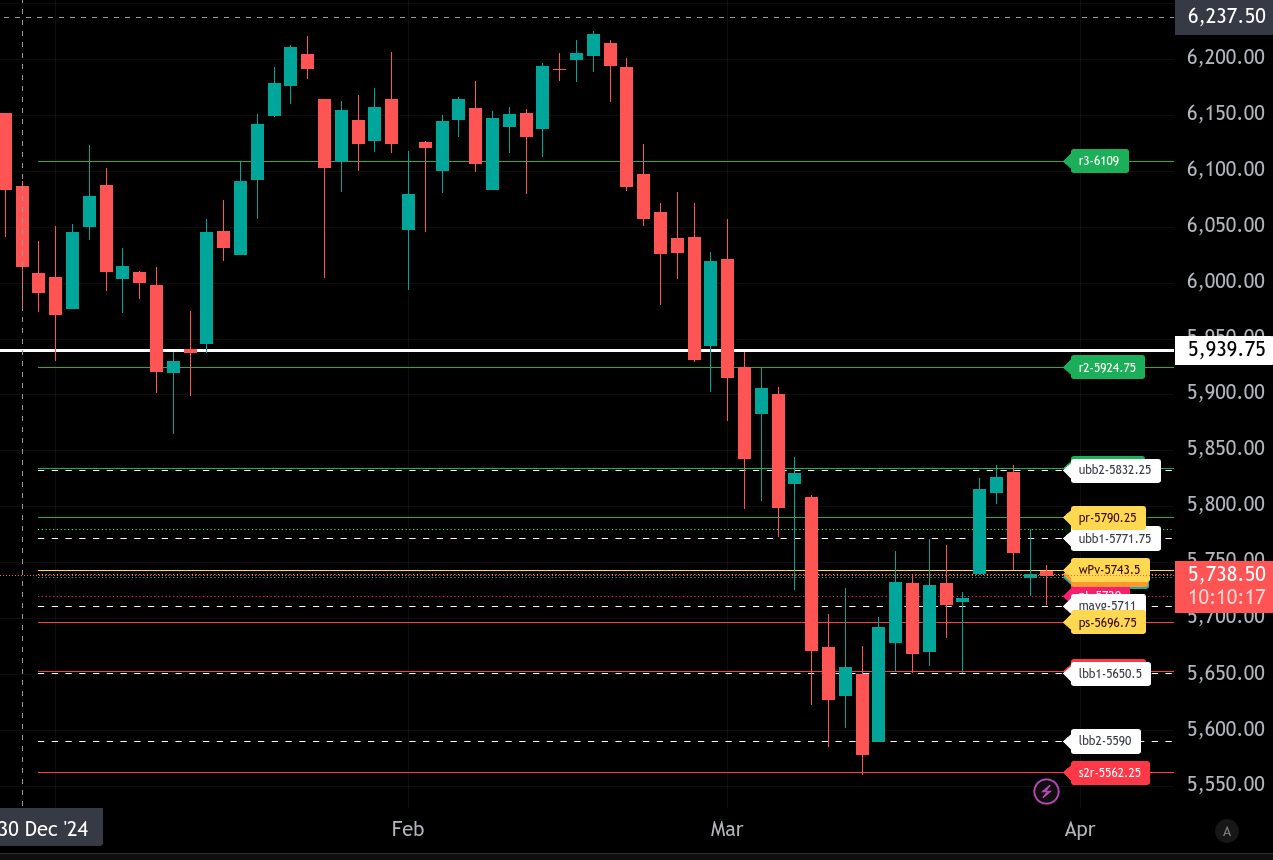
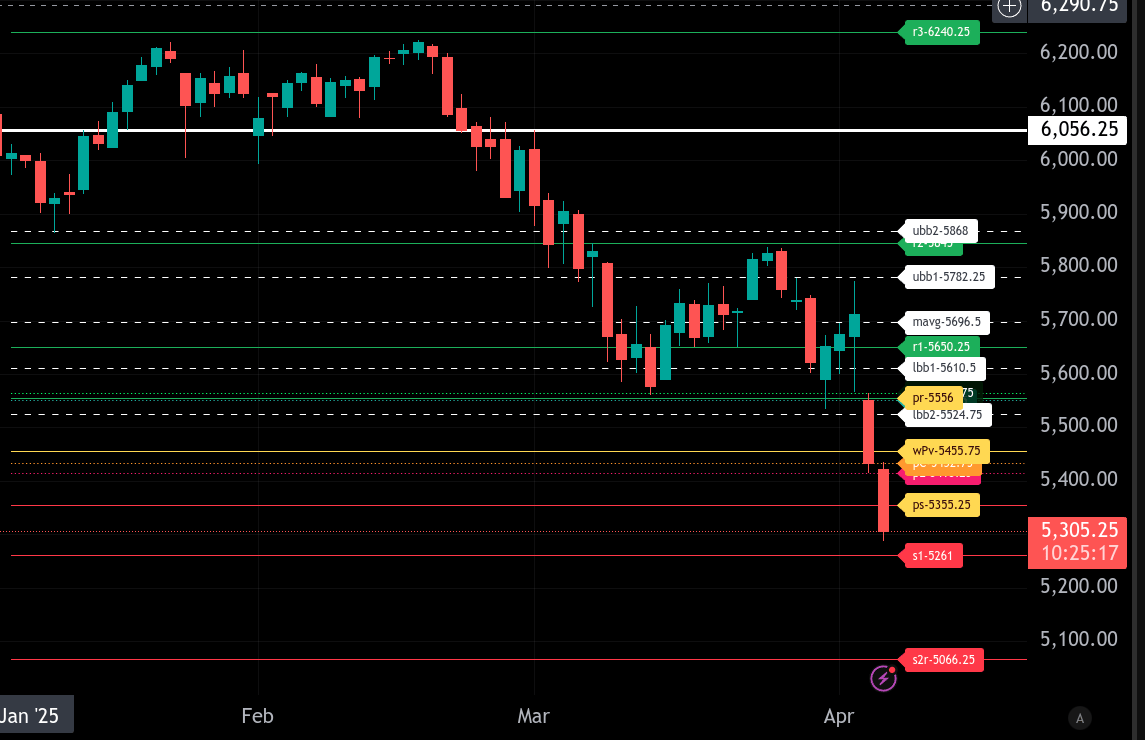
The bull/bear line for the ES is at 5455.75. This is the key level that must be reclaimed for bullish momentum to return. Until then, bearish control remains dominant.
Currently, ES is trading around 5308.00, which is well below the bull/bear line, indicating a continued bearish bias. If this weakness persists, expect price to push toward lower support levels at 5261.00 and then down to the lower range target of 5066.25.
On the upside, initial resistance comes in at 5355.25. Above that, price would need to reclaim 5432.75 and ultimately the bull/bear line at 5455.75 to shift the tone back toward bullish. If bulls can clear that zone, we could see a move toward 5556.00 and the upper range target of 5610.50.
Overall, ES remains in a bearish posture under 5455.75, with sellers pressing into lower support levels. Watch for any signs of reversal near the 5261.00 and 5066.25 zones.
NQ – Week over Week
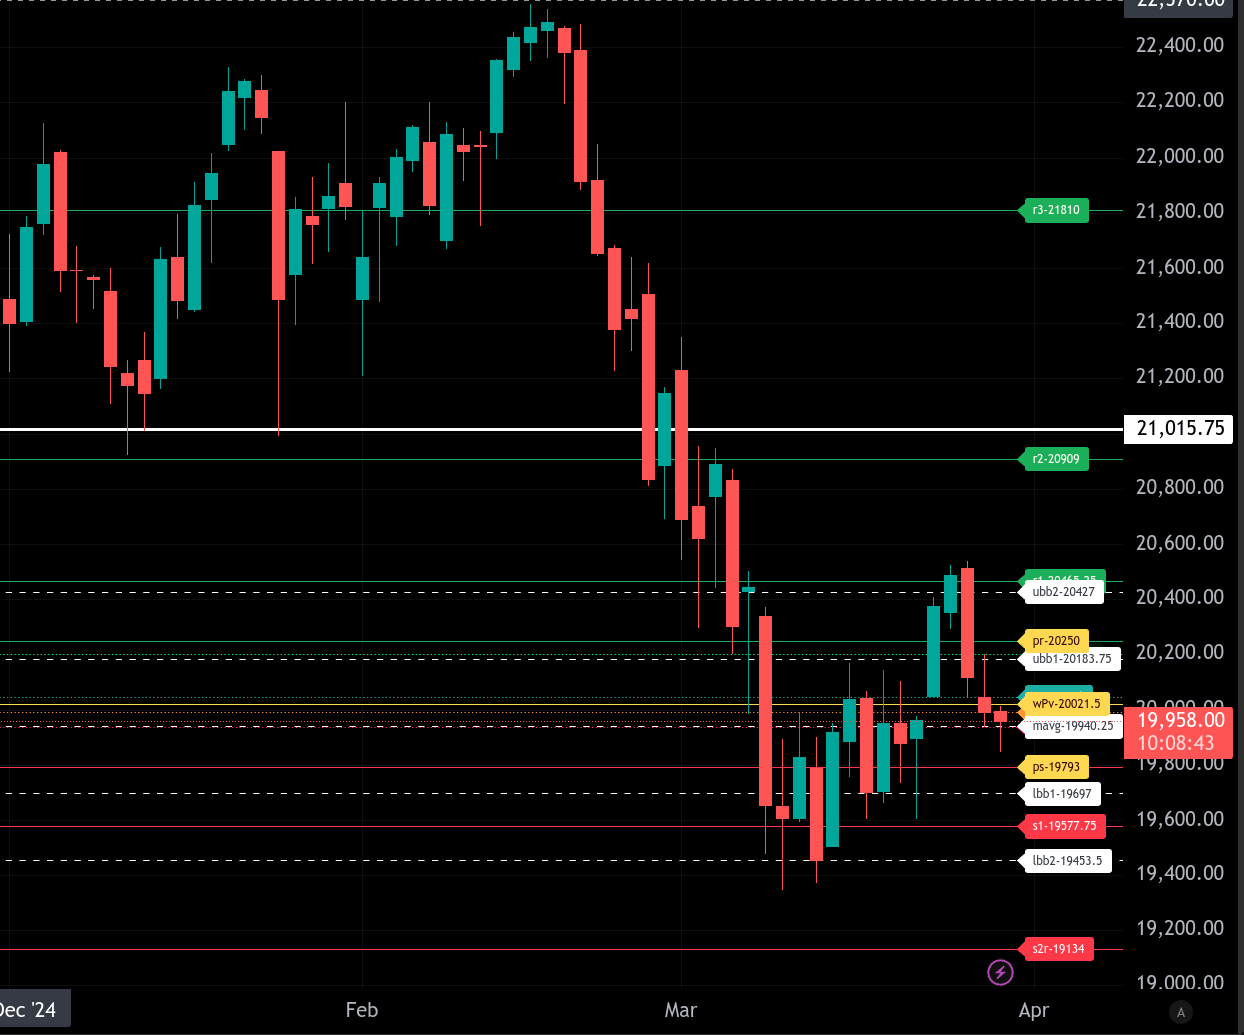
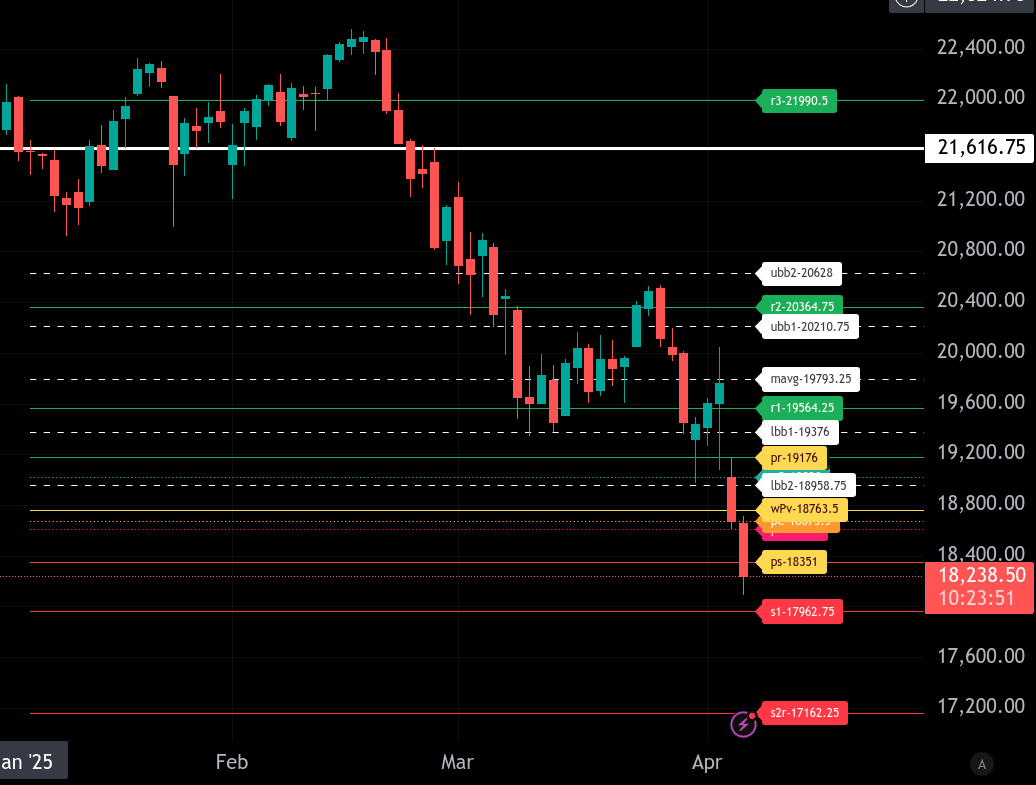
The bull/bear line for the NQ is at 18,763.50. This is the pivotal level for today’s trading. As long as price remains below this mark, the bias is bearish.
Currently, NQ is trading around 18,233.75, firmly below the bull/bear line, confirming selling pressure in the pre-market. The lower range target for today is 18,351.00, which has already been broken. This opens the door for further downside toward 17,962.70 and potentially as low as 17,162.30 if momentum accelerates.
On the upside, bulls would need to reclaim 18,763.50 to neutralize the current bearish momentum. Above that, resistance is seen at 19,176.00, with a stretch target toward 19,564.30, our upper range target for the day.
Given the sharp overnight rejection from the 19,900 area, caution is warranted on any bounce attempts. Bears are in control below 18,763.50, and the trend will remain under pressure until this level is regained.
Calendars
Economic Calendar Today
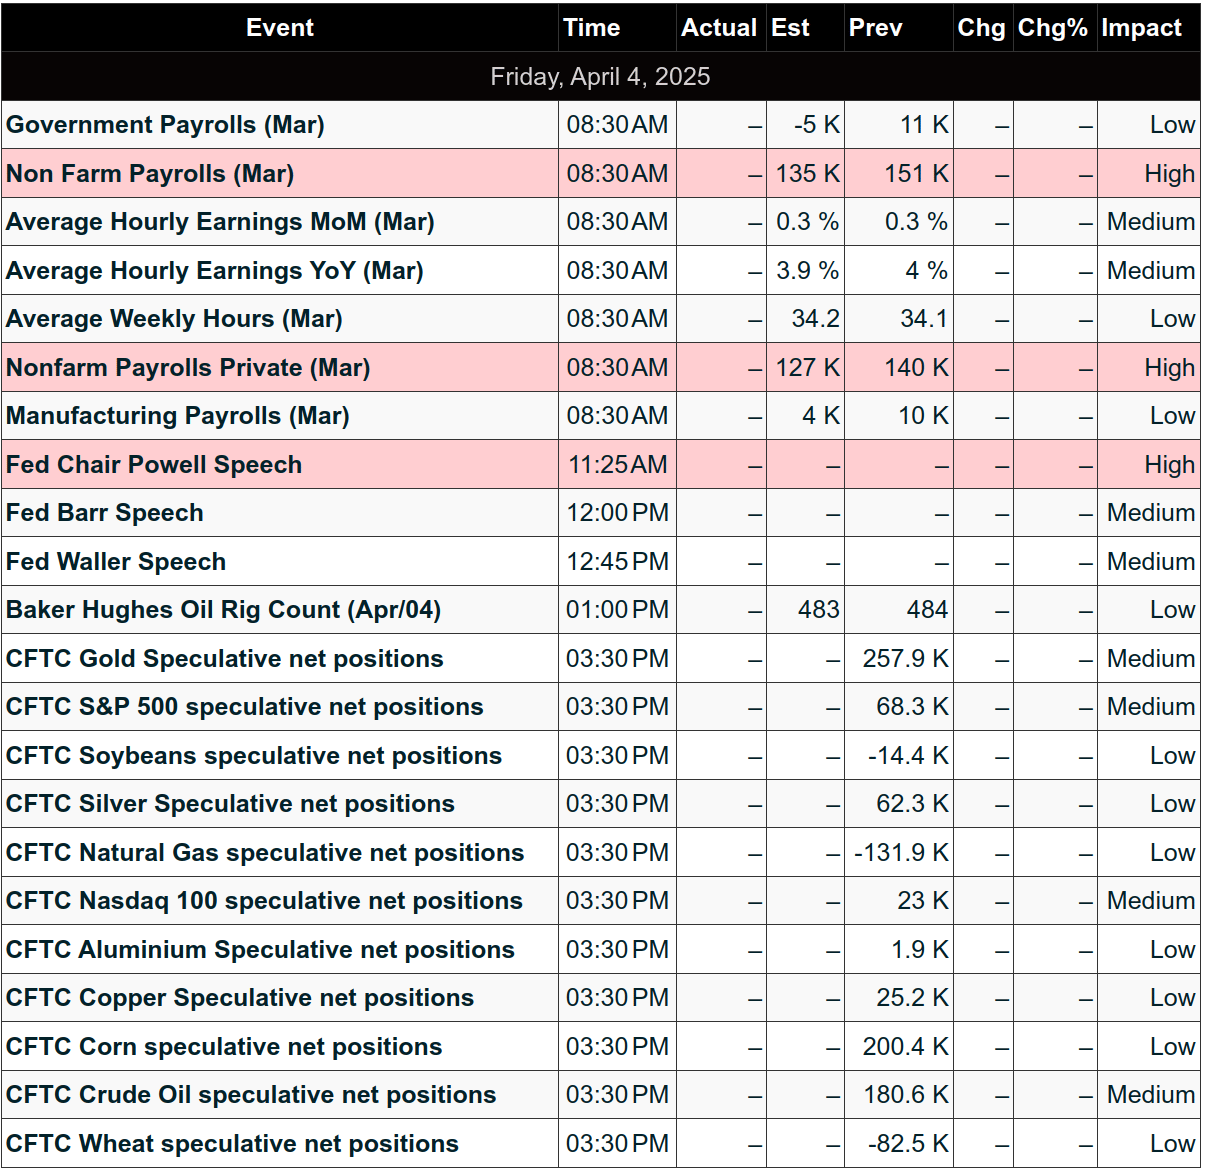
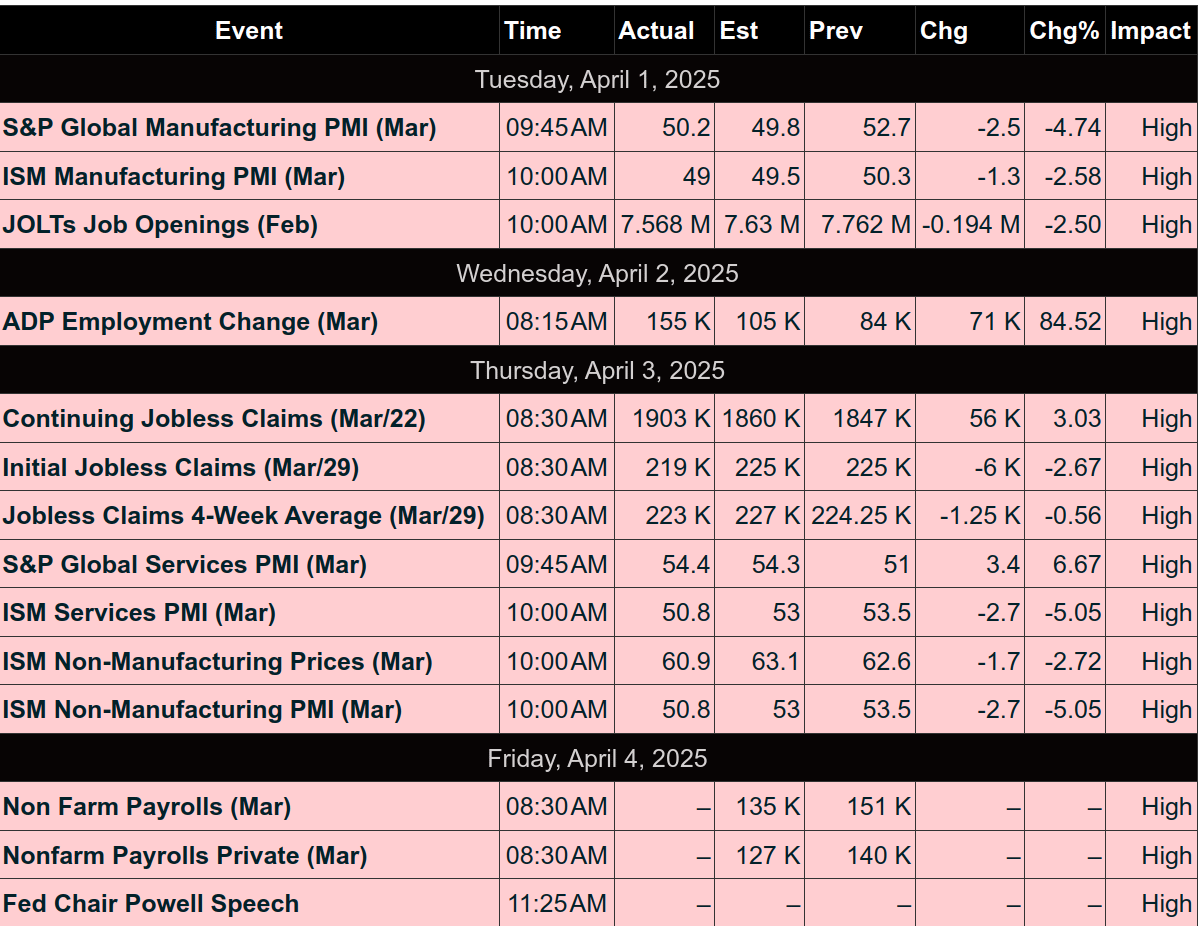
This Week’s High Importance
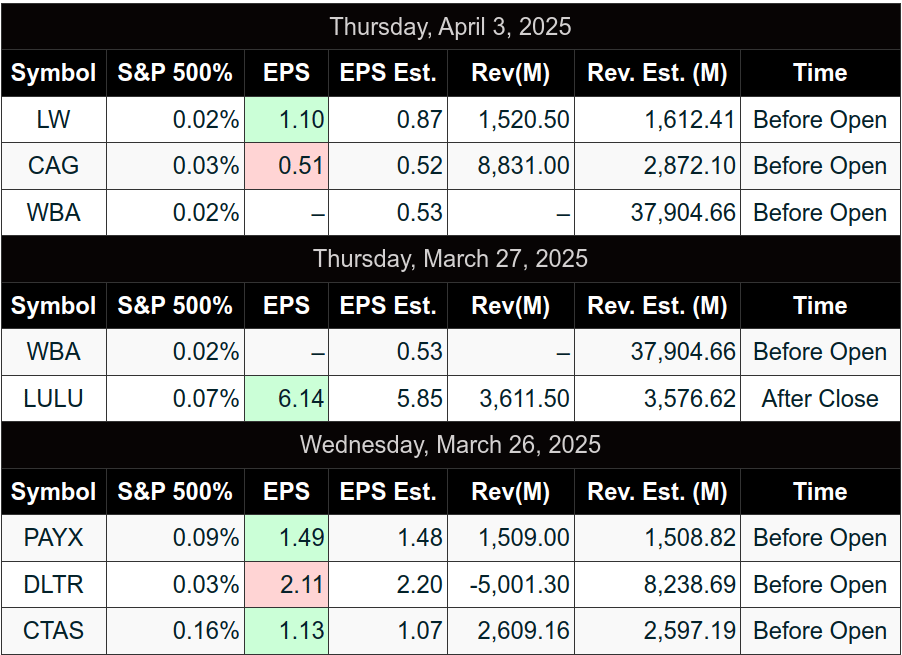
Earnings:

Affiliate Disclosure: This newsletter may contain affiliate links, which means we may earn a commission if you click through and make a purchase. This comes at no additional cost to you and helps us continue providing valuable content. We only recommend products or services we genuinely believe in. Thank you for your support!
Disclaimer: Charts and analysis are for discussion and education purposes only. I am not a financial advisor, do not give financial advice and am not recommending the buying or selling of any security.
Remember: Not all setups will trigger. Not all setups will be profitable. Not all setups should be taken. These are simply the setups that I have put together for years on my own and what I watch as part of my own “game plan” coming into each day. Good luck!!
Follow @MrTopStep on Twitter and please share if you find our work valuable!
This post goes out as an email to our subscribers every day and is posted for free here around 2 PM ET. To get your real-time copy, sign up for the free or premium version here: Opening Print Subscribe.
Comments are closed