This post goes out as an email to our subscribers every day and is posted for free here around 2 PM ET. To get your real-time copy, sign up for the free or premium version here: Opening Print Subscribe.
Lean for the Close: How Dboy Nailed the 50-Point Rally in Real Time
Follow @MrTopStep on Twitter and please share if you find our work valuable!
Our View
At 1:30 p.m. yesterday, the ES was stuck in a 36.5-point range from 5656.50 down to 5620.00. Volume was a mere 688K contracts traded.
After some flip-flops and just before the Fed, the ES and NQ started selling off and made a new low of 5596. Then, it rallied up to the 5650 level after Powell emphasized the uncertainty surrounding U.S. trade policy and the economic implications, while saying the central bank is in a good position to let the situation evolve before taking any action. Risks to growth “haven’t materialized yet,” and “we can afford to be patient.”
This really is insane. The ES sold off going into 3:30, and then a Trumper headline came out while I was LIVE on Twitter telling people to get long on the close.
IMPRO:Dboy (3:38:08 PM): PAID 5627.75 ON 4 ES
Seconds later, the ES rallied almost 50 points and the NQ rallied about 100 points in 3 minutes time
IMPRO:Dboy (3:42:30 PM): flat 5658
(3:42:54 PM): BREAKING: Trump to rescind global chip curbs amid AI restrictions debate.
I had no idea what was going on, but all too many times I’ve seen a big, quick jerk one way only to end up going the other—and it did. The ES sold back off down to the 5644 area. The news was the highlight of the day, especially for me.
The news was particularly good for NVDA, which rose by 3.09%, closing at $117.06. Below are the net changes for the Magnificent 7 stocks from yesterday’s close. Not all fared as well—GOOG closed down $11.85.
-
Apple (AAPL): -2.26
-
Microsoft (MSFT): +0.04
-
Alphabet (GOOGL): -11.85
-
Amazon (AMZN): +3.70
-
Nvidia (NVDA): +3.52
-
Meta (META): +9.50
-
Tesla (TSLA): +0.87
The weakness in Google was primarily due to a report that Apple may add AI search capabilities to its Safari browser, potentially replacing standard search engines like Google. Also, Eddy Cue’s testimony during the Justice Department’s lawsuit against Alphabet—mentioning plans to integrate AI services from OpenAI, Perplexity, and Anthropic—raised concerns about Google’s search business, a core revenue driver.
Our Lean
This morning we have Initial Jobless Claims and U.S. Productivity at 8:30 a.m., and Wholesale Inventories at 10:00 a.m. Reporting earnings today are Toyota Motor Corp, Anheuser-Busch InBev SA, Shopify Inc, ConocoPhillips, Nintendo Co Ltd, McKesson Corp, Brookfield Corp, and Monster Beverage Corp.
Our lean: Pitbull called me last night and said he heard that Trump was going to call a press conference today at 10:00 to discuss trade deals, and the ES rallied up to 5684.50. Again, just like yesterday’s session, the index market rallied before the headline hit the tape. I’ve never seen so much front-running. I think I should join Truth Social to get the headlines faster.
I said I was looking for a two-day decline, and we got it. I said the ES needed some lower back-and-fill, and we got that too. I think we are stuck in a 5600–5700 trading range, with 5650 being my swing level. My lean is for higher prices. If we don’t rip today, then we should be looking for the Thursday low before week 2 options expiration.
From last night’s Globex session:
IMPRO:Dboy (8:30:54 PM): I think we are at the crossroads
IMPRO:Dboy (8:31:16 PM): my gut says we are going back up
IMPRO:Dboy (8:31:39 PM): the Handle stats were clear
IMPRO:Dboy (8:32:06 PM): most of the pullbacks after a 9-day run were small and over 2 days
MiM and Daily Recap
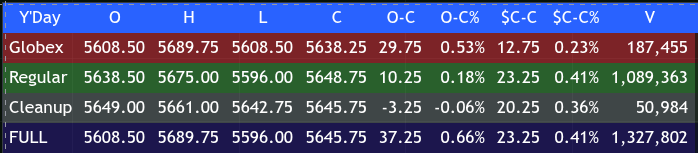
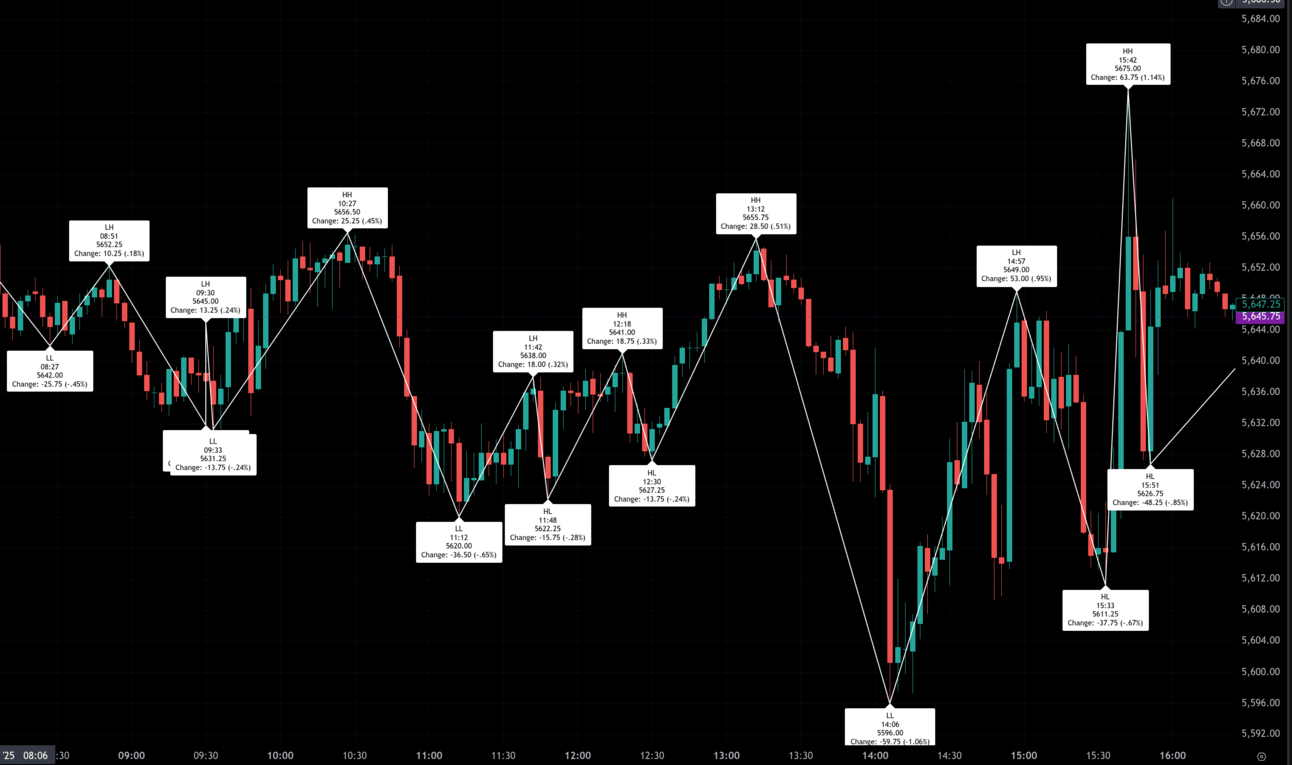
The S&P 500 futures (ES) opened the cash session at 5638.50 following an overnight lift from the Globex low of 5608.50. Early trading showed some chop, as the market climbed to an initial high of 5652.25 at 8:51 AM before pulling back sharply to 5644.00 at 9:22 AM. That -25.75-point retracement (-0.45%) set the tone for continued two-way action into the open.
After the regular session began at 9:30 AM, the ES put in a minor bounce to 5645.00 before resuming its descent to the morning’s first regular session low of 5631.25 by 9:33 AM. The bulls attempted a rebound that took price up to 5656.50 by 10:27 AM, registering a strong 25.25-point gain (+0.45%), but this move failed to gain traction. Selling resumed, pulling the market down to 5620.00 at 11:12 AM—a steep 36.50-point drawdown from the morning high.
Midday action was dominated by stair-stepping rallies. Price reached 5638.00 by 11:42 AM, then retraced to 5622.25 at 11:48 AM before staging a fresh up leg into 5641.00 at 12:18 PM. After another pullback to 5627.25 by 12:30 PM, the ES rallied again, peaking at 5655.75 at 1:18 PM. However, that strength quickly reversed in the early afternoon as the market tumbled to its regular session low of 5596.00 by 2:06 PM—a nearly 60-point move (-1.06%) off the high.
From that base, the ES surged nearly vertically into the 3:00 PM hour, reaching 5649.00 at 3:47 PM only to turn around and sell 37.7 points to a low at 3:33 PM. Not done for the day the bull left their mark on the session high and a dramatic 63.75-point (+1.14%) reversal off the low. But the strength didn’t hold. A harsh drop to 5626.75 at 3:51 PM erased 63.75 points (-1.14%) before a shallow bounce capped out at 5648.75 into the 4:00 PM close.
The regular session ended at 5648.75, up 10.25 points from the open, a modest +0.18% gain. From Tuesday’s 5625.50 cash close, ES settled higher by 23.25 points or +0.41%.
The tone of Wednesday’s trade was indecisive, marked by sharp reversals and failed breakouts. Although the market posted gains during both Globex and regular hours, much of the session was dominated by failed rallies followed by abrupt downside flushes, culminating in a violent late-day range expansion.
Volume was solid with 1.09M contracts traded during the regular session and total full-day volume reaching 1.32M. The most aggressive buying came during the 2:00 PM to 3:00 PM hour as ES rocketed off its lows. However, this strength was undercut by heavy sell imbalances into the close.
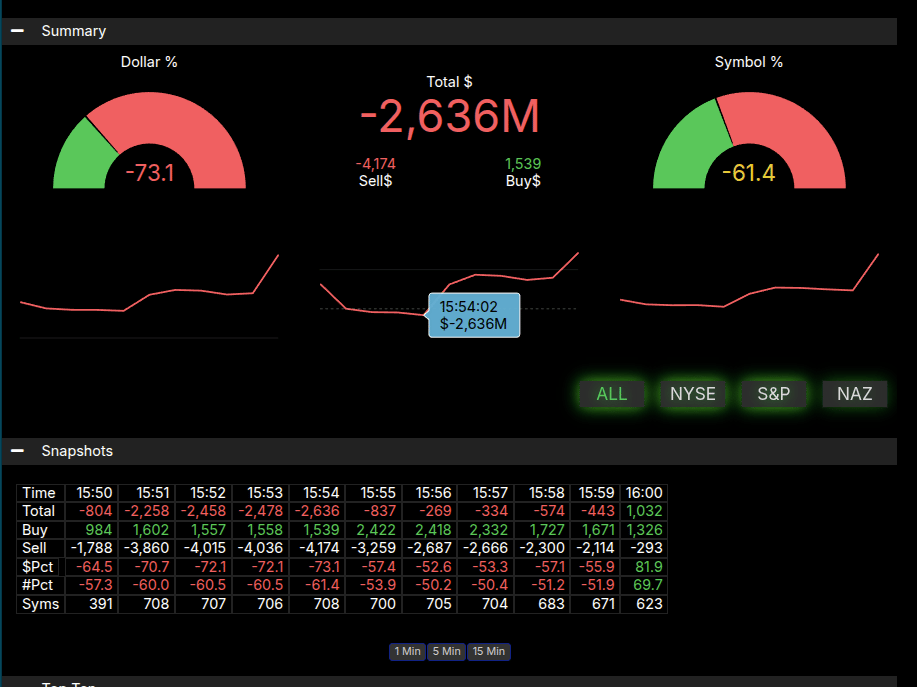
Market-on-Close (MOC) data reflected a severe -73.1% sell-side imbalance by dollar value and a -61.4% skew in symbols, with $2.636B net to sell hitting at 3:54 PM. This extreme imbalance (>66%) clearly pressured prices into the final 30 minutes, dragging ES down from its 5675.00 peak to close near 5645.75. The late-day fade was closely aligned with the MIM signals, further confirming that institutional selling defined the session’s closing tone.
Despite the positive session-over-session close, the strong sell imbalance and intraday volatility suggest underlying weakness, and the inability to hold above the 5670 area leaves short-term direction in question heading into Thursday’s trade.
Technical Edge
Fair Values for May 8, 2025
-
S&P: 18.33
-
NQ: 79.13
-
Dow: 82.19
Daily Breadth Data 📊
For Wednesday, May 7, 2025
-
NYSE Breadth: 54% Upside Volume
-
Nasdaq Breadth: 58% Upside Volume
-
Total Breadth: 56% Upside Volume
-
NYSE Advance/Decline: 62% Advance
-
Nasdaq Advance/Decline: 54% Advance
-
Total Advance/Decline: 58% Advance
-
NYSE New Highs/New Lows: 58 / 39
-
Nasdaq New Highs/New Lows: 78 / 123
-
NYSE TRIN: 1.43
-
Nasdaq TRIN: 0.83
Weekly Breadth Data 📈
For the Week Ending Friday, May 2, 2025
-
NYSE Breadth: 59% Upside Volume
-
Nasdaq Breadth: 69% Upside Volume
-
Total Breadth: 65% Upside Volume
-
NYSE Advance/Decline: 72% Advance
-
Nasdaq Advance/Decline: 67% Advance
-
Total Advance/Decline: 70% Advance
-
NYSE New Highs/New Lows: 96 / 72
-
Nasdaq New Highs/New Lows: 215 / 216
-
NYSE TRIN: 0.83
-
Nasdaq TRIN: 0.86
Guest Posts:
Dan @ GTC Traders
Chip Management in the Current Macro Environment

At GTC Traders, we make it a habit of knowing what we don’t know.
I say this because from 2005 to 2010, I actually covered the global shipping sector fairly deeply. I tracked Baltic indices, followed dry bulk carrier dynamics, learned about charter rates, newbuild deliveries, scrappage rates, vessel age profiles, all of it.
But the truth of the matter is that I’ve been out of the shipping sector for over a decade now.
And when you’ve been out of a sector like this for that long? You realize you’re no longer qualified to offer the kind of in-depth, nuanced analysis that the topic deserves. Shipping is deep. It’s not just about oil tankers or container ships — it’s a world of Capesize, Panamax, Supramax bulkers, VLCCs, Aframaxes, specialized chemical tankers, LNG carriers. Port automattion, spot rates, TEU’s, and much more. Each segment has its own supply/demand balance, its own quirks, its own players.
Due to the situation with tariffs, there are justifiable concerns regarding inflation. As 2020-2021 taught us … when supply chains are interrupted .. there can be long-term inflationary effects. So it does us well to qualified, unbiased analysts.
And what they’re saying right now is worth paying attention to.
Right now, the shipping sector is dealing with a lot of front-loading. What does that mean? Simply put, when companies anticipate tariffs or other trade restrictions, they rush to import goods before those restrictions hit. This front-loading leads to a temporary surge in shipping demand — ports get clogged, containers become scarce, and prices (freight rates) spike. But here’s the key: once the goods have been rushed in, you can get a sudden drop in demand because businesses have already stocked up. So,front-loading creates a kind of artificial demand spike, followed by a dip.
U.S. importers have been rushing goods in from China ahead of anticipated tariffs. Container throughput at the Ports of Los Angeles and Long Beach surged in February and March, reflecting this wave of early shipments. Bookings … which are forward-looking indicators of shipping demand … are already showing a noticeable decline heading into late spring and summer.
In other words, after the sugar rush of front-loading, we’re entering a digestion phase.
But here’s the tricky part: data lags. Shipping data, like most economic data, comes in with a delay. And even when it arrives, a few weeks or months of data aren’t always enough to make a strong call. We would caution against reading too much into the recent dip just yet. A slowdown over a few weeks doesn’t necessarily signal a broader contraction or downturn — it might just be the normal unwind of the front-loading wave.
So what’s the bigger takeaway?
While we may have had temporary supply gluts from the front-loading, the underlying picture is still one of potential strain. If tariffs bite hard or geopolitical tensions escalate, you can quickly swing from overstocked inventories to output gaps. For those unfamiliar with the term, an output gap refers to the difference between actual production and potential production — basically, it’s when the supply chain can’t meet demand. And that’s where inflationary pressures can resurface.
Remember, in 2021, the big inflationary wave didn’t come solely because consumers were spending like crazy (though they were) from loads of cash they had just been handed. It was also because the global supply chain — from semiconductors to lumber to shipping containers — was struggling to keep up. That combination of strong demand and constrained supply is what sets the stage for inflation.
Right now, we’re not quite back in that spot. In fact, we’re seeing a temporary cooling-off as the front-loaded goods work their way through the system. But in the medium term? I believe we need to stay vigilant.
I want to emphasize that, as traders, it’s not our job to predict the future nine months out. I’ve said this many times, but I’ll say it again: our focus is on understanding where we are right now — what mathematicians call initial conditions. We can argue about future projections all day, but if we don’t even have a clear picture of the present, those projections are meaningless. And right now, the picture is murky.
We need more time, more data, to know if this dip is the start of something bigger or just a normal rebalancing after the tariff-driven surge. That makes sense to me.
From a trading perspective, the key is to understand the environment we’re in. You don’t have to become a shipping expert overnight — but you do need to know when the environment is shifting in ways that could ripple out into other markets: inflation, consumer prices, corporate earnings, global growth.
Be safe, stay curious, and trade well.
Trading Room News:
Polaris Trading Group Summary: Wednesday, May 7, 2025
Yesterday’s trading session was largely driven by anticipation of the afternoon Federal Reserve decision, creating a cautious and narrow overnight range heading into Cycle Day 3. PTGDavid identified the Line in the Sand at 5670, with early price action drifting lower into the 5655–5645 target zone, confirming bearish pressure to start the day.
Key Trade Highlights & Lessons:
-
Early Action:
-
The initial range was quiet, with David noting the need for bulls to “Clear & Convert” the 5650–55 zone to have a chance at pushing to the 5670–75 range.
-
The CL Open Range Short was a standout trade, with two targets hit and trailing stops executed, highlighting excellent trade structure and discipline.
-
-
Midday Shift:
-
As bulls failed to hold ground, David called a timely flip to sell-side bias, capitalizing on breakdowns below 5638 OPR mid.
-
Multiple images and trade insights were shared, supporting the technical narrative and reinforcing the importance of staying adaptable.
-
-
FED Volatility:
-
With a 99% expectation of no rate change, the Fed announcement still brought its typical “shenanigans.” Price whipsawed amid Powell’s “uncertainty” rhetoric, triggering a lot of humorous and sharp commentary from the room.
-
Targets including 5605, 5595, and 5584 were floated as downside levels, and price action hit several of these during the post-FED flush.
-
-
End-of-Day Activity:
-
Despite heavy selling, PTGDavid noted absorption near close and a flip in the MOC imbalance from sell to buy side, suggesting institutions stepped in.
-
Positive 3-Day Cycle stats were achieved, and David is eyeing a “dip-and-rip” setup for Thursday (Cycle Day 1).
-
Community & Education:
-
Slatitude39 shared appreciation for David’s educational video on “Techniques in Probability Thinking” and brought humor and camaraderie, alongside active chat participants like Bruce F, blibby71, and Raja.
-
The discussion of risk, psychology, and Powell’s ambiguous messaging reinforced key lessons on staying grounded and reactive, not predictive during macro events.
Takeaway Lesson:
Stay nimble and let the market dictate bias. Timely flips from long to short bias, clear technical zones (like 5650–55 and 5638), and respecting the unpredictable nature of FED days were crucial to managing trades effectively today.
DTG Room Preview – Thursday, May 8, 2025
-
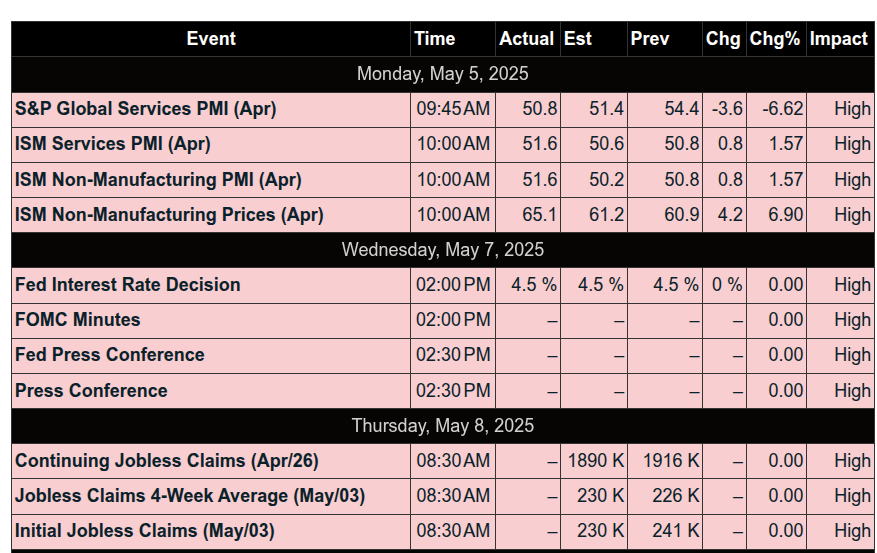
Fed Holds Steady: The Federal Reserve unanimously decided to maintain current interest rates, brushing off pressure from Trump for cuts.
-
Trump Policy Shifts: Announcements from the Trump administration include plans to rescind Biden-era AI chip export rules and cut 2,300 positions across financial regulatory agencies, prompting internal reshuffling.
-
Trade Developments: Trump teased a “major trade deal” expected with the UK; a press conference is set for 10:00 AM ET. Despite speculation, no easing on China tariffs is expected.
-
Earnings Watch: Premarket names include SHOP, WBD, BUD, CVE, TAP, and more. Key post-market earnings: COIN, MCK, DKNG, MNST, PINS, and TOST.
-
Economic Data: Focus on Unemployment Claims, Nonfarm Productivity, Unit Labor Costs (8:30 AM ET), and Wholesale Inventories (10:00 AM ET).
-
Market Technicals: ES remains in a sideways consolidation within short-term uptrend channels. Key support at the 50-day MA (5596.50) remains active. Resistance levels seen around 5849/54s; support zones at 5562/67s and lower levels.
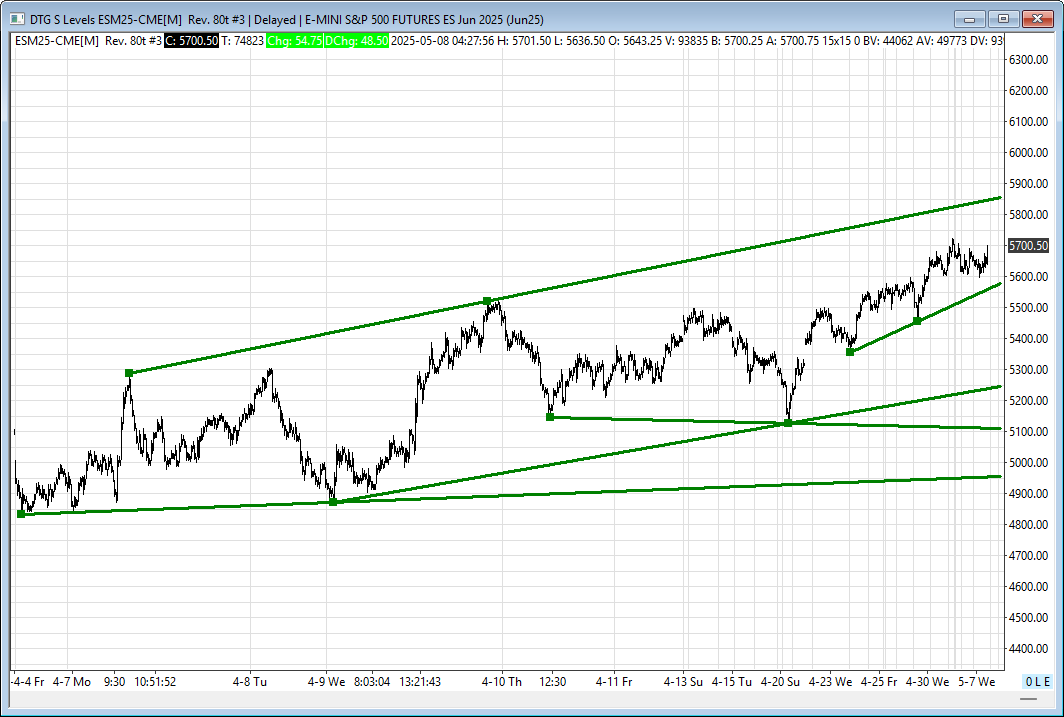
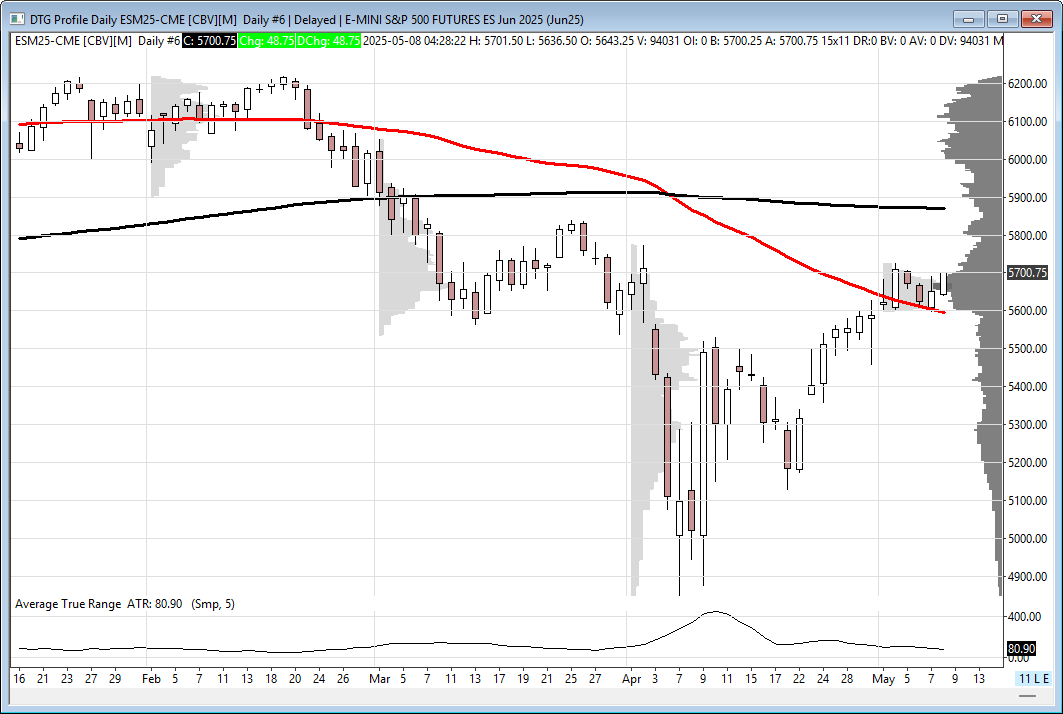
ES
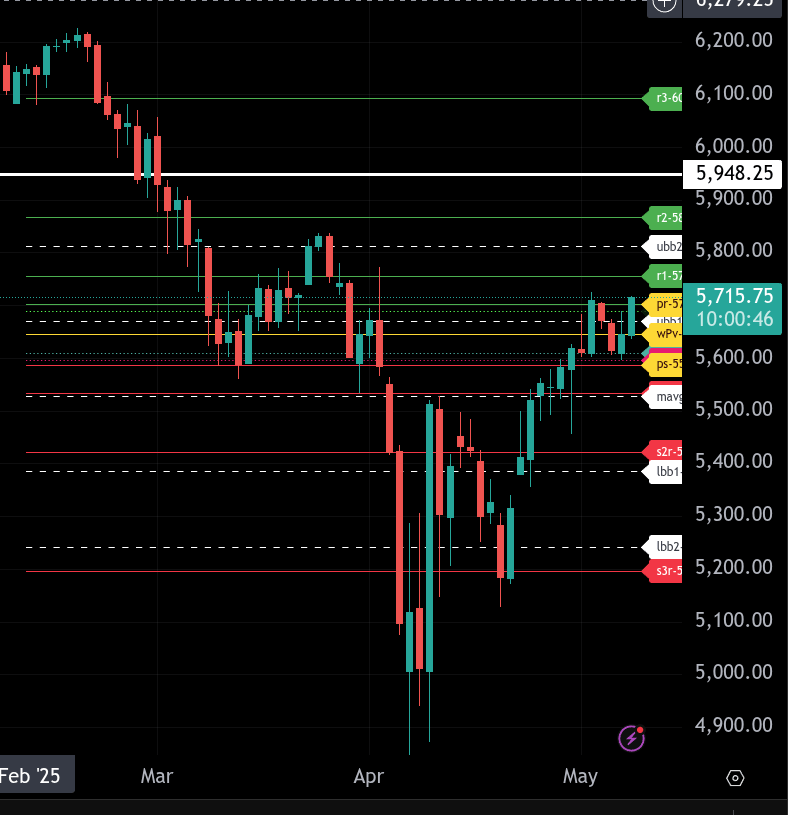
The bull/bear line for the ES is at 5644.50. This is the key pivot that must be held for bullish continuation. A sustained move above this level keeps the buyers in control, while a failure below shifts momentum back to the sellers.
Currently, ES is trading at 5716.00, well above the bull/bear line, indicating bullish sentiment heading into the session. The next upside level is 5755.75, followed by the upper bb target at 5811.75. If ES can clear these levels, it would confirm strength and continuation of the uptrend.
On the downside, first support lies at 5669.50, followed by the bull/bear line at 5644.50. A break back below 5644.50 would target the lower range support zone, with 5608.50 and then 5587.25, the lower range target. Lower values are at 5533.50, which aligns closely with the 20-day moving average at 5527.00.
In summary, as long as ES holds above 5644.50, the path of least resistance remains higher with eyes on 5755.75 and 5811.75. A failure below 5644.50 opens the door to 5608.50 and eventually 5533.50.
NQ
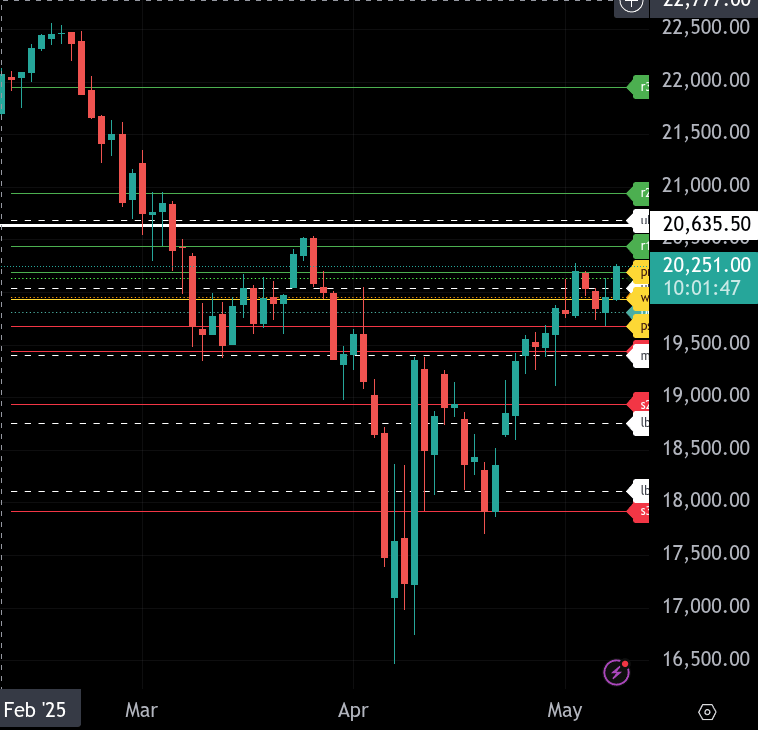
The bull/bear line for the NQ is at 19,937.00. This is the pivot level (wPv) that must be regained for bulls to reassert control. Price is currently trading above it at 20,249.00, showing early strength in the Globex session.
Above the bull/bear line, initial resistance comes at 20,194.80, the upper intraday range target. A sustained move through this level opens the door to 20,437.30 and then 20,682.50, where the ubb2 level aligns with a previous high zone. Beyond that, the upper resistance band caps out at 20,937.50.
On the downside, if NQ fails to hold above 19,937.00, the lower range target sits at 19,679.30. Continued pressure could push price to test support at 19,436.80, where s1 and the key moving average at 19,397.00 converge — making this a pivotal demand zone.
As long as NQ holds above 19,937.00, bias remains cautiously bullish, with potential to test higher value zones. A breakdown back below this level would shift the tone to bearish intraday. Intraday traps or reversals around the 18,600.00 zone if volatility picks up.
Calendars
Economic Calendar Today
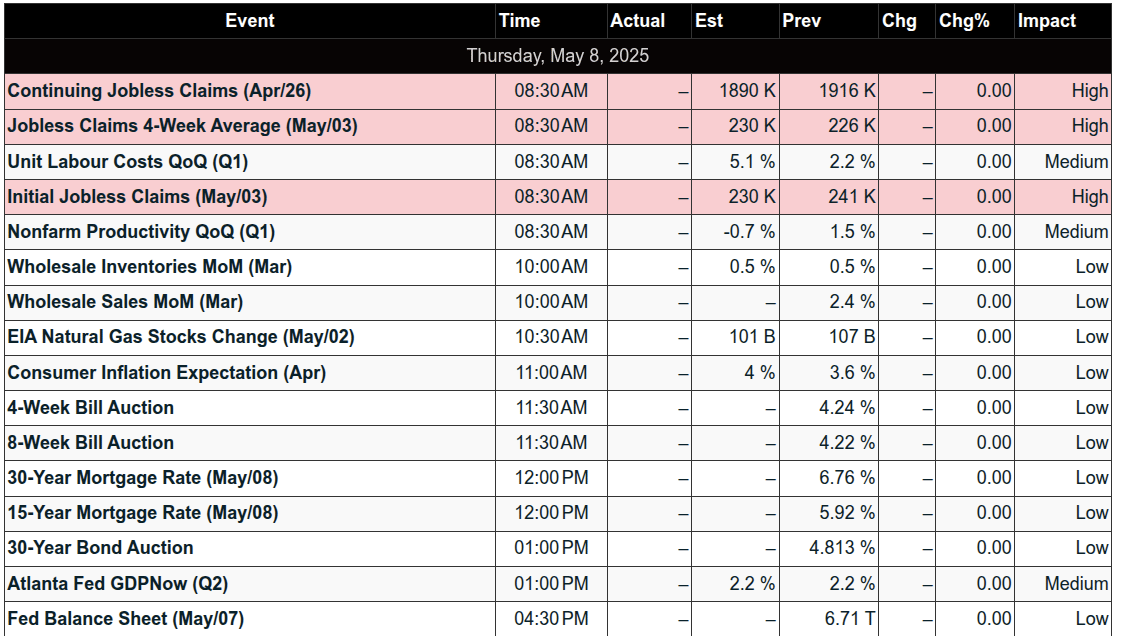
This Week’s High Importance
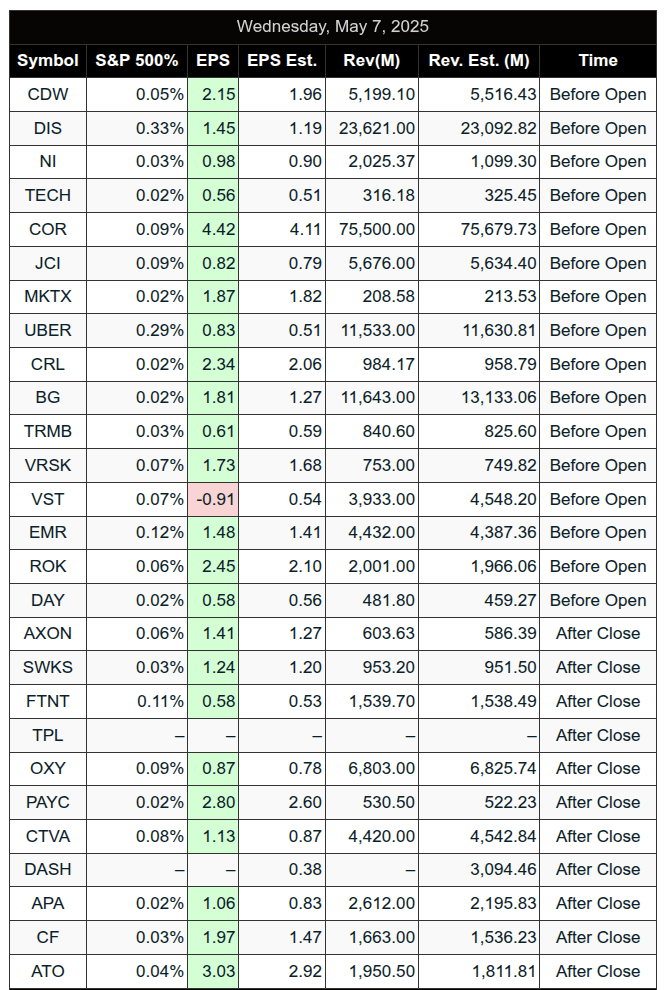
Earnings:
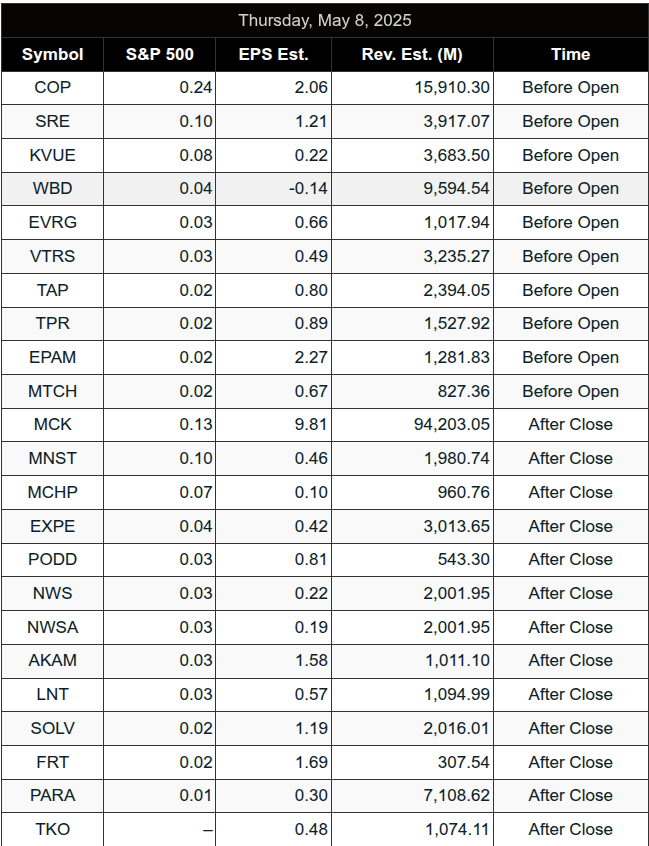
Released
Affiliate Disclosure: This newsletter may contain affiliate links, which means we may earn a commission if you click through and make a purchase. This comes at no additional cost to you and helps us continue providing valuable content. We only recommend products or services we genuinely believe in. Thank you for your support!
Disclaimer: Charts and analysis are for discussion and education purposes only. I am not a financial advisor, do not give financial advice and am not recommending the buying or selling of any security.
Remember: Not all setups will trigger. Not all setups will be profitable. Not all setups should be taken. These are simply the setups that I have put together for years on my own and what I watch as part of my own “game plan” coming into each day. Good luck!
This post goes out as an email to our subscribers every day and is posted for free here around 2 PM ET. To get your real-time copy, sign up for the free or premium version here: Opening Print Subscribe.
Comments are closed