This post goes out as an email to our subscribers every day and is posted for free here around 2 PM ET. To get your real-time copy, sign up for the free or premium version here: Opening Print Subscribe.
Record $2.8 Trillion May Options Expiration
Follow @MrTopStep on Twitter and please share if you find our work valuable!
Our View
I was looking for two down days and got one and a half. Part of the reason the ES and NQ are holding up so well: Wednesday’s 3:50 imbalance was $5.7 billion to buy, and yesterday’s was $6 billion to buy — a total of $11.7 billion bought in the last two sessions. The other reason is the record call open interest going into today’s May expiration.
After an early drop down to 5867, the ES made a higher low at 5884.50 and rallied all the way up to a new all-time high at 5944.50 as billions were put to work on the close.
Record-Breaking Expiration: May 16, 2025
-
The May 2025 options expiration is expected to be the largest on record in terms of notional value, with over $2.8 trillion of options expiring on May 16th.
-
This includes $1.2 trillion of S&P 500 (SPX) options and $580 billion of single stock options.
-
The high volume is attributed to increased options trading among retail investors and the S&P 500’s significant gains over the past year.
-
Goldman Sachs noted that the notional value of expiring options represents 4.6% of the Russell 3000 market capitalization, the highest relative size for a May expiration since 2017.
No one knows for sure how today’s options expiration will go, but one would think with nearly $12 billion bought on the last two closes, some of the short calls are hedging or getting out. The ES is up 1,125 points off its April low, the NQ is up over 5,000 points off the low and just 1,200 points off its year high, and the YM has recovered 5,900 of the 8,400 points it lost from the high. It was a quick, vicious down move, but it’s been an even faster up move.
JPMorgan strategists think that the reason the markets have run out of steam is due to investor fatigue, combined with elevated equity positions by stock-focused funds, which could lead to less upside for equities. Well, that is nothing new. The higher the markets go, the less volume there is. It was only last month that the daily volume in the ES was between 2.5 million and over 3 million contracts traded per day. Yesterday, it was 1.22 million.
The other thing about the low volume: despite the ES being up so much, it looks like 20 to 30 handle pullbacks are big right now. I think the reason for that is the record May expiration short calls have been hitting collars on the way up, and every time they do, they buy futures or SPX calls. When I say “they,” I mean the auto-execution and hedging bots.
Our Lean
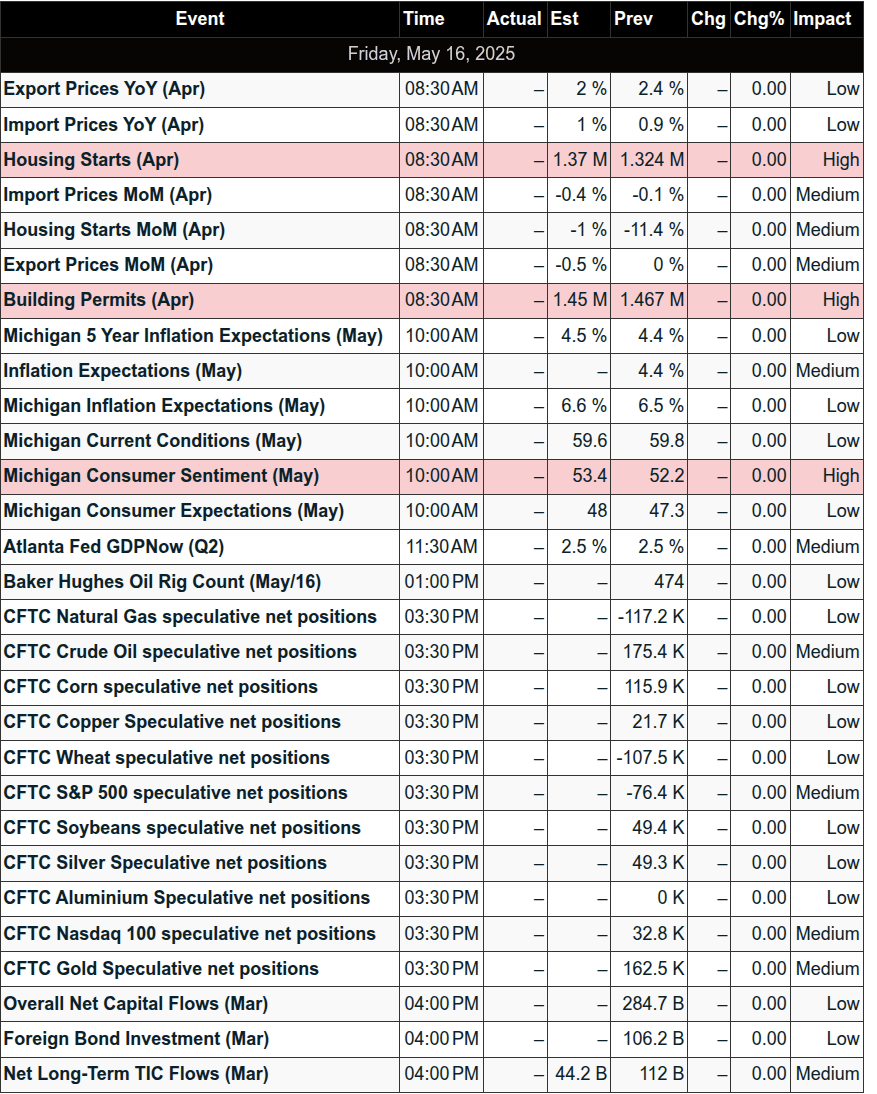
We have four economic reports this morning: Import/Export Prices, Housing Starts, and Building Permits at 8:30, and Consumer Sentiment at 10:00. I think there will be a lot of two-way price action.
Our lean: If the ES is down early, my lean is to buy it. If the ES is higher, wait for a good pullback to buy — both early and late. There could be a good setup for a late 0DTE trade.
The levels I am looking at:
Support: 5922, 5909, 5903, 5884, 5867, 5850, 5838
Resistance: 5945, 5970, 5983, 6000, 6022
Here’s a Goldman Article that a good read:
US stocks are forecast to rally amid China tariff discussions
US stocks are expected to rally in the coming months as the Trump administration overhauls the country’s tariff policy with its largest trade partners.
The S&P 500 Index fell in early April after the US government announced sweeping “Liberation Day” tariffs, but the index has rallied since then amid delays on the import taxes and signs of progress on trade-policy negotiations. China and the US agreed last weekend to reduce duties for 90 days amid ongoing trade discussions.
“Investors have generally embraced the view that there’s an off ramp for some of these hefty tariffs,” David Kostin, chief US equity strategist in Goldman Sachs Research, says in an episode of Exchanges. “I think that largely is priced in the market.”
MiM and Daily Recap
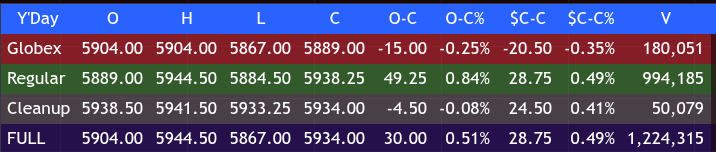

Thursday’s ES regular session opened at 5889.00 following a soft overnight Globex close, down 15.00 points from the previous day’s settlement. Globex marked its low at 5867.00 around 5:00 AM ET. From there, bulls quickly regained footing and initiated a morning rally that lifted ES to 5899.00 at 9:30 AM opening bar, a 32.50-point climb from the low.
A brief pullback followed, bottoming at 5884.50 by 9:45 AM, shaving off 14.00 points (-0.93%) from the opening peak. But the dip was bought aggressively, and a sharp rally resumed, propelling ES to 5944.50 by 13:20 – a 60-point intraday swing off the 9:45 low and the high tick for the day.
The afternoon session saw some volatility emerge. A retracement to 5921.25 occurred at 14:20 PM, shedding 23.25 points (-0.39%) from the peak. After a mild bounce to 5937.75 at 14:35 PM, the market took another leg down to 5917.50 by 15:25 PM. Still, bulls managed to lift the tape one final time into the close, peaking at 5941.50 by 16:00 PM.
The regular session settled at 5938.25, up 49.25 points or +0.84% from the day’s open and up 28.75 points (+0.49%) from the prior day’s 5909.50 close. The cleanup session dipped slightly, with a final tick at 5934.00. Total daily range spanned 77.50 points, with the session low of 5867.00 and high of 5944.50.
Volume was concentrated in the regular session with 994,185 contracts traded, contributing to a full-day total of 1.22 million.
The tone was broadly bullish, with strong participation throughout the day and a persistent appetite to buy dips. The early Globex weakness was swiftly reversed at the cash open, suggesting buyers were waiting for regular session liquidity to step in. The rally into a new all-time high at 5944.50 reflects continued institutional demand and ongoing positioning ahead of Friday’s massive May options expiration.
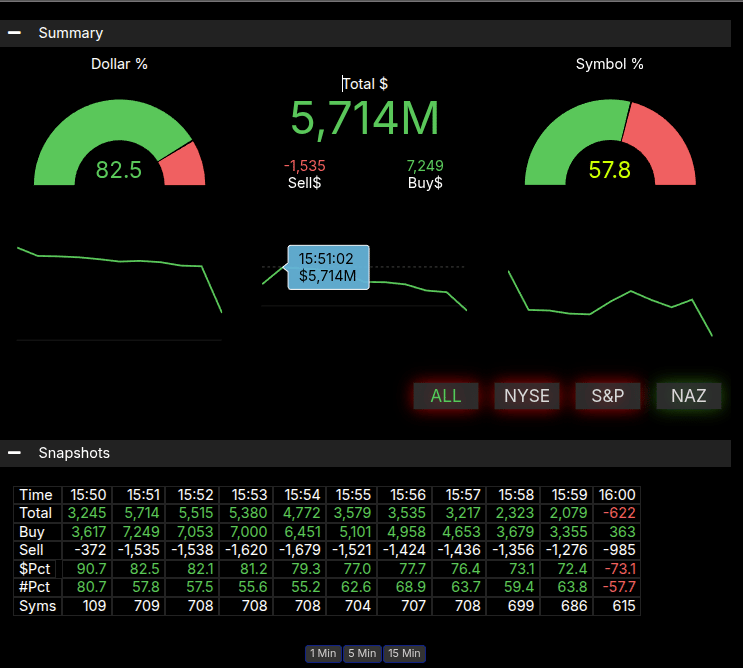
Contributing to the upside momentum was a significant Market-on-Close imbalance: $5.7 billion to buy, which helped anchor the afternoon rebound and supported price into the closing bell. While the dollar imbalance was clearly skewed toward buyers (82.5%), the symbol imbalance finished at 57.8%, below the 66% strong bias threshold, suggesting broad-based buying but not concentrated enough to register as extreme.
The May 15 session extended the bullish trend, printing yet another recovery high. With heavy options open interest expiring Friday and a large notional roll ahead, positioning dynamics may dominate the next tape. The strong close and persistent demand into the auction suggests bulls retain control, though intraday volatility remains elevated.
Technical Edge
Fair Values for May 16, 2025
-
SP: 19.39
-
NQ: 81.92
-
Dow: 102.49
Daily Breadth Data 📊
For Thursday, May 15, 2025
-
NYSE Breadth: 57% Upside Volume
-
Nasdaq Breadth: 51% Upside Volume
-
Total Breadth: 54% Upside Volume
-
NYSE Advance/Decline: 65% Advance
-
Nasdaq Advance/Decline: 57% Advance
-
Total Advance/Decline: 60% Advance
-
NYSE New Highs/New Lows: 63 / 19
-
Nasdaq New Highs/New Lows: 121 / 117
-
NYSE TRIN: 1.62
-
Nasdaq TRIN: 1.32
Weekly Breadth Data 📈
Week Ending Friday, May 9, 2025
-
NYSE Breadth: 54% Upside Volume
-
Nasdaq Breadth: 56% Upside Volume
-
Total Breadth: 55% Upside Volume
-
NYSE Advance/Decline: 58% Advance
-
Nasdaq Advance/Decline: 49% Advance
-
Total Advance/Decline: 53% Advance
-
NYSE New Highs/New Lows: 141 / 110
-
Nasdaq New Highs/New Lows: 256 / 303
-
NYSE TRIN: 0.97
-
Nasdaq TRIN: 1.01
Guest Posts:
Get instant access to our partners’ real-time market data and insights not available anywhere else. Here is last night’s Founder’s note getting you ready for today’s market and explaining the constraints in yesterday’s market. – MrTopStep
Founder’s Note:
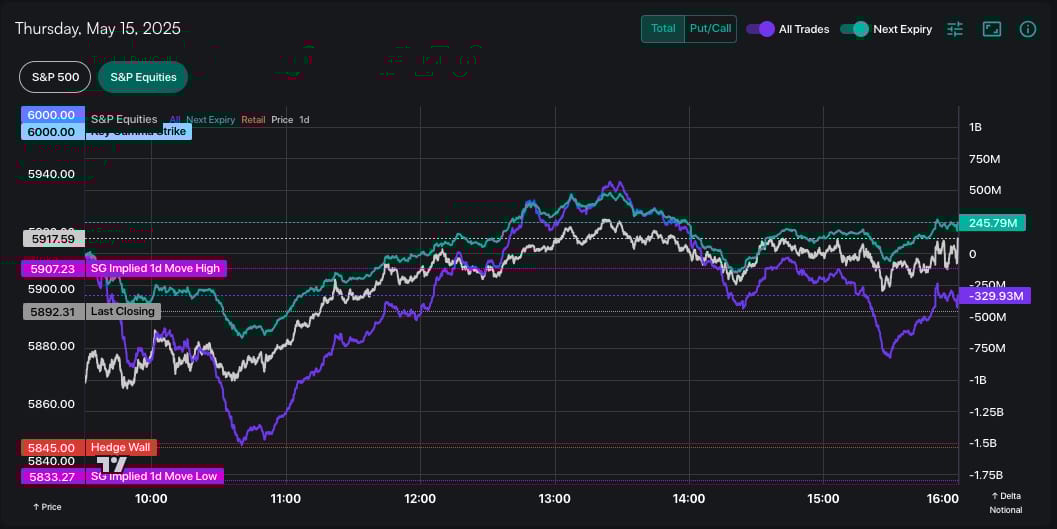
Equities pushed to fresh highs, with the SPX closing +51bps to 5,918 – with SPY 590 likely being the big draw. That +50bps on the day was +100bps from the 7AM lows, implying that 0DTE vols were too cheap today (SPX 0DTE straddle was quoted at 60bps). Today’s push higher closed the VIX at 2 months lows near 17.8.
The HIRO S&P equity basket was again very light ahead of tomorrows OPEX…
With S&P500 HIRO sharply negative on the day at -$3bn…so those options flows weren’t too bullish today – nor yesterday.
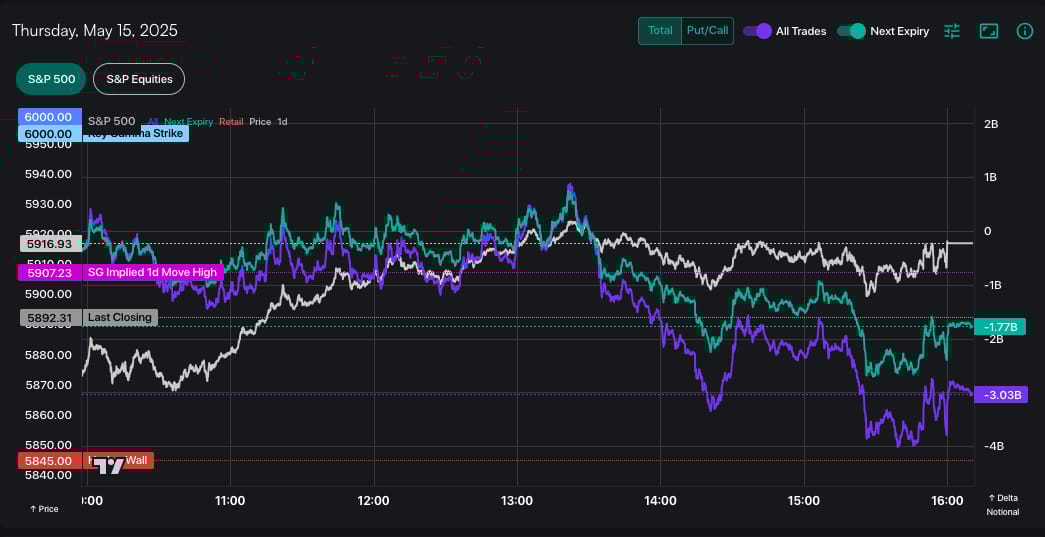
Ultimately we stand unchanged on our view – that we think the equity market is due for a pullback with tomorrows OPEX.
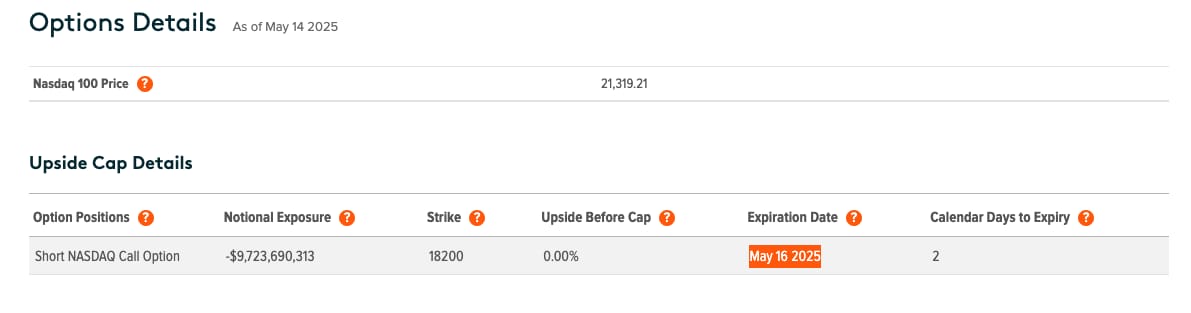
Turning to something a bit more interesting, yesterday was the first chunk of the QYLD roll. QYLD rolls NDX call sales each month, which they sell against a basked of Nasdaq stock holdings.
What follows here is a spur of the moment analysis, if you see something wrong/incorrect or have info to add then please contact me and I’ll publish a correction.
Specifically QYLD have had 4,200 of these contracts: May 16th Exp, 18,200 calls. They sold them near $500/per contract and they are now worth $3,200 – a cool ~$1.2 billion loss (nothing generates alpha like systematic call overwriting, AMIRITE!)…
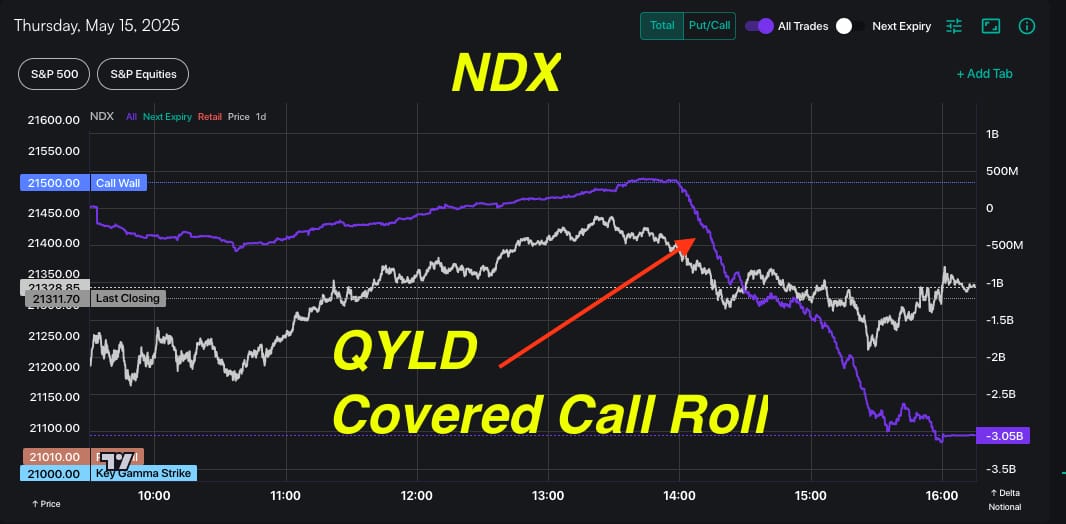
In NDX EquityHub:

HIRO clearly shows the trade taking place in an algorithmic fashion: piecing the 4k order out over several hours. The nuance here is that one would expect this to register as a BUY because this is QYLD covering their short May Exp calls – and they then sell June calls, tomorrow.
But – HIRO shows contracts being SOLD. And, note how the NDX declined from the start of that QYLD selling until the trade was closed. In theory we’d think QYLD has to sell some of their long stock to cover the losses from the short call.
If the prints took place at the midpoint, we’d have to flag HIROs logic as the likely problem here – and maybe thats the correct answer and we are seriously overdoing this analysis…and HIRO is reflecting an aggressive seller – maybe that is the market maker selling the contracts and that is the easiest “Occam’s Razor” explanation.
But we’re in too deep.
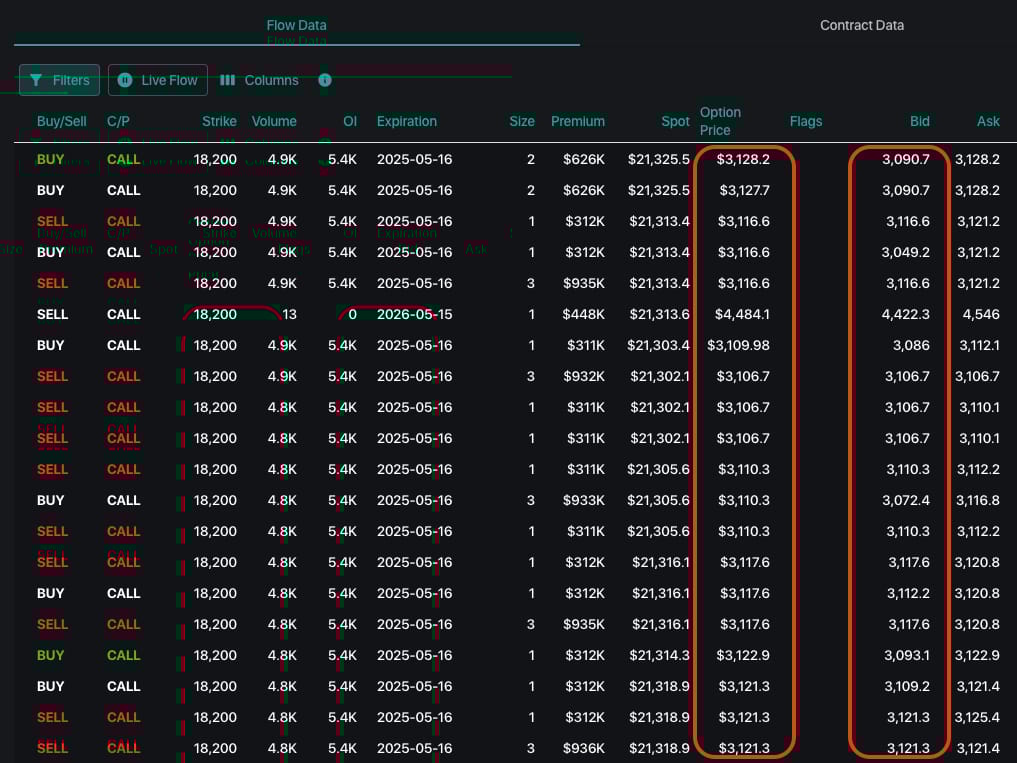
Arguing against the idea these were sales is that across hundreds of algo executions, you will see the trades largely took place on the bid. This is an algo just dribbling out orders on the bid, over and over again. Its true, that the NDX markets are quite wide, but these orders seem to cross that spread to drop $300-$600k in premium per contract – thats real money.
To be honest, we’re not entirely sure how to exactly piece this together. On one hand, we know that someone bought those calls from QYLD, and had a positive delta position of ~$6bn roll off today, and QYLD had some stock to sell to cover the contract.
The last piece is that the algos started to trade the 18,200 5/16 exp calls at 2:38 PM. The QYLD prospectus says they had 4,561 short calls as of 5/14, and a total of 4,862 traded today against open interest of 5,370.
Adding more, right on the open someone started to algorithmically BUY (lifting offers) the 5/15 (0DTE) 21,500 calls (which were +1% OTM), and they did so in 1-2 lots all day long until the market closed, for a total volume of 4,200 (starting OI was 214 contracts). Thats a very odd speculative bet to make, and smells a lot more like some type of way of working into a hedge as you possibly unwind a position.
So – what is the takeaway here?
-
HIRO clearly displayed that there was a big order in the market, and that timed with some NDX selling. That is the key goal here: show when options flows are impacting markets.
-
Given the timing and the contract seen in TAPE, we know it was the QYLD roll.
-
One would have suspected to see a clear HIRO buying of these calls, instead of selling. Our hypothesis here though is that, possibly due to the deep ITM nature of these calls, the roll was more complicated because QYLD had to sell stock in order to close up the deep calls against them. These factors, combined with the unique 0DTE activity, seems to support this thesis.
Get instant access to our partners real-time market data and insights not available anywhere else. Here is last night Founder’s note getting you ready for today’s market and explaining the constraints in yesterday’s market. – MrTopStep
Trading Room News:
Polaris Trading Group Summary – Thursday, May 15, 2025
Yesterday’s session was a textbook display of patience, strategy, and disciplined execution, led by PTGDavid. The day kicked off with price trading into a predefined lower target zone (5875–5865), which aligned well with the Daily Trade Strategy. It was Cycle Day 3, historically a strong day with an 89.65% success rate—an early bullish tilt in sentiment.
Morning Session Highlights:
-
A neutral open at LIS (5895) had the team cautious and waiting for directional clarity.
-
The first trade of the day was an A10 short, which hit target 1 and eventually went risk-free, showing early structure.
-
Key lesson: Bulls defending VWAP/LIS zone around 5890–5896 signaled a brewing reversal.
-
PTGDavid stressed emotional detachment and avoiding FOMO, emphasizing waiting for pullbacks above 5905 as confirmation.
Breakout & Trend Development:
-
Price broke above the prior close (5905), validating the long bias.
-
The breakout move hit the 5920 target—a major trade win for the room.
-
Later, 5930 was tagged, completing the full target zone from the Daily Strategy Briefing.
-
David’s note: “All the signs can be given…but the Trader Must Take the Trade.”—a reminder that signals are only as good as their execution.
Afternoon Action:
-
Bulls maintained pressure, hitting a day high of 5929, followed by a strong push toward the 10-ATR range target of 5958.68.
-
The Wabbit Hunt trade idea below 5922 played out for a quick +10 handle short, leveraging a reversal off the upper D-Level (5940).
-
These tactical shorts proved valuable before the Power Hour setup.
Power Hour & Close:
-
Price dipped into VWAP (5917) before executing a clean “Dip n Rip” move into the close.
-
A significant $6.1 billion MOC buy imbalance helped launch a final bullish move back toward 5938.
-
Although there was late-day slippage, the day still closed strong at 5938, a key reclaim level for bulls.
Key Takeaways & Lessons:
-
Patience and confirmation were emphasized repeatedly—traders waited for structure before jumping in.
-
Predefined targets (5920, 5930) based on D-Level and LIS proved highly reliable.
-
Wabbit Hunt and MOC Dip-n-Rip provided tactical trade opportunities beyond the primary trend.
-
Emotional control, especially during range-bound conditions, was reinforced as vital.
An overall strong, bullish day with multiple trade opportunities that rewarded patience, plan execution, and risk discipline. Well-led and well-traded by the PTG team!
DTG Room Preview – Friday, May 16, 2025
-
Tariff Impact Watch: Walmart warns of imminent price hikes on items like baby strollers, furniture, and toys due to U.S. tariffs. CFO Rainey notes these costs are too steep for retailers and suppliers to absorb.
-
Global Growth Downgrade: The U.N. cuts global growth forecast to 2.4% for 2025, citing trade-related uncertainty. The slowdown is expected to hit the world’s most vulnerable economies hardest.
-
Trade Policy Outlook: President Trump indicates upcoming individual tariff announcements for U.S. trading partners within 2–3 weeks, with ongoing talks involving Japan, South Korea, India, and the EU.
-
Earnings & Data: Watch for premarket earnings from Coca-Cola Europacific (CCEP) and RBC Bearings (RBC). Key economic reports at 8:30am ET include Building Permits, Housing Starts, and Import Prices; UoM sentiment data follows at 10:00am.
-
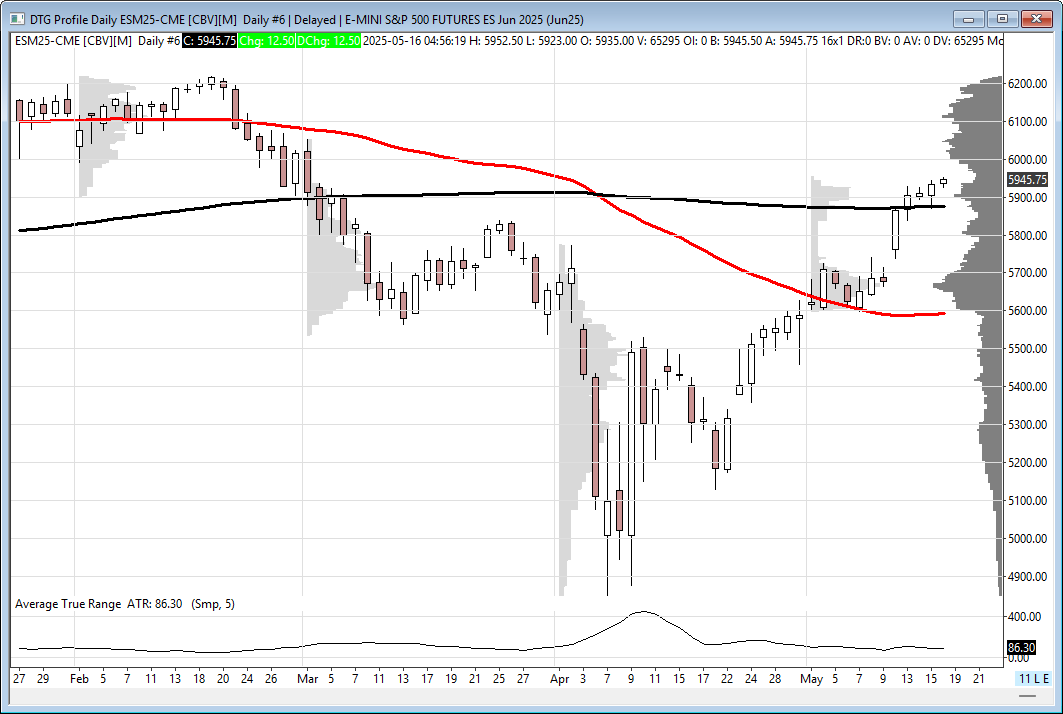
Market Technicals: ES volatility remains moderate-high with a 5-day average range of 91 points. Thursday’s LOD found support at the former uptrend channel top (5881–86) and the 200-day MA (5876.25), which remain key levels. No overnight whale activity detected.
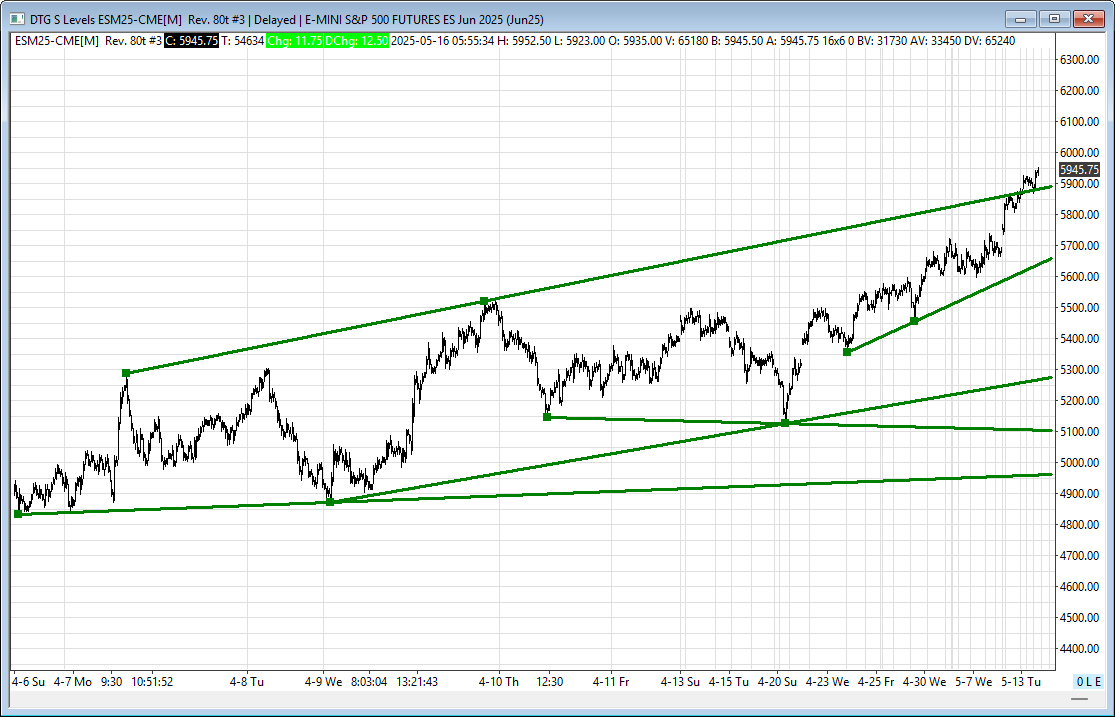
ES
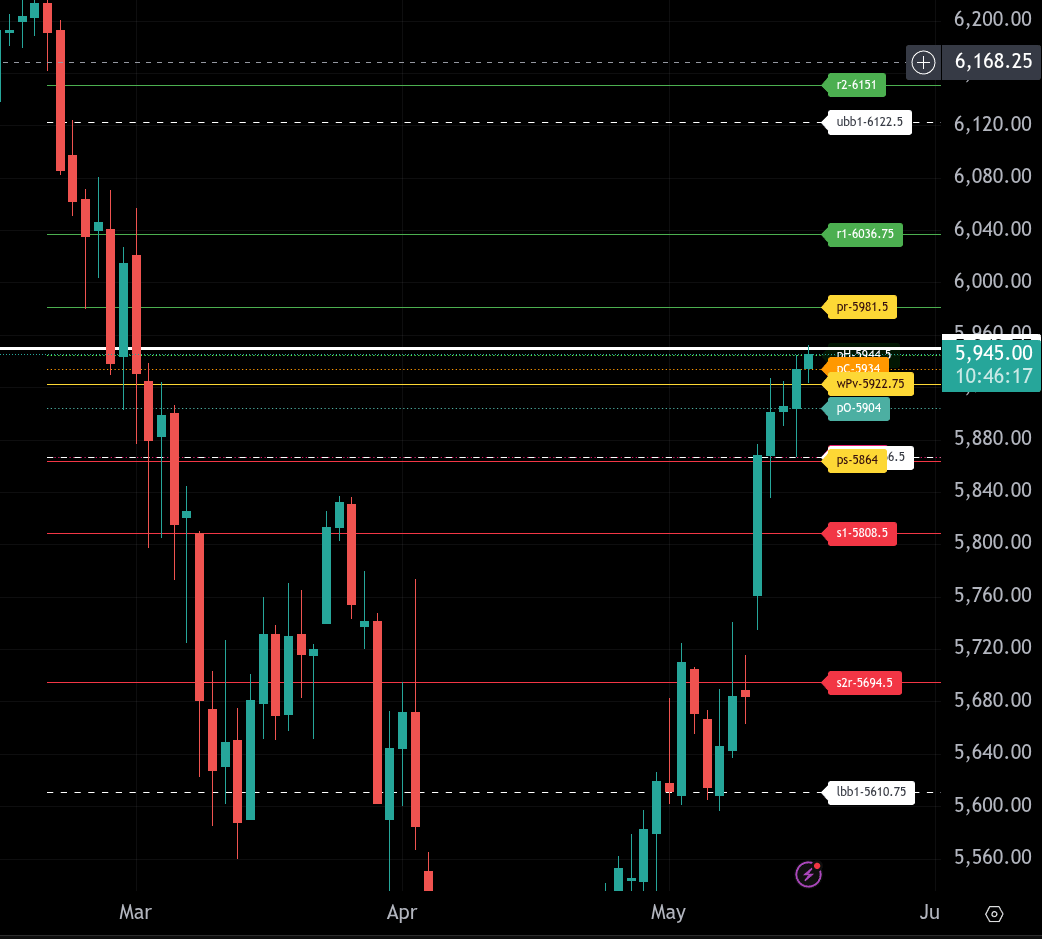
The bull/bear line for the ES is at 5922.75. This is the weekly pivot and must be held for continued upside momentum. Currently, ES is trading around 5949.75, showing strength above the bull/bear line. This keeps the bullish bias intact for now.
Above current levels, the first resistance to watch is 5944.50, which was yesterday’s high. Clearing this with follow-through would target 5981.50, the upper intraday range target for today. A sustained move above 5981.50 would open the door to test 6036.75.
To the downside, immediate support lies at 5934.00, yesterday’s close, and more importantly at 5922.75. Losing the bull/bear line would shift momentum lower, opening a path toward 5904.00, and then to the lower range target of 5864.50. A breakdown below this would leave 5808.50 as the next key support to defend.
As a note of interest, our long-term bull/bear line sits at 5950. Closes above this level will switch our trading mode from bearish to bullish, with a preferred buy-the-dip mode for multi-day traders. NQ moved into that mode a couple of days ago.
Overall, trend remains bullish above 5922.75. Bears would need to force a sustained break below that level to regain control.
NQ
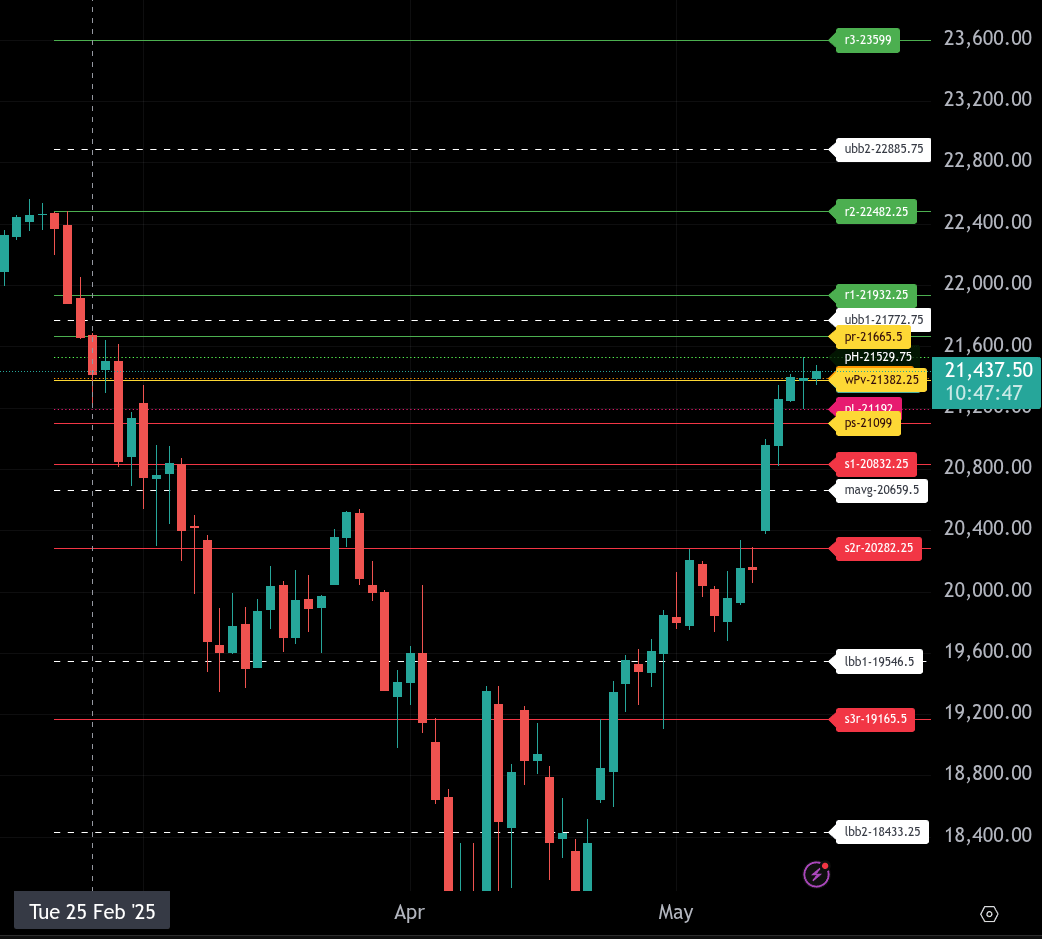
The bull/bear line for the NQ is at 21,382.25. This level is critical for gauging directional sentiment. Trading above this zone leans bullish, while rejection from it indicates potential weakness.
NQ is currently trading around 21,438.00, holding above the bull/bear line. As long as it remains above this pivot, buyers are in control, with the first upside target at 21,529.75, representing the high from yesterday and the highest print of the current recovery. A continued rally could extend toward 21,665.50, 21,772.80, and possibly 21,932.30, where stronger resistance is expected.
Should the market fall back below 21,382.25, the initial support zone is around 21,192.00, followed by the lower intraday range target of 21,099.00. A break below this opens the door to deeper downside potential toward 20,832.30.
With price holding above the bull/bear pivot early in the Globex session, the trend bias favors the long side for now. A loss of 21,382.25 would shift the tone toward neutral-to-bearish.
Use these levels for intraday decision-making and adjust positioning based on how price reacts around the key pivot zones.
Calendars
Economic Calendar Today
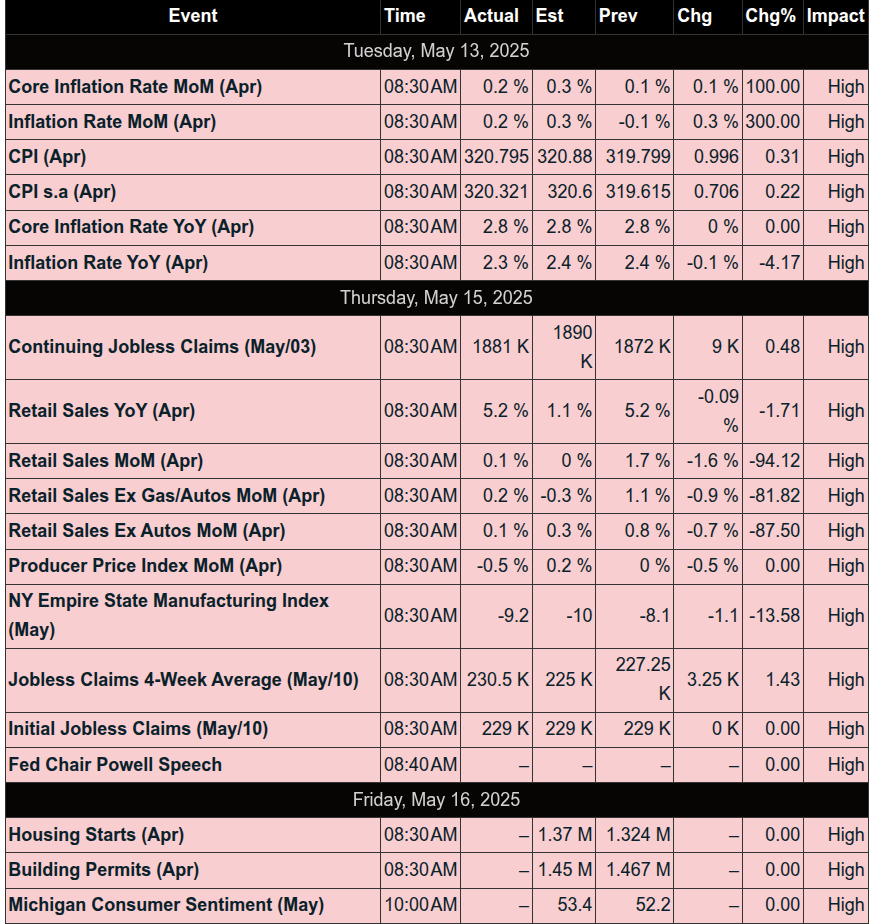
This Week’s High Importance
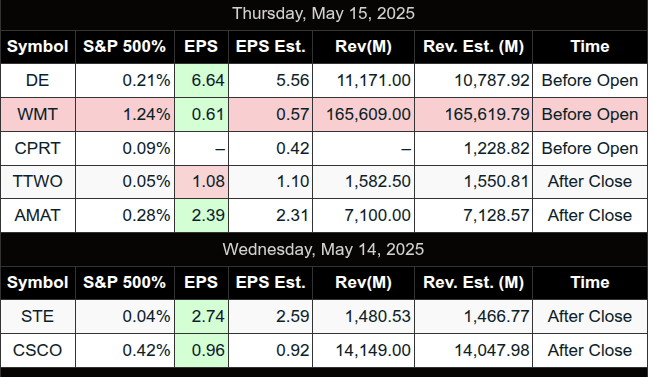
Earnings:

Affiliate Disclosure: This newsletter may contain affiliate links, which means we may earn a commission if you click through and make a purchase. This comes at no additional cost to you and helps us continue providing valuable content. We only recommend products or services we genuinely believe in. Thank you for your support!
Disclaimer: Charts and analysis are for discussion and education purposes only. I am not a financial advisor, do not give financial advice and am not recommending the buying or selling of any security.
Remember: Not all setups will trigger. Not all setups will be profitable. Not all setups should be taken. These are simply the setups that I have put together for years on my own and what I watch as part of my own “game plan” coming into each day. Good luck!!
Follow @MrTopStep on Twitter and please share if you find our work valuable!
This post goes out as an email to our subscribers every day and is posted for free here around 2 PM ET. To get your real-time copy, sign up for the free or premium version here: Opening Print Subscribe.
Comments are closed