This post goes out as an email to our subscribers every day and is posted for free here around 2 PM ET. To get your real-time copy, sign up for the free or premium version here: Opening Print Subscribe.
S&P Overload
Follow @MrTopStep on Twitter and please share if you find our work valuable!
Our View
I especially like buying the gap-downs, and while I did buy Sunday night’s open, I bought the ES to cover a short. Around 8:55 AM ET, a Wall Street Journal story said the Iranians want to negotiate a deal. The ES was trading around 6067.25 and rallied up to 6109.00 by 10:20AM ET. Iran then responded with this headline:
#IRAN IRANIAN ADVISOR TO IRGC COMMANDER SAYS “WE ARE READY FOR A LONG WAR AND HAVEN’T YET MADE STRATEGIC USE OF MISSILE CAPABILITIES”
I’m going to say it like it is: the ES and NQ didn’t give a shit about Iran’s response and just kept going up, rallying a total of 106 points from Sunday night’s Globex open—totally overlooking the high intensity of the Israel/Iran conflict.
It’s almost like the headline news algos totally control the markets. It took a while to digest the news, and the ES sold off down to the 6980 level around 3:20, then rallied a little as the 3:50 imbalances came out $1.6 billion to buy, trading up to the 6096 area.
In the end, in terms of the ES’s overall tone, it was firm until late in the day. In terms of the ES’s overall trade, volume was low. When you take out the ESM/ESU spread, total outright volume was 885k.
WTI crude futures fell 1.7% to $71.77 a barrel. U.S. Treasury yields edged higher despite a $13 billion auction of 20-year bonds that attracted solid demand from investors. The yield on the 10-year note closed at 4.452%, gold prices retreated 1% after settling Friday at a new record high, and the dollar index closed flat on the day.
During Operation Desert Storm, from August 1990 to January 1991, the S&P 500 sold off 18%, but recovered swiftly after the war started, gaining 20% between January 16 and June 8, 1991, as the conflict was short-lived and oil prices stabilized. By the end of the war, the S&P 500 had regained its losses and continued to rise, with a 26% increase within a year from its lowest point.
In early 2023, during Gulf War II, the S&P fell only 5.5% and settled up 28.68% on the year.
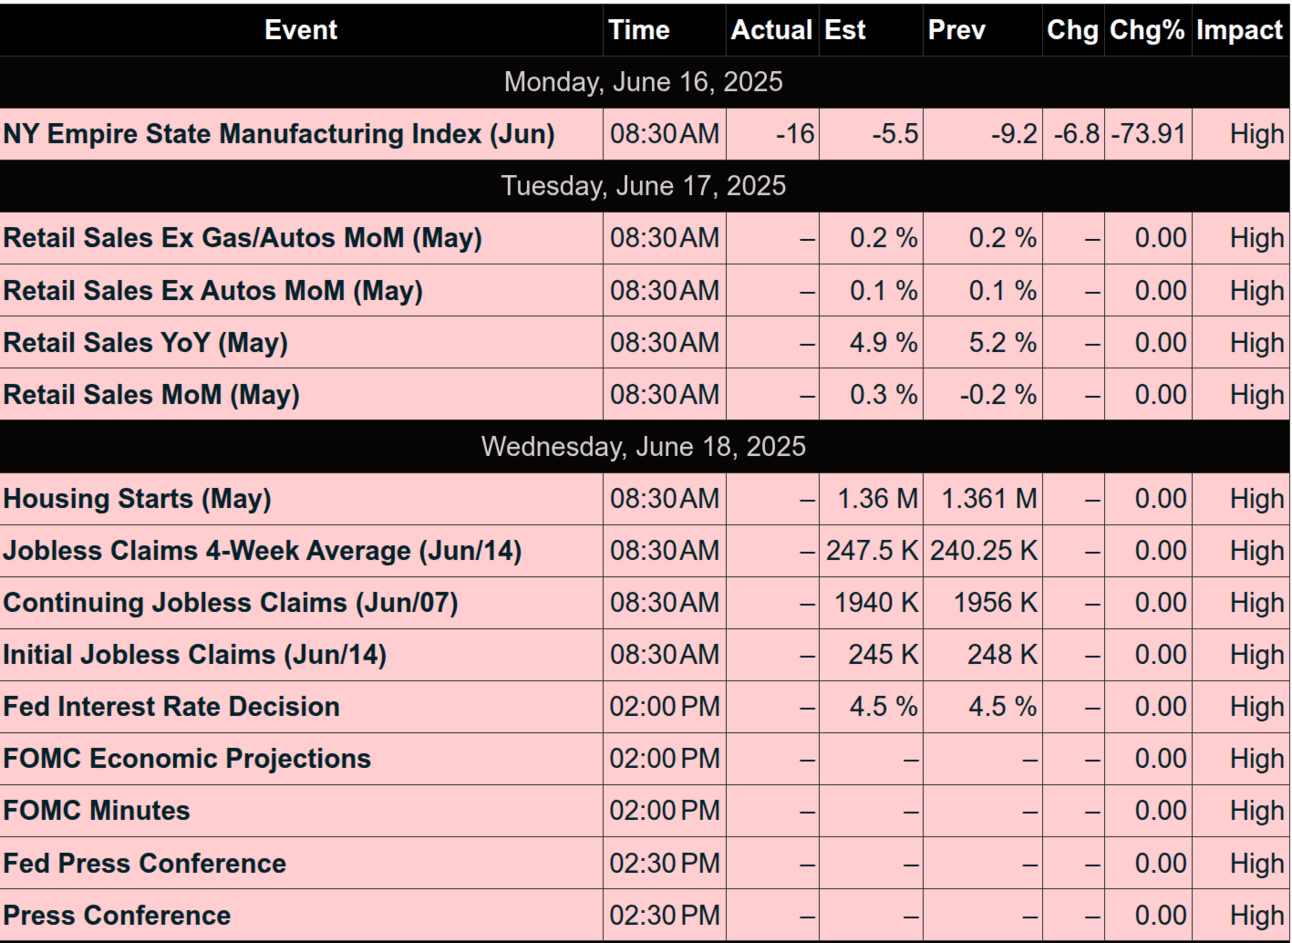
There are 12 economic reports over the next 3 sessions, including Wednesday’s FOMC meeting. As you can see, the effects of the Gulf Wars I and II were that the S&P initially sold off and then reversed the losses, making some large gains. I’m not sure why the markets aren’t reacting to the Israeli/Iranian war, but Pakistan has stated it would retaliate with nuclear weapons against Israel if it used them on Iran. Trump has left the G7 early and requested that the National Security Council be prepared in the Situation Room upon his return from the summit. It’s also only 22 days until July 9, when reciprocal tariffs are set to take effect after a 90-day pause.e out
Our Lean
The ES had a shaky close but sold off on Globex Monday evening after Trump said in a Truth Social post that “Everyone should immediately evacuate Tehran.” The ES and NQ began selling off, and crude jumped 2%. There was also news that Iran was trying to push Saudi Arabia and Qatar to pressure U.S. President Donald Trump to push Israel toward a ceasefire.
The CAC and DAX fell over 1%, and the FTSE was down 0.75%.
There is a lot of information to digest over the next 3 sessions. It almost feels like an overload. From today to July 9, there are only 15 trading days. Since Independence Day falls on a Friday this year, the markets will be closed the same day Trump’s 90-day tariff reprieve ends. Trump claims to have 200 tariff deals done, but they lack clarity.
Our lean: I think 6050.00 is critical, and I’ll be using it as a swing level. I can’t rule out buying the open, but if the ES starts trading under 6050, we could be looking at the 6030.00 or 6000.00 level.
MiM and Daily Recap
Intraday Recap
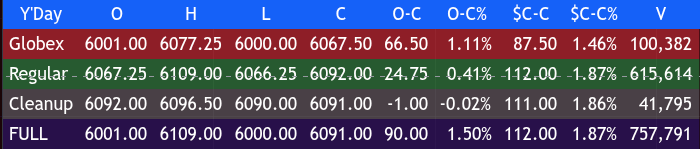
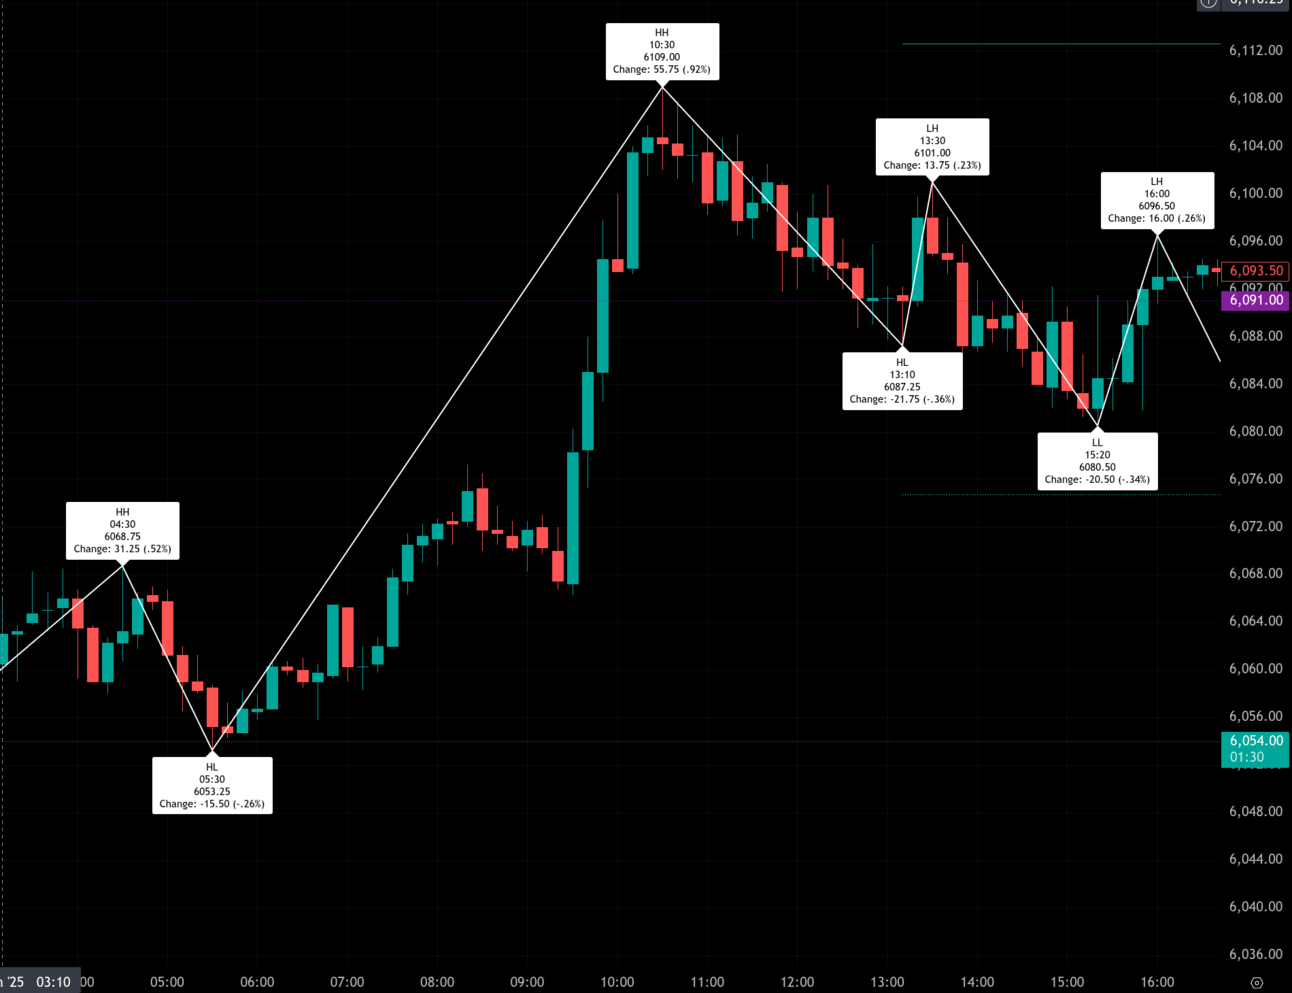
The ES market commenced the day following an overnight Globex session that saw the futures open at 6001.00. Early trading activity led to an overnight high of 6077.25 at 8:20 AM ET, marking a significant upward move from the Globex open. The Globex session concluded at 6067.50, representing a gain of 66.50 points, or 1.11%, from its open.
As the cash or regular session opened at 9:30 AM ET at 6067.25, price action immediately began to ascend. The market pushed higher, reaching an intraday high of 6109.00 at 10:30 AM ET, an advance of 41.75 points from the regular session open. This strong morning performance then faced resistance, leading to a notable decline that found support at an intraday low of 6087.25 by 1:10 PM ET, shedding 21.75 points from the 10:30 AM high.
Following this dip, the ES futures regained momentum, driving to a subsequent higher low of 6101.00 at 1:30 PM ET, an increase of 13.75 points from the 1:10 PM low. This upward trajectory was again interrupted, as prices pulled back to another intraday low of 6080.50 by 3:20 PM ET, indicating renewed selling pressure into the mid-afternoon. The regular session closed at 6092.00, marking a 24.75 point or 0.41% gain from its open. The Cleanup session, from 4:00 PM ET, saw a brief rise to 6096.50 at 4:00 PM ET, before the market ultimately settled at 6091.00 for the full session close. This final print represented an overall increase of 90.00 points, or 1.50%, from the Globex open. Compared to the prior day’s cash close, the ES futures ended the regular session up 59.50 points from the previous cash close.
The overall market sentiment for the day leaned decisively bullish, characterized by strong advances from both the overnight and regular session opens. Despite periodic pullbacks, buyers consistently stepped in, preventing deeper corrections and propelling prices higher throughout the trading day. The full session volume was light.
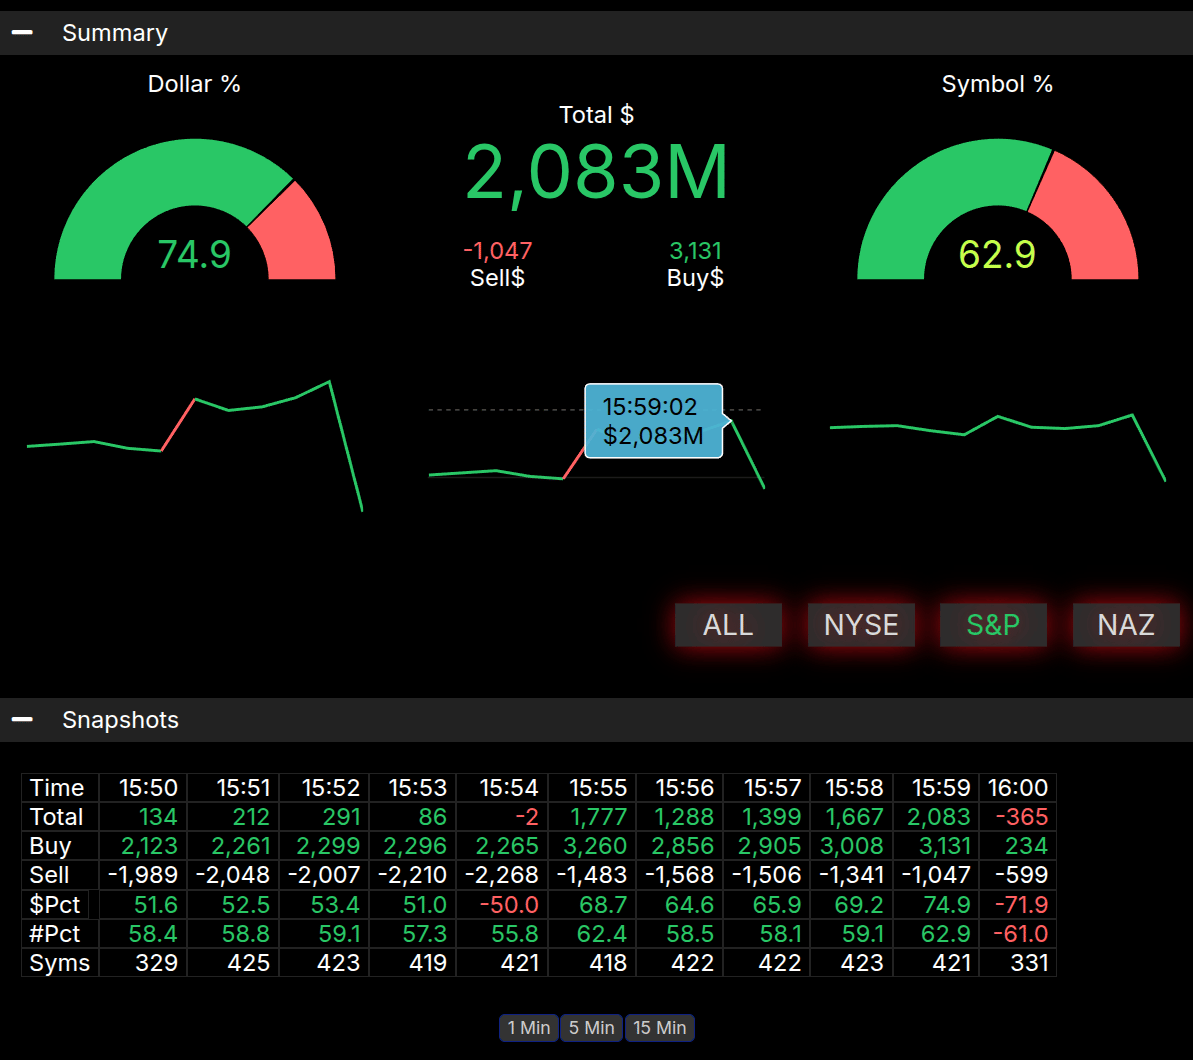
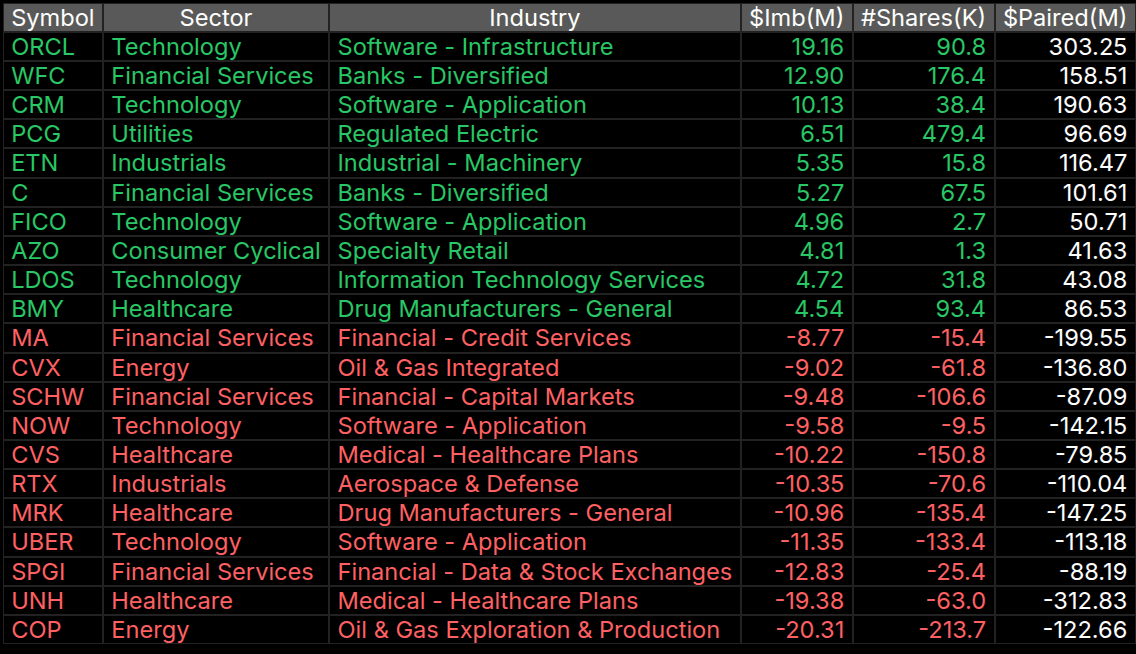
A key factor influencing the afternoon session was the Market-on-Close (MOC) imbalance data. Approaching the 3:59 PM mark, the dollar percentage showed a significant bias, with 74.9% favoring buy orders, amounting to a total buy imbalance of $2,083 million. The symbol imbalance also reflected a buying bias at 62.9%. While this did not reach the ±66% threshold for an extreme imbalance, it indicated a strong predisposition towards buying interest.
Technical Edge
MrTopStep Levels:
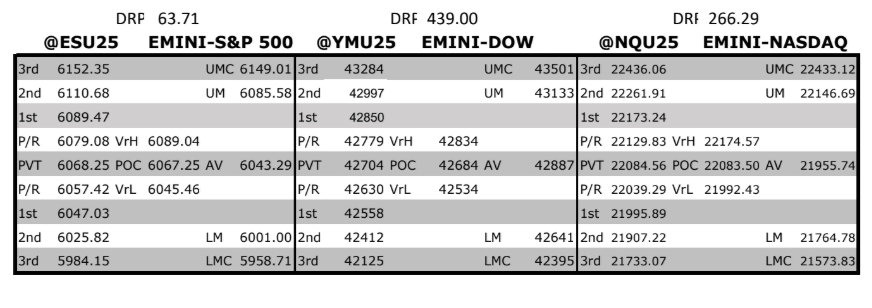
Fair Values for June 17, 2025:
-
SP: 57.06
-
NQ: 238.84
-
Dow: 348.34
Daily Market Recap 📊
For Monday, June 16, 2025
-
NYSE Breadth: 69% Upside Volume
-
Nasdaq Breadth: 82% Upside Volume
-
Total Breadth: 81% Upside Volume
-
NYSE Advance/Decline: 65% Advance
-
Nasdaq Advance/Decline: 65% Advance
-
Total Advance/Decline: 65% Advance
-
NYSE New Highs/New Lows: 88 / 57
-
Nasdaq New Highs/New Lows: 175 / 117
-
NYSE TRIN: 0.81
-
Nasdaq TRIN: 0.39
Weekly Breadth Data 📈
For Week Ending Friday, June 13, 2025
-
NYSE Breadth: 49% Upside Volume
-
Nasdaq Breadth: 67% Upside Volume
-
Total Breadth: 61% Upside Volume
-
NYSE Advance/Decline: 41% Advance
-
Nasdaq Advance/Decline: 37% Advance
-
Total Advance/Decline: 38% Advance
-
NYSE New Highs/New Lows: 168 / 70
-
Nasdaq New Highs/New Lows: 385 / 195
-
NYSE TRIN: 0.69
-
Nasdaq TRIN: 0.29
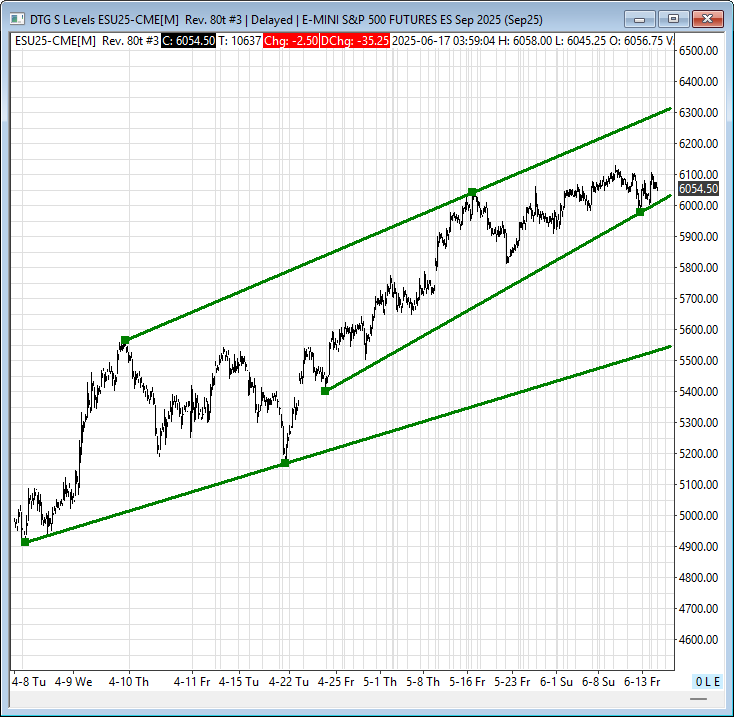
ES
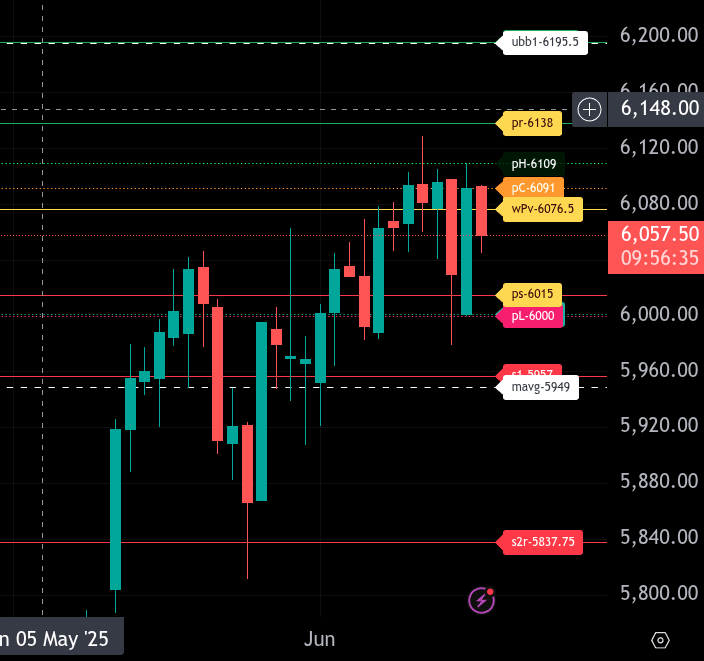
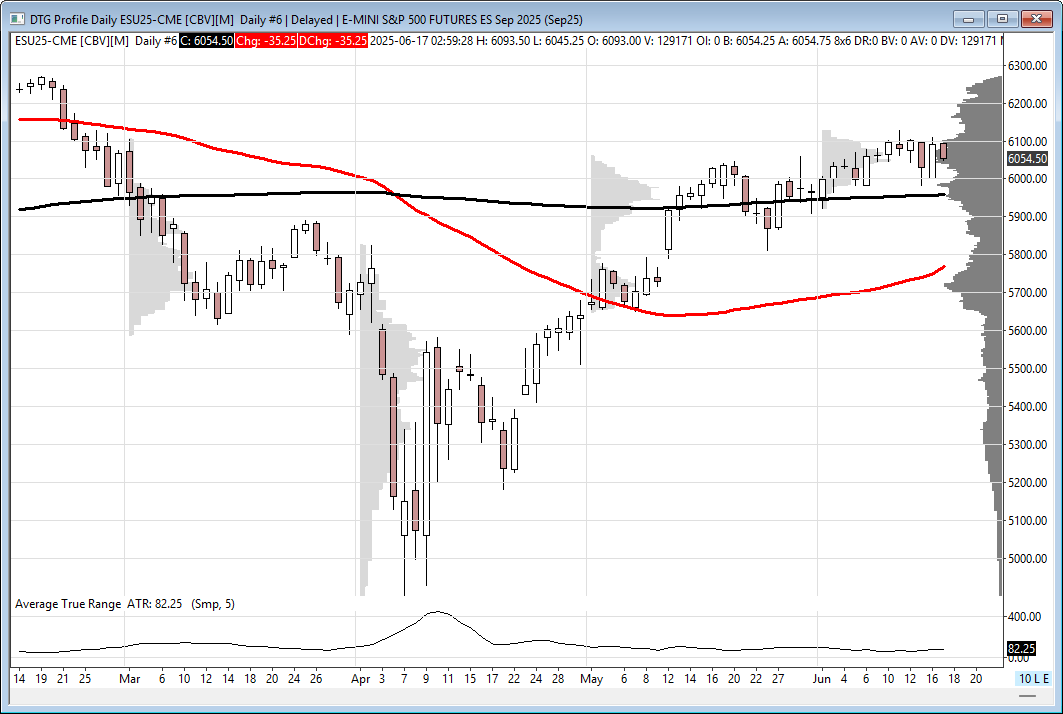
The bull/bear line for the ES is at 6076.50. This is the key level that must be reclaimed for bullish momentum to resume. Above this level, we look for potential buying opportunities on dips.
Currently, ES is trading around 6057.50, indicating weakness below the bull/bear line. If the price remains below this level, expect further downside pressure, targeting 6015.00, our lower range target for today, and then 6000.00. A break below these levels could extend the decline towards 5957.00 and 5949.00.
On the upside, immediate resistance comes in at 6091.00, then at 6109.00, and finally at 6138.00, our upper range target. If ES can reclaim 6076.50 and hold above, a test of these resistance levels is likely. Bulls need sustained strength above 6138.00 to confirm a potential reversal, with further resistance at 6195.50.
Overall, the trend remains bearish below 6076.50, and caution is warranted until this level is reclaimed.
NQ – Week to Week
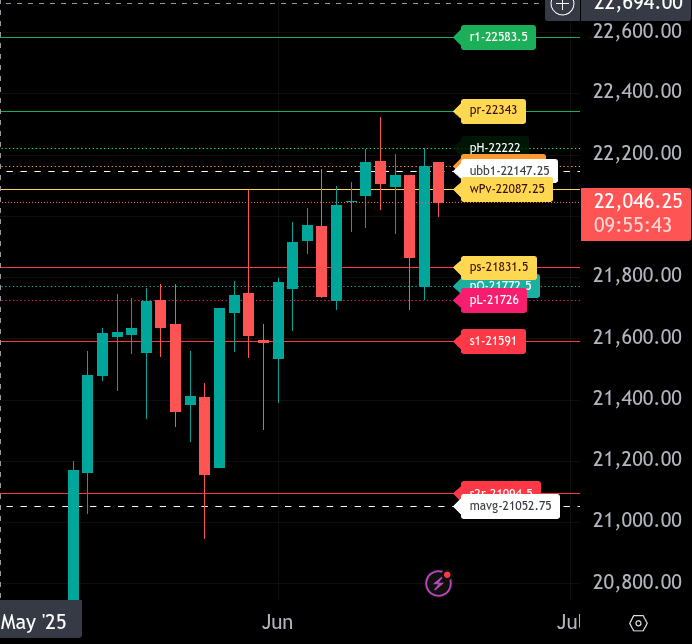
The bull/bear line for the NQ is at 22,087.25. This is the key level that must be reclaimed for bullish momentum to resume. Above this level, we look for potential buying opportunities on dips.
Currently, NQ is trading around 22,045.75, indicating weakness below the bull/bear line. If the price remains below this level, expect further downside pressure, targeting 21,831.50, our lower range target for today. Additional support levels are at 21,772.50, 21,726.00, and 21,591.00. A break below these levels could extend the decline further.
On the upside, resistance comes in at 22,147.25, then 22,222.00, and then at 22,343.00, our upper range target. If NQ can reclaim 22,087.25 and hold above, a test of these resistance levels is likely. Bulls need sustained strength above 22,343.00 to confirm a potential reversal, with higher resistance at 22,583.50.
Overall, the trend remains bearish below 22,087.25, and caution is warranted until this level is reclaimed.
Calendars
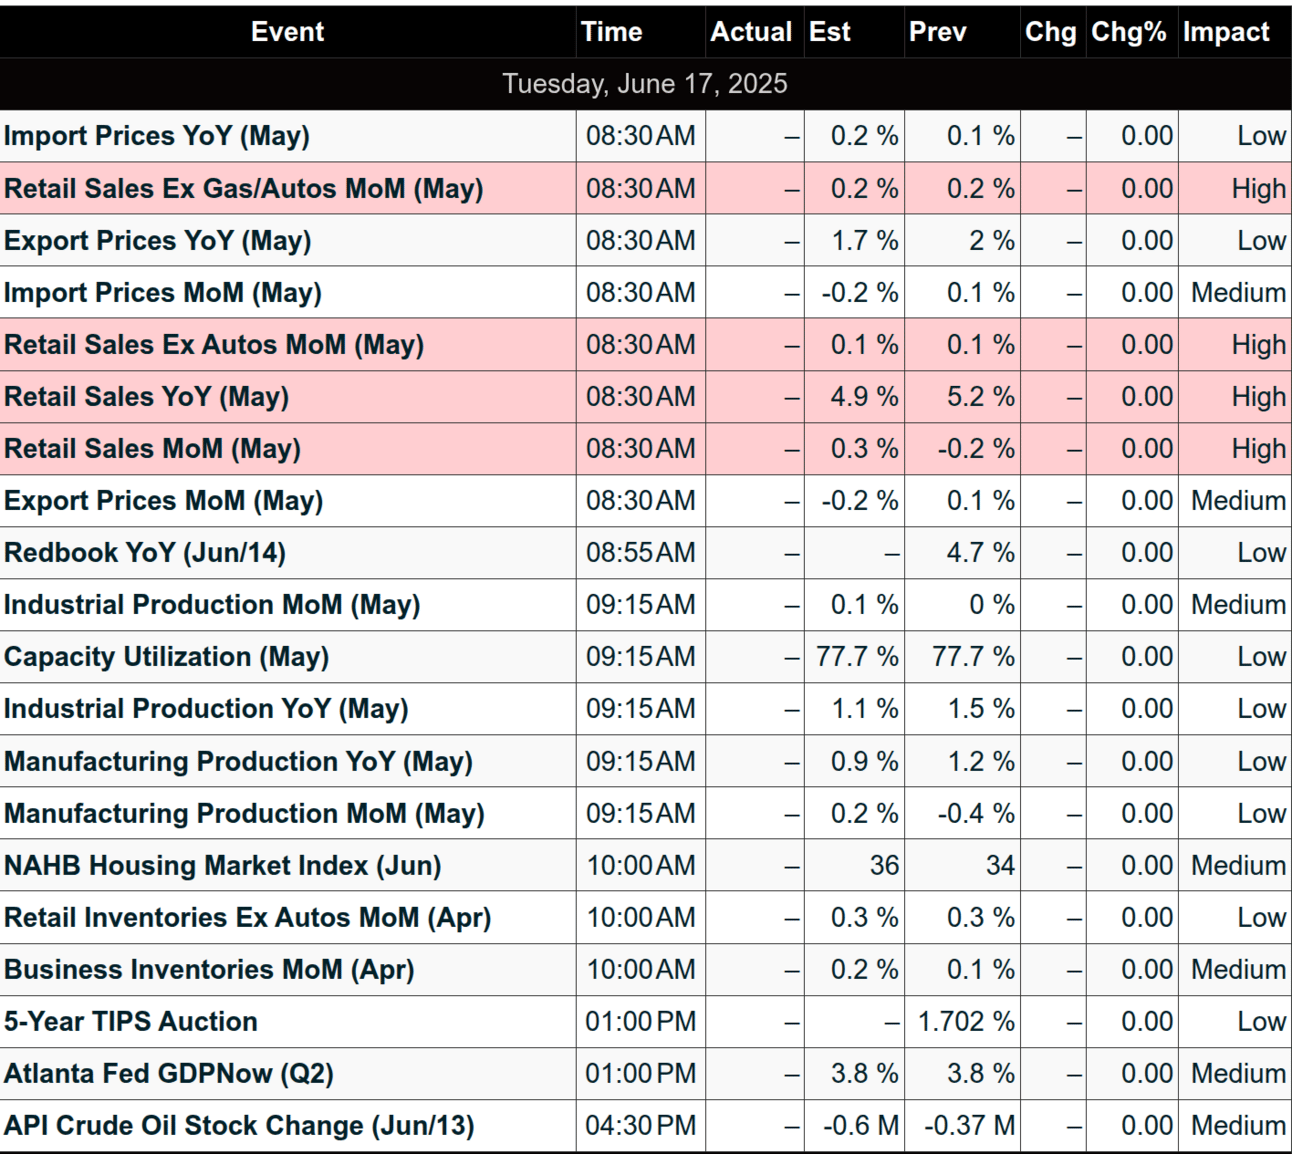
Economic Calendar
Today
Important Upcoming
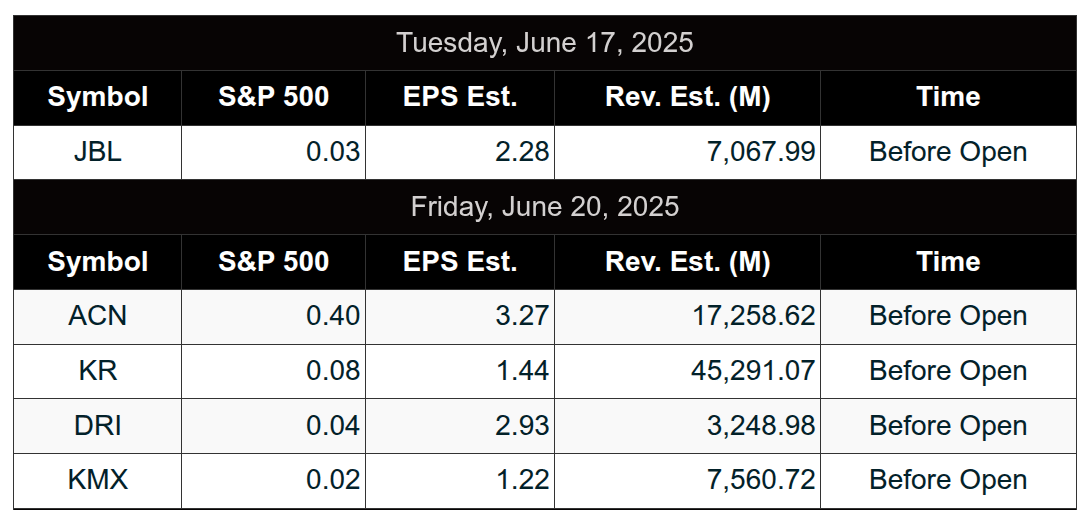
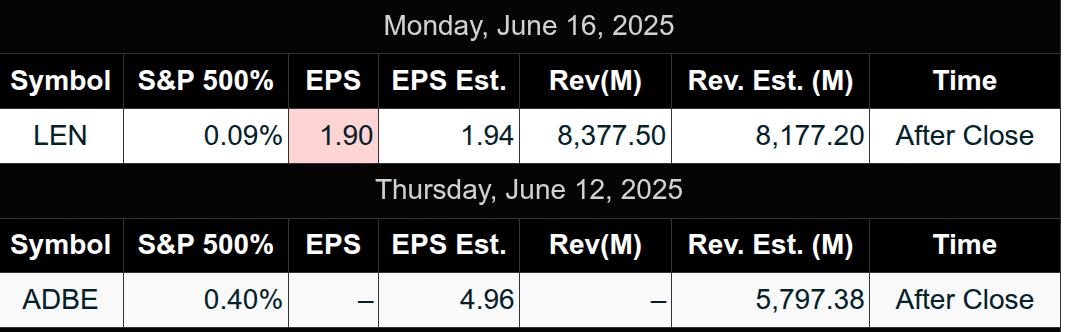
Earnings
Trading Room Summaries
Polaris Trading Group Summary – Monday, June 16, 2025
Yesterday was a solid trading day with an emphasis on identifying structure early, capitalizing on bullish momentum, and maintaining discipline through the afternoon. The team shifted to the September contract and focused on Cycle Day 1 developments.
Morning Highlights:
-
The session began with strong bullish momentum after overnight action reclaimed the 5960 level and surged past the 6020 initial target.
-
PTGDavid emphasized an initial buy lean, looking for strength unless a clear bear structure emerged.
-
The team effectively targeted zones such as 6055–6060 for potential buy responses, with multiple successful hits on Open Range Targets (TGT 1 and TGT 2) for both ES and NQ.
-
A PKB (Pullback Breakout) pattern highlighted by blibby71 developed as anticipated and was later confirmed by PTGDavid, reinforcing the importance of having a rule-based approach and recognizing structure shifts.
Key Lessons and Insights:
-
Early trade execution during the morning session proved critical, as the afternoon slowed significantly (“Afternoon Snoozer” per PTGDavid).
-
The importance of mental capital preservation was stressed — avoiding low-probability trades in the afternoon and instead taking the time for personal well-being.
-
The day provided educational reinforcement on how to identify trend structure changes and the value of deliberate practice, as noted during community interactions.
Closing Notes:
-
Price settled near the mid-VWAP, described as the “Romulan Neutral Zone” — indicating balance post-morning move.
-
Contract rollover is ongoing, with the September contract now in focus.
-
Community engagement remained lighthearted yet informative, with geopolitical news being discussed without disrupting trading focus.
Positive Trade Recap:
-
Bullish continuation in the morning gave multiple long setups.
-
ES and NQ both hit their Open Range targets, confirming strong directional structure.
-
PKB pattern recognition added confidence and clarity to mid-day decisions.
Overall, a disciplined and productive Monday with strong market read-throughs, especially in the first half.
Discovery Trading Group Room Preview – Tuesday, June 17, 2025
-
Geopolitical Update: President Trump and UK PM Starmer finalized a US/UK trade deal, focusing on aerospace and auto tariffs. Trump seeks similar agreements with Canada and the EU during the G7 summit. However, he left the summit early due to escalating tensions in the Middle East, calling for an evacuation of Tehran amid ongoing Israel-Iran conflict.
-
Fiscal Policy & Legislation: Senate Republicans introduced a tax bill preserving Trump-era tax cuts, adding new breaks like tax-free tips. It offsets costs by cutting clean energy and Medicaid support. The bill also raises the debt ceiling by $5T and boosts chip manufacturing incentives, while omitting contentious House proposals like SALT cap changes and new foundation taxes.
-
Market Data & Earnings: Focus today is on Retail Sales, Import Prices, Industrial Production, and Housing Index data. Jabil (JBL) reports premarket earnings.
-
Market Technicals: Volatility remains elevated with the ES 5-day average range at 84.25. Trendline support at 6011/14s held overnight; 200-day MA sits at 5958.50. Resistance seen at 6307/12s. No strong whale bias noted as overnight volume was bullish but light.
Affiliate Disclosure: This newsletter may contain affiliate links, which means we may earn a commission if you click through and make a purchase. This comes at no additional cost to you and helps us continue providing valuable content. We only recommend products or services we genuinely believe in. Thank you for your support!
Disclaimer: Charts and analysis are for discussion and education purposes only. I am not a financial advisor, do not give financial advice and am not recommending the buying or selling of any security.
Remember: Not all setups will trigger. Not all setups will be profitable. Not all setups should be taken. These are simply the setups that I have put together for years on my own and what I watch as part of my own “game plan” coming into each day. Good luck!
This post goes out as an email to our subscribers every day and is posted for free here around 2 PM ET. To get your real-time copy, sign up for the free or premium version here: Opening Print Subscribe.
Comments are closed