This post goes out as an email to our subscribers every day and is posted for free here around 2 PM ET. To get your real-time copy, sign up for the free or premium version here: Opening Print Subscribe.
Two way street, look both ways before crossing.
Follow @MrTopStep on Twitter and please share if you find our work valuable!
FREE Two-Week Offer for the Opening Print Premium. Open up the Lean and other premium features for the next Two Weeks!
Our View
The OBBB (One Big Beautiful Bill) is slowly making its way to Trump’s desk. A large portion of domestic economic policy will finally be eliminated. The markets have already adjusted as if it is a done deal.
Tech and AI come out as big winners, and the green sector is the big loser.
Interest rates will remain a focus on the market as Trump nails down his whole market upheaval in international trade. The trader realignment is not only focused on the US; the entire world is using this time to negotiate with their trading partners. Markets need to have some better clarity on the outcome by this fall.
Until then, we will continue to move the market in fits and spurts.
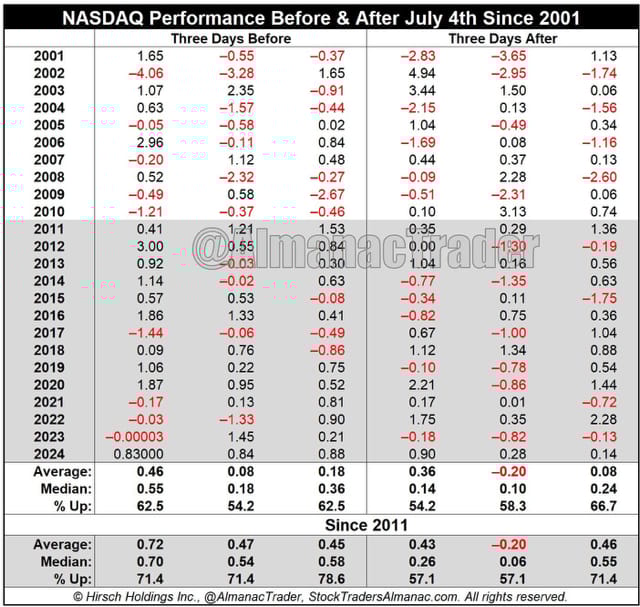
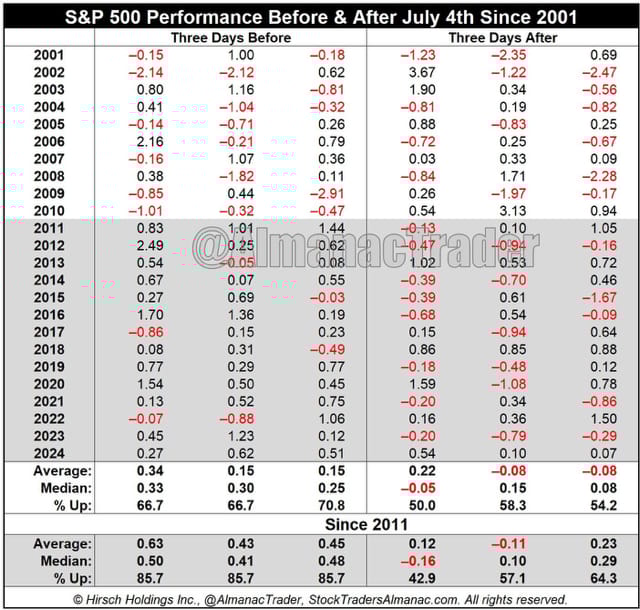
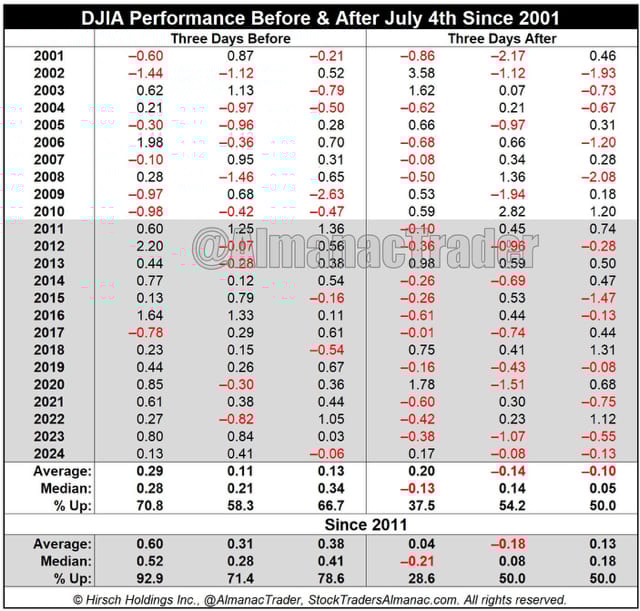
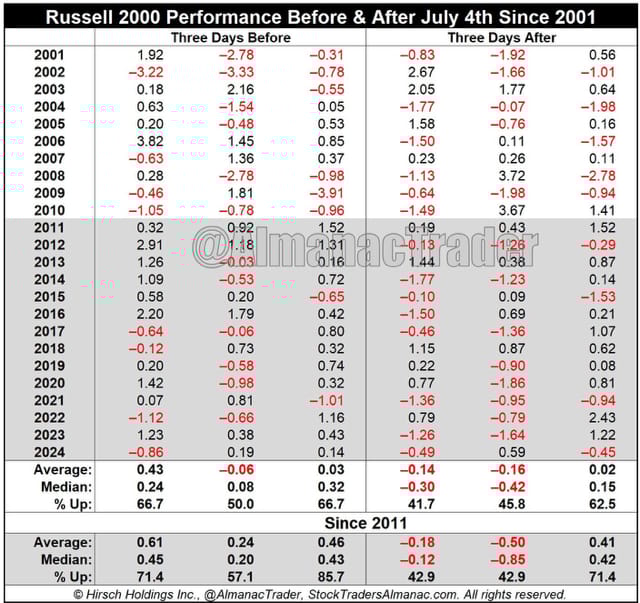
Seasonally fourth of July week is bullish going into the holiday and bearish on the next week. We are sharing a study from our partners at Stock Traders Almanac:
Trading the three days ahead of the July 4th Independence Day holiday has historically been stronger than the days after the holiday. Trading on the day before and after the holiday is often lackluster. Volume tends to decline on either side of the holiday as vacations begin early and/or finish late. Since 1980, DJIA, S&P 500, NASDAQ and Russell 2000 have recorded net losses on the day after.
This has become more pronounced in recent years and was the case again last year. However, over the past thirteen years since 2011, trading after Independence Day has softened notably. DJIA has declined ten times in 14 years on the day after. S&P 500 has slipped eight times. Average performance remains fractionally positive. NASDAQ and Russell 2000 have more up days after the 4th, but R2K averages losses the two days after the 4th.
Our Lean
Our summer trading hasn’t quite started yet. We did do some consolidating as expected. We think more of the same today. We traded 1.2M contracts of the front month yesterday; we should see that lower today.
Overnight, Globex has traded as high as 6270. We would like an opportunity to short at that level today or pick up anything near 6227, which is near yesterday’s low.
Our lean: Continue to work as a two-way market buying dips and selling the rips. Tomorrow is a shortened day and the May Jobs report.
Guest Posts — Polaris Trading Group
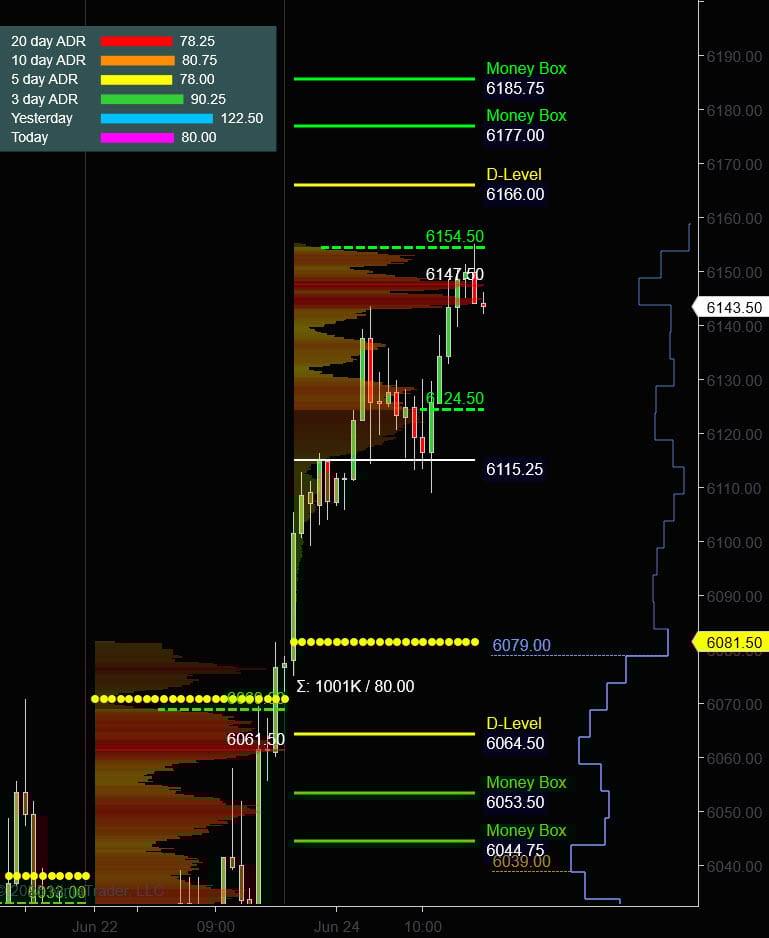
Prior Session was Cycle Day 3: Positive 3-Day Cycle as price secured a rally above the CD1 Low (6183.25) which has an 90.70% historical performance track history.
Positive 3-Day Cycle Statistic is defined as Price Above the Cycle Day 1 Low on Cycle Day 3. P > CD1 on CD3.
This session was a solid example of how the DTS Briefing’s 7.1.25 outline played out with ultra precision.
BOTH upper and lower initial target zones were fulfilled as today’s rhythms consolidated recent activity, forming an “inside-day.”
Range for this session was 34 handles on 1.264 contracts exchanged.
With the shortened holiday trading schedule, this is NOT the time to be playing “bigly” as volumes and volatility are thinning. This means any TTB’s (news bombs) are likely to gyrate price in an instant.
Be sure to play the “probabilities” of your strategy of choice, while keeping proper $risk management. There are plenty of solid opportunities awaiting us during the 2nd half of the year. Play the “long-ball” game.
For a more detailed recap of the trading session, click on this link: Trading Room RECAP 7.1.25
FREE TRIAL link to PTG/Taylor Three Day Cycle
…Transition from Cycle Day 3 to Cycle Day 1
Transition into Cycle Day 1: Today begins a new cycle with the average decline projection measuring 6223.50 (Recap) and 6159 (Recap-MA).
Markets closed in the upper quartile of the day’s range. Given the shortened holiday trading with thinning volumes, the S&P Futures is a stone’s throw of an All-Time Contract High.
It won’t take much to “top-it-off” for the July 4th Holiday Celebration.
Of course, nothing changes for PTG…Simply follow your plan. Take only Triple A setups and manage the $risk. ALWAYS HAVE HARD STOP-LOSSES in-place on the exchange.
PTG’s Primary Directive (PD) is to ALWAYS STAY IN ALIGNMENT with the DOMINANT FORCE.
As such, scenarios to consider for today’s trading.
Bull Scenario: Price sustains a bid above 6255+-, initially targets 6265 – 6270 zone.
Bear Scenario: Price sustains an offer below 6255+-, initially targets 6240– 6235 zone.
PVA High Edge = 6253 PVA Low Edge = 6238 Prior POC = 6248
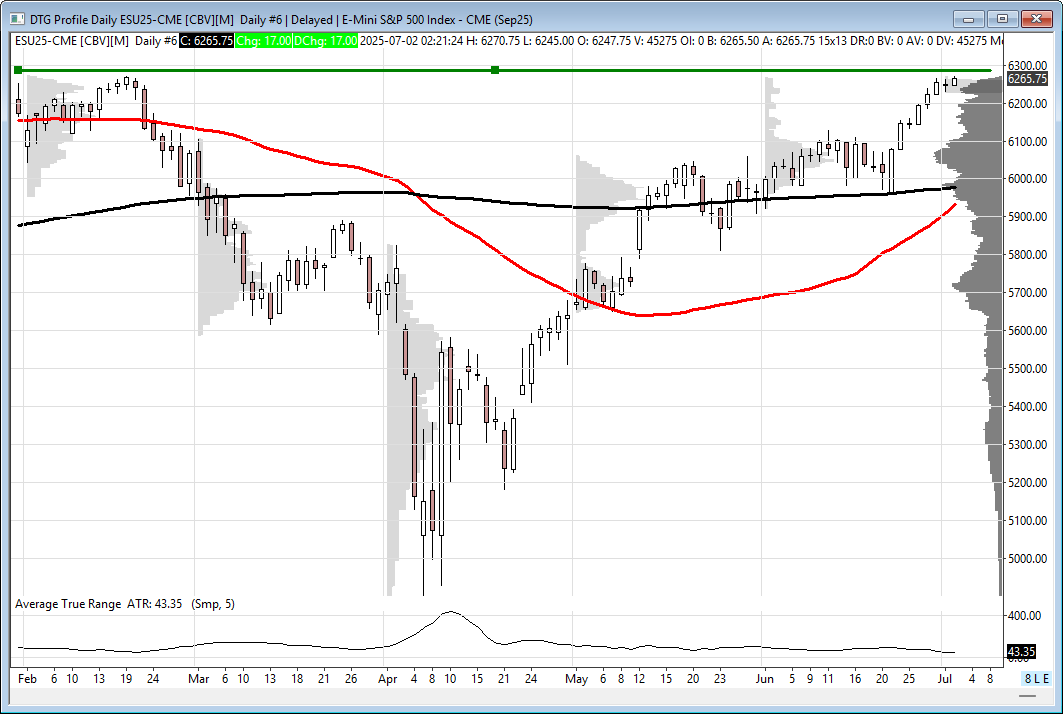
ESU
Thanks for reading, PTGDavid
MiM and Daily Recap
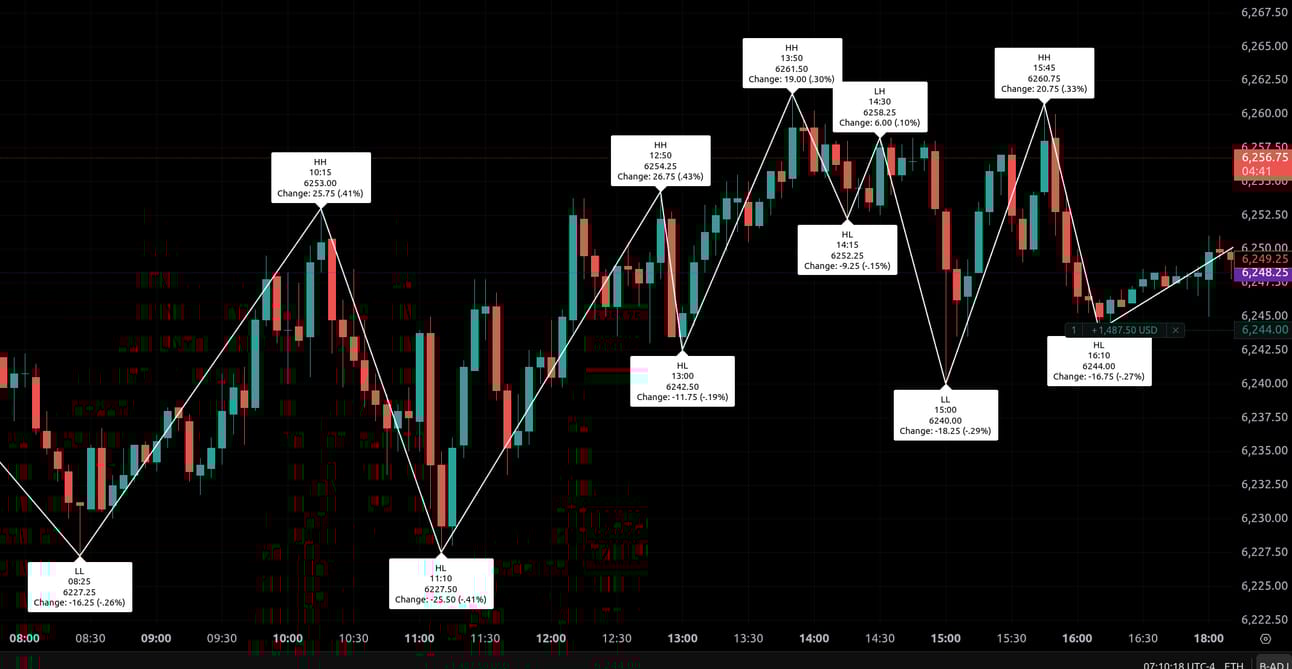
The overnight Globex session opened at 6245.75 and drifted lower, establishing a premarket low of 6227.25 by 8:25 AM and closing the overnight session at 6235.25, down 16.25 points (0.26%) from the previous cash close. At the 9:30 AM open, the market printed 6235.25. From there, ES advanced steadily into mid-morning, reaching the first intraday high of 6253.00 by 10:15 AM, marking a 25.75-point gain (+0.41%) off the premarket low.
However, this early rally was quickly retraced, with sellers pressing price down to a late morning low of 6227.50 by 11:10 AM, effectively round-tripping the earlier advance. Momentum shifted again heading into midday, as ES recovered sharply, climbing back to 6254.25 by 12:50 PM, representing a 26.75-point rebound (+0.43%) from the morning pullback. A modest dip followed, taking the index down to 6242.50 at 1:00 PM before the next leg higher.
By 1:50 PM, ES achieved another high of 6261.50, up 19.00 points (+0.30%) from the prior dip. Afterwards, price pulled back to 6252.25 by 2:15 PM, consolidating within a tight range. A final afternoon lift peaked at 6260.75 at 3:45 PM, marking the session’s last significant high. Into the closing minutes, the market reversed course once more, selling off to an intraday low of 6240.00 by 4:10 PM, losing 20.75 points (-0.33%) from the afternoon high. A minor late bounce lifted ES marginally to finish the Cleanup session at 6248.25.
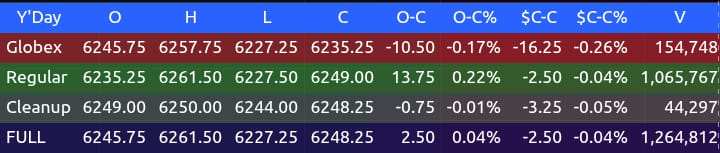
From a session perspective, the regular hours saw an open-to-close gain of 13.75 points (+0.22%), while the Globex session was net negative by 16.25 points (-0.26%). The final settlement printed 6248.25, a modest increase of 2.50 points (+0.04%) from the prior day’s cash close.
The day’s action reflected choppy rotational trade, with buyers and sellers alternating control but ultimately unable to push the market decisively out of the broader 35-point range defined by 6227.25 low and 6261.50 high.
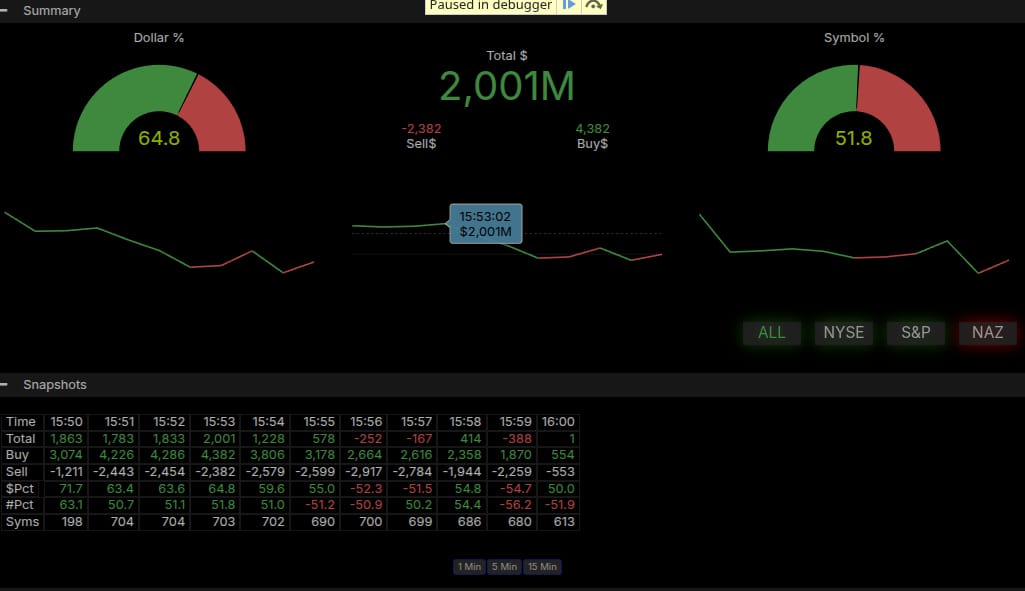
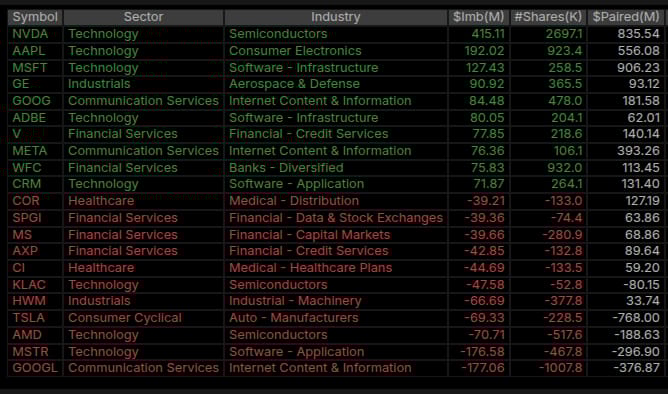
Market tone leaned neutral to slightly constructive, as the session balanced responsive buying against persistent intraday selling into each rally. Total volume reached 1,264,812 contracts across all sessions, showing steady participation. Notably, the Market-on-Close imbalance data showed a total imbalance of $2.001 billion at 3:53 PM, with the dollar percentage reading 64.8% to the buy side, just under the 66% threshold for a strong directional signal. The symbol imbalance ended the day at 51.8% in favor of buyers, suggesting a modest tilt but no decisive end-of-day surge.
Despite the late-day selling that pressured the index to the 6240.00 area, the imbalance data likely helped cushion downside into the final prints. Overall, the session closed marginally higher, reflecting an equilibrium after a series of directional swings. Heading into the next session, traders will be watching to see if ES can build acceptance above the 6260 area or if supply continues to cap advances near recent highs.
Technical Edge
Fair Values for July 2, 2025:
-
SP: 48.97
-
NQ: 206.86
-
Dow: 286.22
Daily Market Recap 📊
-
• NYSE Breadth: 69.7% Upside Volume
• Nasdaq Breadth: 49.1% Upside Volume
• Total Breadth: 51.8% Upside Volume
• NYSE Advance/Decline: 73% Advance
• Nasdaq Advance/Decline: 55% Advance
• Total Advance/Decline: 62% Advance
• NYSE New Highs/New Lows: 121 / 17
• Nasdaq New Highs/New Lows: 201 / 75
• NYSE TRIN: 1.25
• Nasdaq TRIN: 1.33
Weekly Market 📈
-
• NYSE Breadth: 57.9% Upside Volume
• Nasdaq Breadth: 60.3% Upside Volume
• Total Breadth: 59.3% Upside Volume
• NYSE Advance/Decline: 72% Advance
• Nasdaq Advance/Decline: 65% Advance
• Total Advance/Decline: 68% Advance
• NYSE New Highs/New Lows: 216 / 80
• Nasdaq New Highs/New Lows: 465 / 275
• NYSE TRIN: 1.86
• Nasdaq TRIN: 1.25
ES & NQ BTS Levels
ES Levels
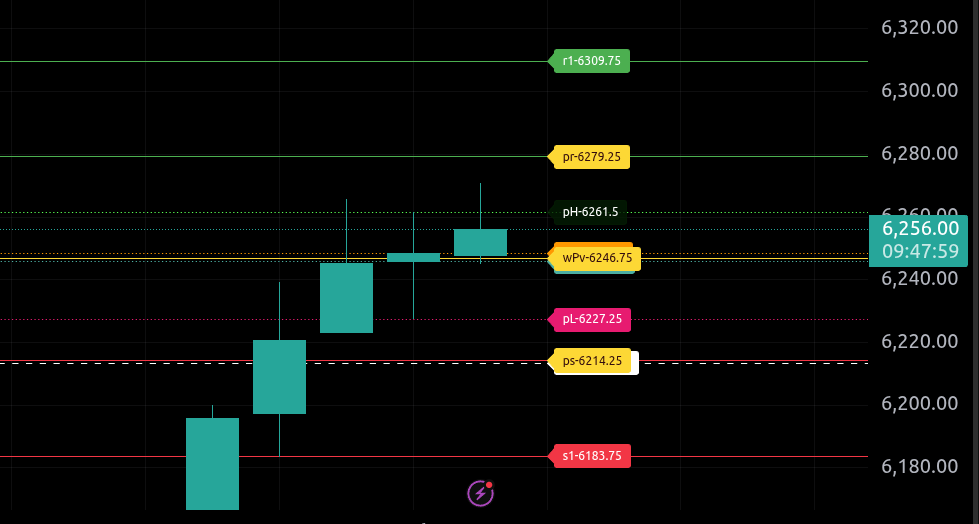
The bull/bear line for the ES is at 6246.75. This is the key level that must be held for bullish momentum to remain intact. A sustained move below this level will shift sentiment bearish.
Currently, ES is trading around 6256.20, sitting slightly above the bull/bear line. If the price can remain above this level, the next upside objectives are 6261.50 and the upper range target at 6279.20. A breakout above this zone opens potential for a rally toward 6309.70.
On the downside, first support comes in at 6227.25 and then at 6214.25, which is the lower range target for today. If ES loses these levels, further declines could test deeper support near 6183.70.
Overall, the market maintains a neutral to mildly bullish posture while holding above 6246.70. Bulls need to defend this level early in the session and build momentum through 6279.20 to gain confidence. A move below the lower range target would tilt bias more decisively bearish.
NQ Levels
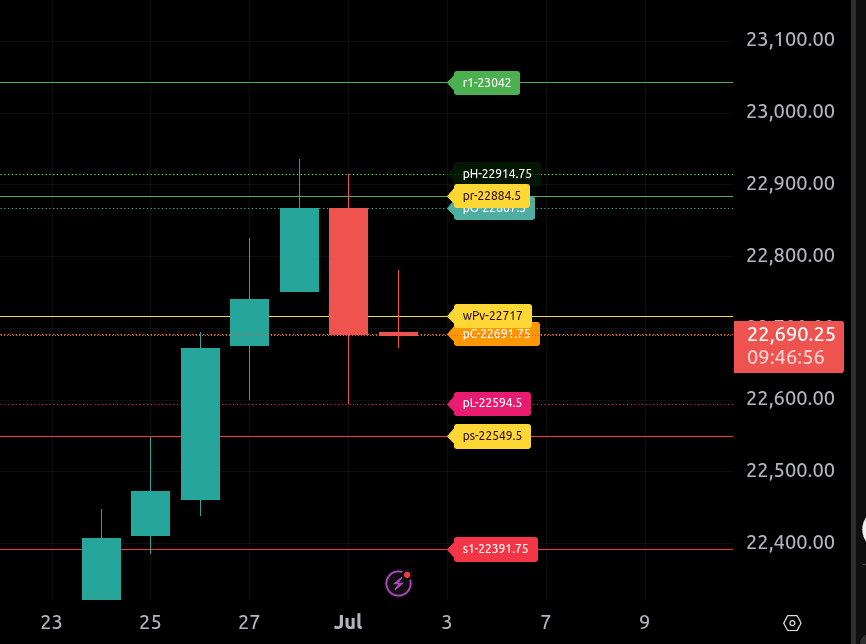
The bull/bear line for the NQ is at 22,717.00. This is the primary pivot level that must be reclaimed for bullish sentiment to reestablish itself. As long as price remains below this level, sellers are favored on rallies.
Currently, NQ is trading around 22,690.00, indicating continued weakness beneath the bull/bear line. If this persists, expect further downside pressure targeting first 25,594.50 and then 22,549.50, which is today’s lower range target. A break below this level could open the path toward deeper support near 22,391.80.
On the upside, resistance is seen first at 22,884.50, which is the upper range target. Higher resistance sits at 23,042.00. Any sustained move above 22,717.00 would likely prompt a test of these resistance levels.
Additional support levels to monitor are 22,594.50 and 22,549.50, while overhead resistance before the upper target is found at 22,914.80.
Overall, the bias remains bearish below 22,717.00, with caution warranted on any countertrend moves.
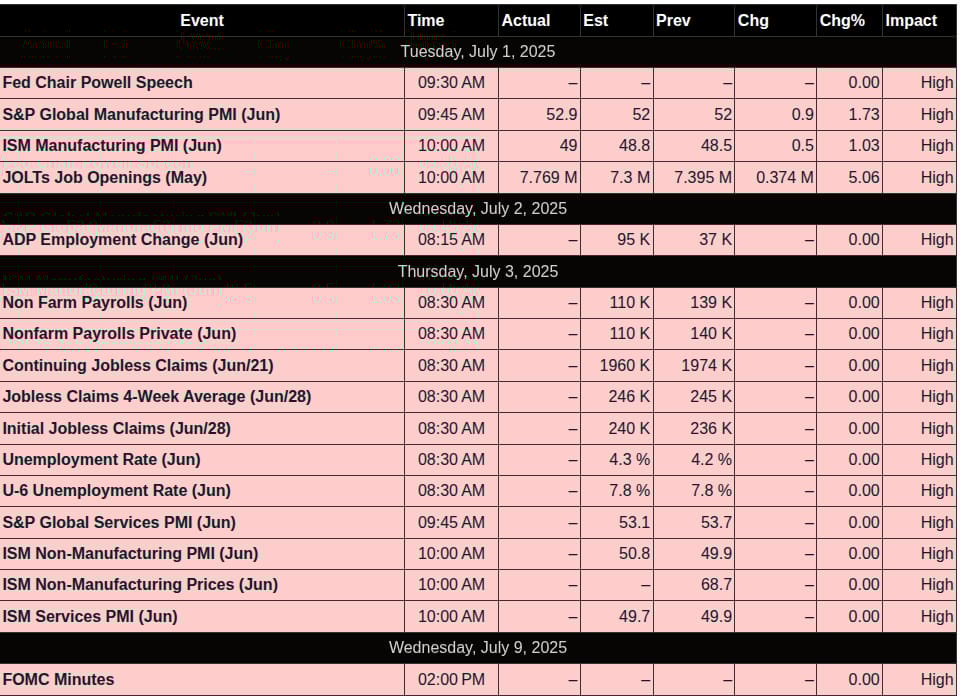
Calendars
Economic
Today
Important Upcoming / Recent
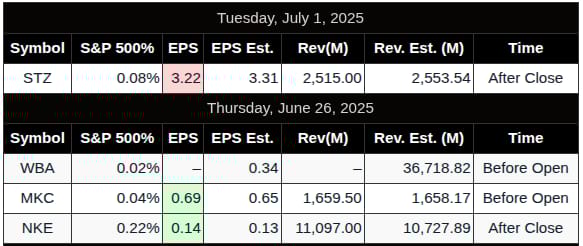
Earnings
Upcoming
NONE
Recent
Trading Room Summaries
Polaris Trading Group Summary – Tuesday, July 1, 2025
Morning Prep & Strategy:
-
David shared key strategy links and tools, including the Daily Trade Strategy and Range Calculator.
-
Emphasized discipline and process over outcomes: “I have no control over trade outcomes…orders MUST comply with criteria.”
-
Noted events on deck: Powell’s comments at 9:30 AM and ISM PMI at 10 AM.
-
Gamma notes highlighted volatility contraction and a call wall shift up to 6,235, marking the top end of the expected range.
-
Identified the initial sandbox zone 6,234–6,244 as a critical area to watch.
Active Trading Highlights:
-
CL (Crude Oil) Open Range Short Target 1 filled early, showing good execution on the first trade idea.
-
Powell’s comments about rate cuts later this year created bullish undertones, but market remained cautious.
-
JOLTS data was stronger than expected, ISM Manufacturing slightly weak, adding to mixed sentiment.
-
David maintained a core long lean on dips while warning about potential structural shifts.
-
Midday: Price locked in tight range rhythms, confirming lighter holiday week volume expectations.
Bear Scenario & Precision Levels:
-
Late morning, Bear Scenario triggered exactly as planned:
-
Price sustained below 6,245 LIS
-
Initial target zone 6,230–6,225 was hit precisely, demonstrating excellent scenario mapping and discipline.
-
-
Noted a precise reversal from lower target zone, offering opportunity for traders prepared to fade extremes.
-
Emphasized measuring D-Level Money Box zones—great practice in identifying confluence and retracement setups.
Afternoon Headlines & Volatility:
-
Trump tariff comments about Japan caused a sharp selloff (“market takes a dump”), underscoring the importance of headline risk awareness.
-
MOC (Market-on-Close) imbalances showed a $2 billion buy imbalance, but it was paired off smoothly into the close.
Key Lessons & Takeaways:
-
Preparation paid off: The scenarios laid out in the DTS Briefing (both upside and downside target zones) were fulfilled to the tick.
-
Patience and discipline were rewarded—range-bound action still offered intraday opportunities if traders stayed engaged and followed the process.
-
Importance of headline monitoring, especially in low-volume holiday weeks where moves can be exaggerated.
-
Practice measuring and marking zones—David encouraged traders to replicate his D-Level Money Box measurements to build skill.
Overall, a constructive session with precise technical levels respected, good execution on early shorts, and a textbook reversal after downside targets.
Let me know if you’d like this in a shorter format or with a focus on any specific trade setups!
Discovery Trading Group Room Preview – Wednesday, July 2, 2025
-
Major Policy Developments:
The Senate narrowly passed Trump’s sweeping tax and spending bill (51–50, VP Vance tie-breaker). Key measures:
• $1 trillion in safety-net cuts over 10 years
• Faster elimination of clean-energy tax breaks
• Extension of 2017 tax cuts plus new breaks for tip/overtime workers, the elderly, and car buyers financing US-assembled vehicles
• Hundreds of billions for defense, $45B for immigration detention, $47B for southern border security
• Medicaid work/co-pay requirements, rural hospital funding, and a $1,000 “Trump child account” for newborns (2025–2028)
• 1% tax on remittances, 50% cut to consumer protection funding
• SALT deduction cap raised to $40K for 5 years
The bill heads back to the House for expected passage tomorrow. -
Tariff Uncertainty:
Trump’s reciprocal tariff pause ends July 9. No extension planned; tariffs may be assigned country by country. -
Big Banks Flush with Cash:
After passing stress tests, major banks raised dividends and announced buybacks:
• JPMorgan: $1.50 dividend, $50B buyback
• Bank of America: +8% dividend
• Wells Fargo: +12.5% dividend
• Goldman Sachs: +33% dividend
• Citigroup: +7% dividend
• Morgan Stanley: $1 dividend increase, $20B buyback -
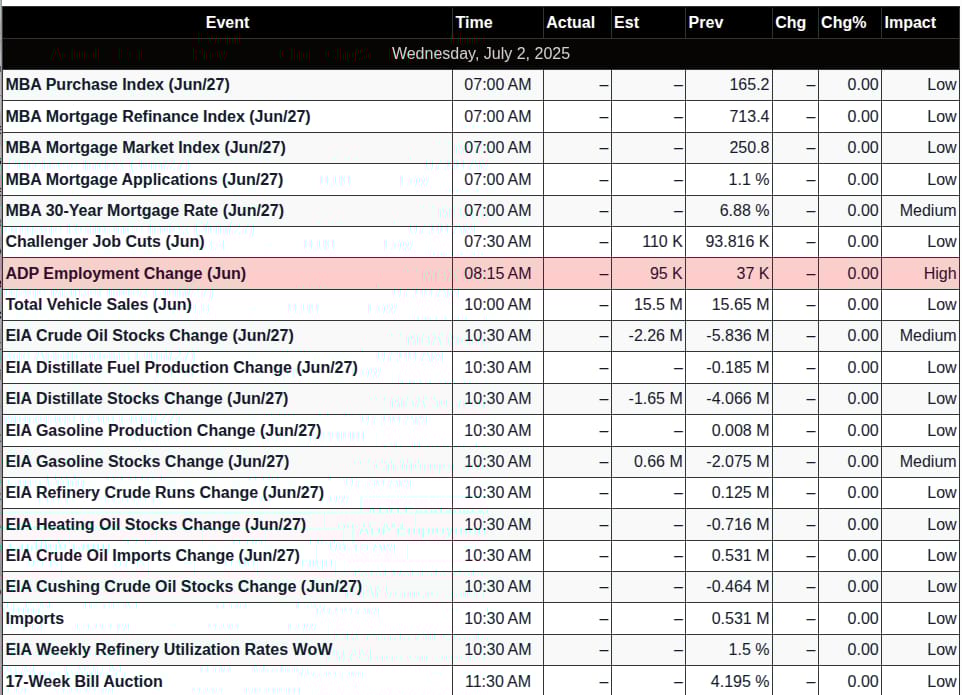
Economic Calendar:
• 8:15am ET – ADP Non-Farm Employment Change (key preview of June jobs report)
• 10:30am ET – Crude Oil Inventories -
Market Conditions:
S&P 500 remains near all-time highs. 5-day average daily range dropped sharply from 90 to 44 points. Light overnight volume and bearish whale bias into the ADP report. -
Key ES Levels:
• Resistance: 6401/6404
• Support: 6059/6062, 6023/6026, 5617/5622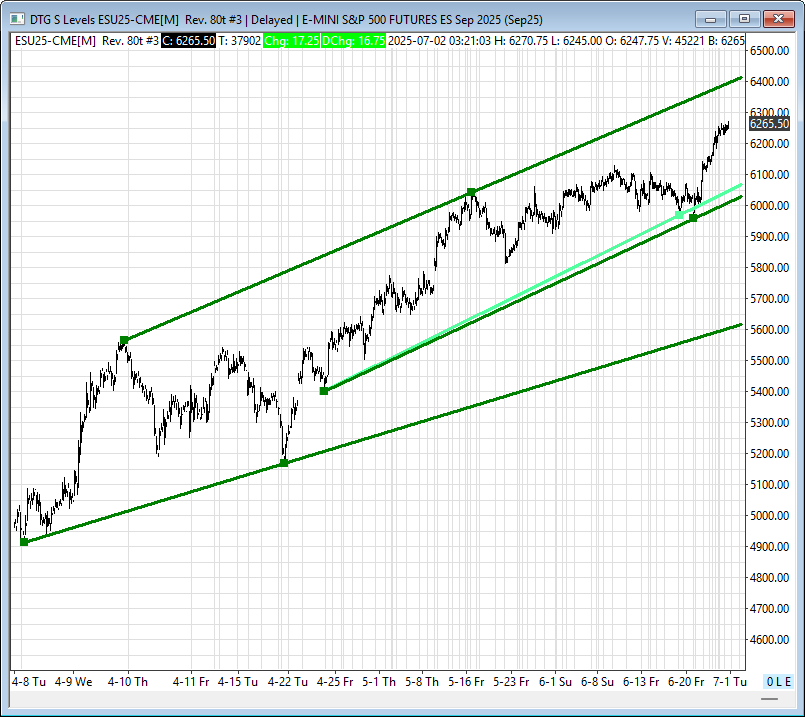
Affiliate Disclosure: This newsletter may contain affiliate links, which means we may earn a commission if you click through and make a purchase. This comes at no additional cost to you and helps us continue providing valuable content. We only recommend products or services we genuinely believe in. Thank you for your support!
Disclaimer: Charts and analysis are for discussion and education purposes only. I am not a financial advisor, do not give financial advice and am not recommending the buying or selling of any security.
Remember: Not all setups will trigger. Not all setups will be profitable. Not all setups should be taken. These are simply the setups that I have put together for years on my own and what I watch as part of my own “game plan” coming into each day. Good luck!
This post goes out as an email to our subscribers every day and is posted for free here around 2 PM ET. To get your real-time copy, sign up for the free or premium version here: Opening Print Subscribe.
Comments are closed