This post goes out as an email to our subscribers every day and is posted for free here around 2 PM ET. To get your real-time copy, sign up for the free or premium version here: Opening Print Subscribe.
S&P 500 Melt Up and the 4th of July Shortened Week
Follow @MrTopStep on Twitter and please share if you find our work valuable!
Our View
There is an old saying that markets are born on pessimism, grow on skepticism, mature on optimism, and die on euphoria. The time of maximum pessimism is the best time to buy, and the time of maximum optimism is the best time to sell.
Well, I think that sounds right. The ES and NQ could not have looked worse on April 7, but 61 trading days later, the ES has rallied 28.8% and the NQ has rallied 35.9% after falling into bear market territory.
If you recall, I did a big piece about what happens when the S&P falls +20% and posted the bullish stats surrounding those declines, but I must admit, I didn’t buy and hold. Why? Because I didn’t follow my own work.
Part of the rally yesterday saw the S&P and NASDAQ reach fresh record highs after Tuesday’s decline, when Trump’s tax bill squeaked through the Senate. On Wednesday, Trump said he struck a deal with Vietnam that will allow American goods to enter the country duty-free, while Vietnamese goods would face a 20% tariff under the new agreement. He also raised the prospect of imposing unilateral tariffs on countries that do not strike a deal by the July 9 tariff deadline.
I told the PitBull that I think the markets are still going higher—maybe a lot higher—and that as we get closer to July 9, the markets will start reacting to all the headlines leading up to the deadline and after.
It’s been easy for the bulls. The move up and the lower summer volumes have made it very easy to push the stock market higher, and I think this will continue. But I also expect to see some selling show up as we get closer to Trump’s tariff deadlines.
Reminder: Markets close at 1:00 PM today and are closed tomorrow for Independence Day
Our Lean
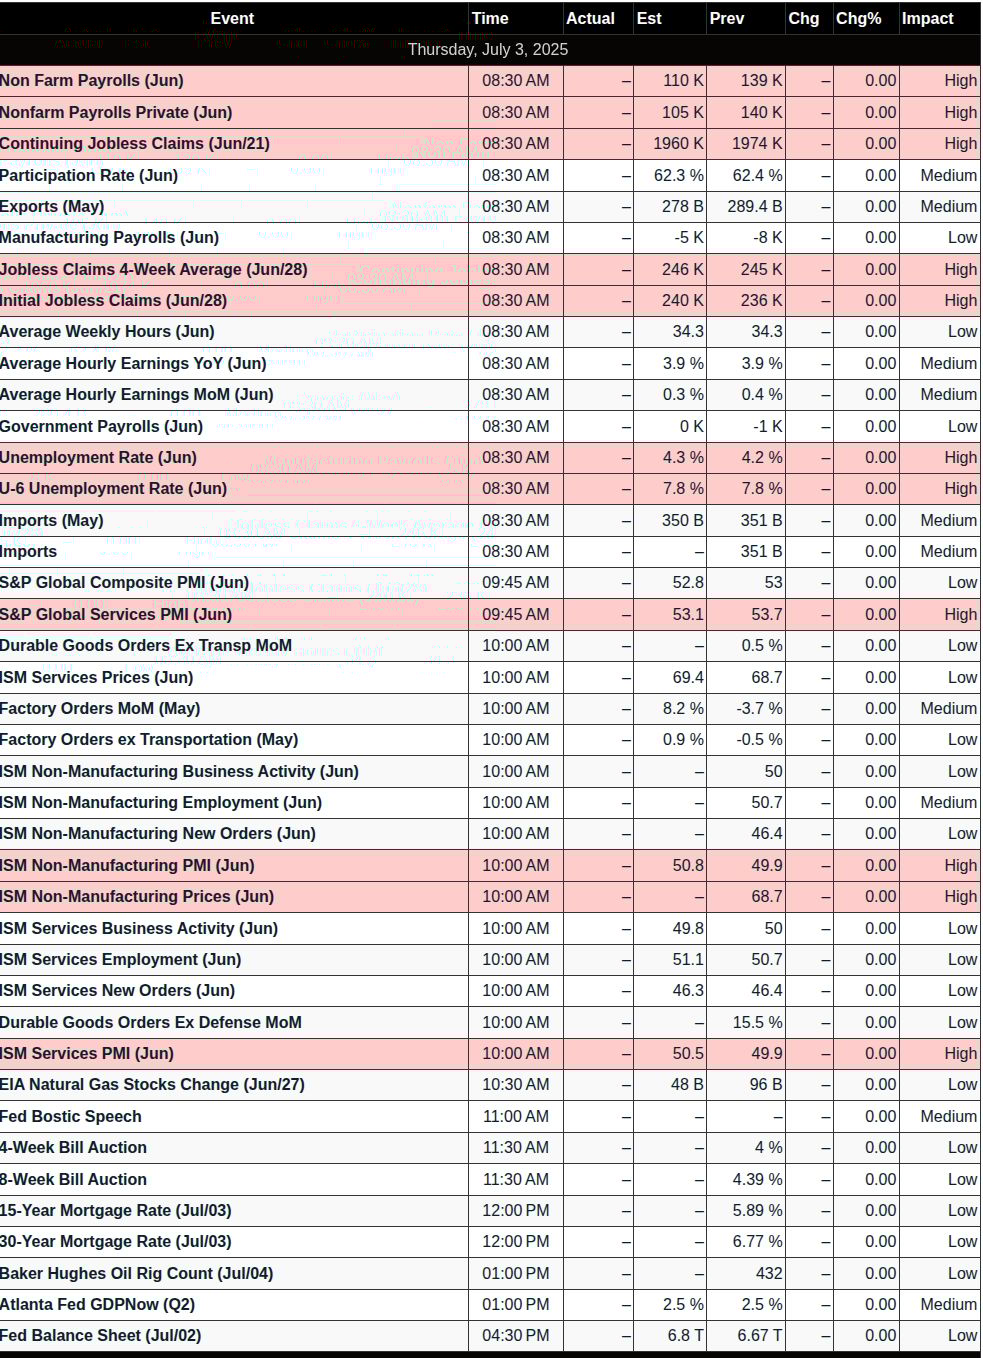
The markets are closed on Friday for the 4th of July holiday. That means the June jobs number and the week-one options expirations are scheduled for today.
Goldman Sachs is forecasting a below-consensus non-farm payroll of 85k, which is noticeably lower than the 113k consensus. There is $2.9 trillion in options expiring today.
My guess is that with a record 72.2 million people traveling 50 miles or more over the 4th of July holiday, we could see another round of “thin to win.” Should the ES gap lower, my lean is to buy the open. If the ES gaps sharply higher and moves above 6290, I would look to sell the open, cover, and look for a place to get long again. Keep an eye on 6299.
Below are some very good @Handelstats studies. As I have said in the past, Rich’s work has really improved since he started using AI to help with some of the coding he does. He wants to make it very clear that he still does most of the coding himself, but AI has lowered the number of hours he works and has increased his productivity.
NDX, S&P 500, July NFP Studies – Rich Miller, @Handelstats
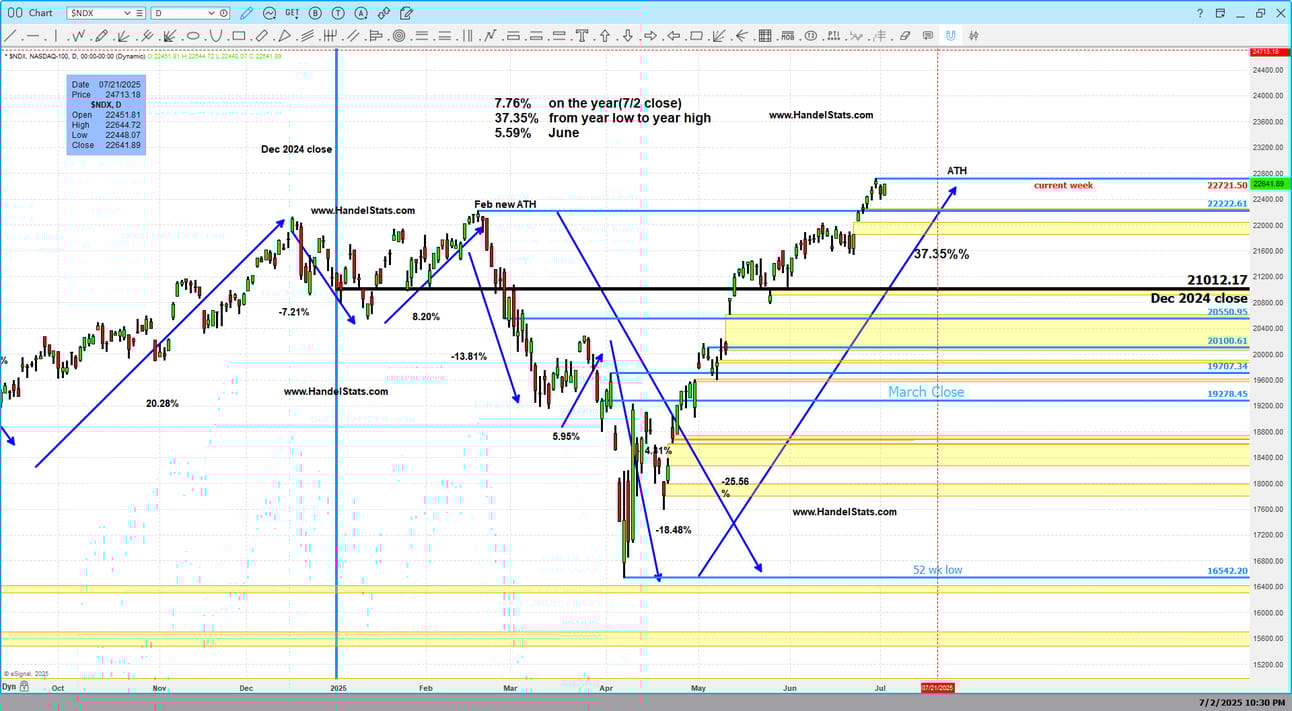
📊 NDX Update (Nasdaq 100) – July 2, 2025 Close
📅 YTD Gain: +7.76%
📈 June Performance: +5.59%
🚀 From 2025 Low to July High: +37.35%
After bottoming in April with a sharp -25.56% drawdown from the February highs, the Nasdaq 100 has exploded higher, reclaiming its all-time highs and surging 37% off the lows.
📌 The index is now nearly +8% on the year, with tech leadership firmly back in control. Watch for potential support near 22,222 and key levels below at 21,012 and 20,101 if pullbacks occur.
Momentum favors continuation — for now.
#NDX #Nasdaq100 #TechStocks #MarketUpdate #HandelStats #AllTimeHighs
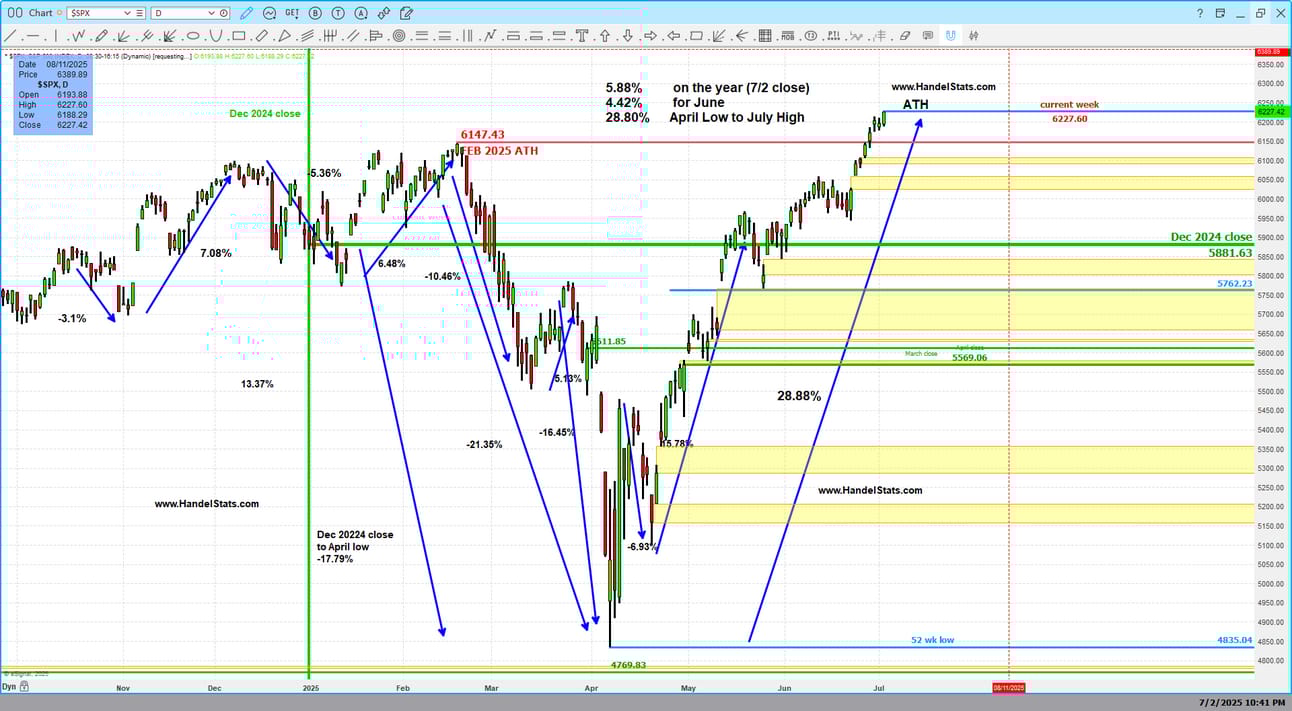
📈 S&P 500 Snapshot (as of 7/2/25 Close)
✅ +5.88% YTD
✅ +4.42% in June
🚀 +28.80% rally from April lows to July high
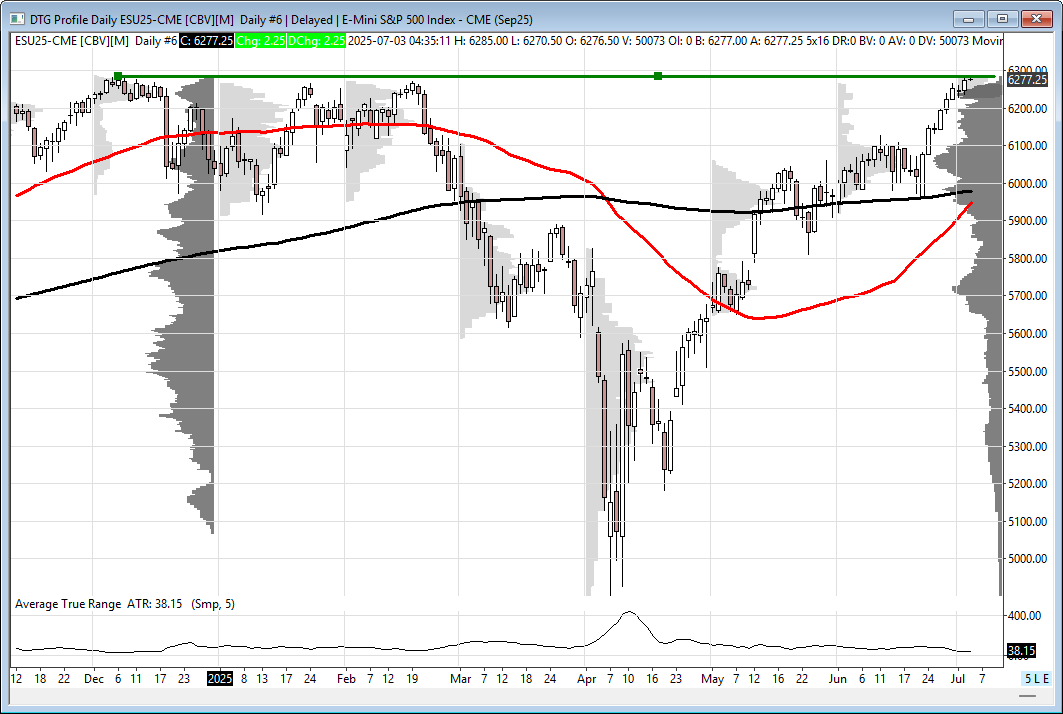
After a sharp 17.79% correction (December close to April low) into April, the SPX has surged to new all-time highs, marking one of the strongest post-correction rallies in recent years.
👉 The path of least resistance remains up unless key support zones near 6111 and 5881 give way.
#SPX #StockMarket #AllTimeHigh #MarketRally #TechnicalAnalysis #HandelStats
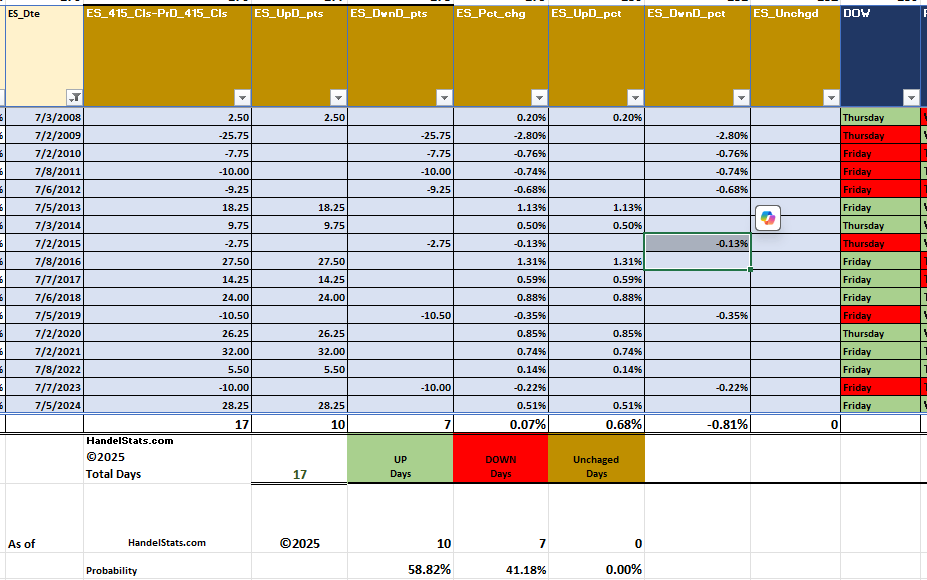
July NFP Playbook: Bullish Bias with Limited Downside
The July Non-Farm Payroll (NFP) release has historically offered a favorable setup for ES traders. Since 2008, the ES has closed higher on 10 of the past 17 July employment days (58.82% positive rate). However, zooming in on the last 10 years, that win rate jumps to 70% (7 of 10).
More importantly, the down days have been shallow, suggesting limited risk on the short side. For example, in the last decade, all negative sessions closed with modest losses — generally under 0.4%. On the flip side, several upside reactions have posted gains of 0.7% or more.
This asymmetric behavior presents a tactical edge:
Bias: Bullish tilt into NFP
Downside: Historically muted
Upside potential: Often exceeds 0.75%
Volatility note: Larger ranges are possible if payrolls surprise vs consensus
Strategy Consideration: Long-biased setups into NFP or post-dip recovery entries have historically provided favorable risk-reward. Options traders may explore call spreads or directional trades with tight stops, while futures traders could position around key support levels from prior sessions or VWAP zones.
Stay alert for headline risk, but history favors bulls into July NFP.
MiM and Daily Recap
Intraday Recap
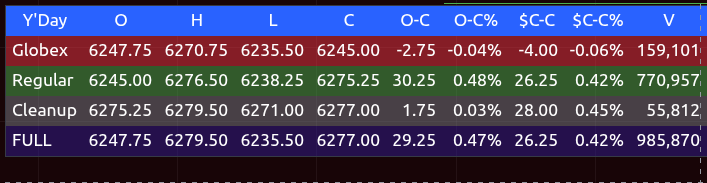
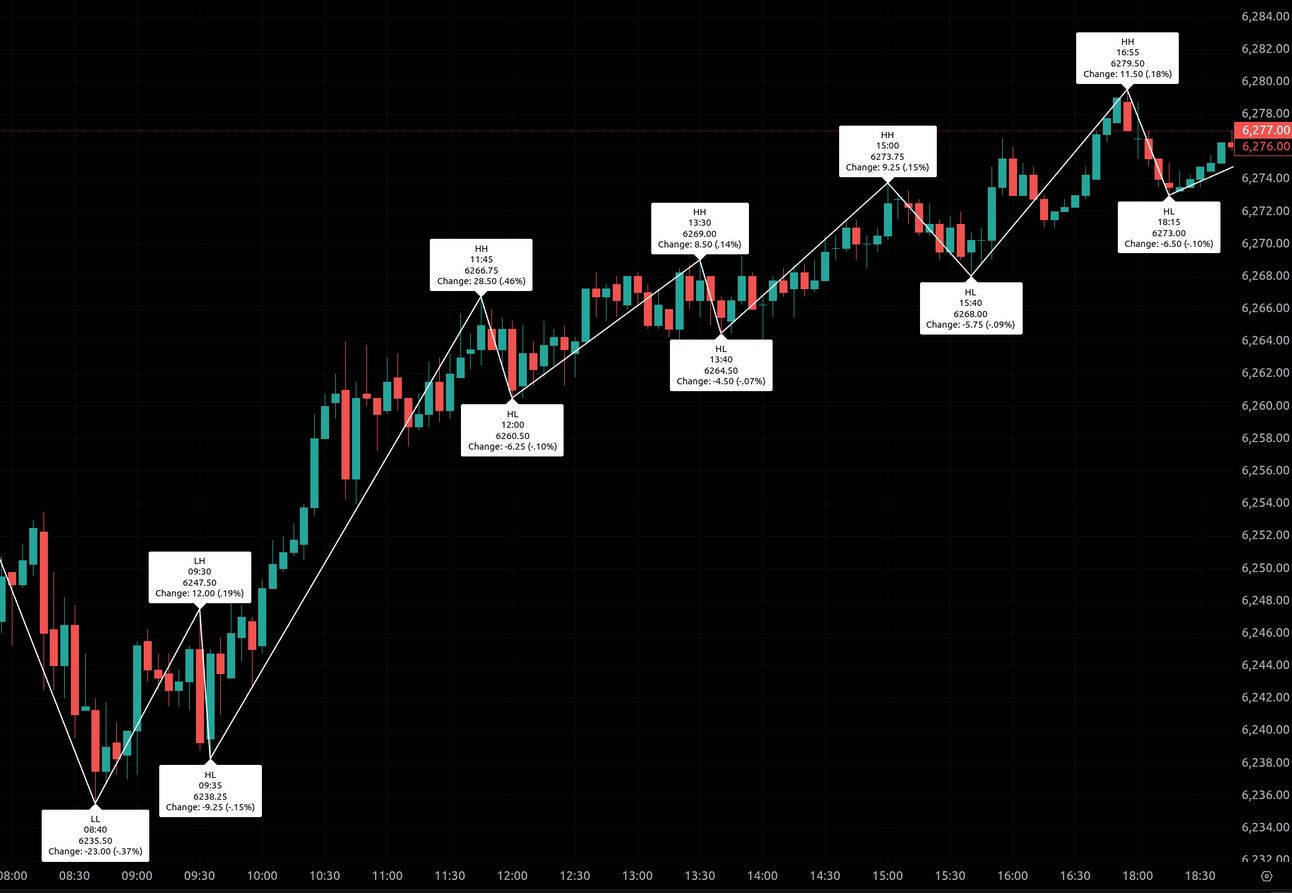
The session opened on Wednesday with a soft overnight Globex tone. Prices began the overnight session at 6247.75 before dipping to a Globex low of 6235.50, marking a decline of 12.25 points from the open. As the cash market opened at 9:30 AM, ES had already recovered, printing 6247.50.
A strong early push unfolded after the open, driving prices to 6267.75 by 11:45 AM. This advance represented a 28.5-point gain (+0.46%) off the earlier session low. A midday retracement occurred shortly after, with ES slipping to 6260.50 at 12:00 PM, trimming 6.25 points (-0.10%).
From that midday dip, buyers regrouped, sending the index to a fresh intraday high of 6269.00 at 1:30 PM. This move added another 8.5 points (+0.14%). A brief retracement followed, reaching 6245.00 by 1:40 PM, down 4.5 points (-0.07%).
Momentum then picked up strongly into the midafternoon as the index advanced to the day’s regular session peak of 6273.75 at 3:00 PM, notching a 9.25-point gain (+0.15%) from the preceding pullback. However, profit-taking soon emerged, and prices faded to 6268.00 by 3:40 PM, off 5.75 points (-0.09%).
During the late afternoon cleanup session, ES climbed again to register an ultimate high of 6279.50 at 4:55 PM. This marked an 11.5-point rally (+0.18%) from the prior dip.
In total, the full session settled at 6277.00, representing a gain of 26.25 points (+0.42%) from the previous cash close. From the day’s open to close, ES advanced 29.25 points (+0.47%).
Volume began looking more seasonal, trading 770,957 contracts, while Globex turnover was comparatively lighter at 159,101 contracts.
Market Tone & Notable Factors
The tone throughout Wednesday was broadly constructive. Early weakness was met with persistent buying interest that carried steadily through the cash hours. The sequence of higher highs and higher lows underscored a sustained bullish bias, especially as each intraday dip was met with renewed demand.
No Market-on-Close (MOC) imbalance data was available due to technical issues affecting MiM reporting. This absence of MIM readings removed one layer of directional cues during the final hour, leaving price action more reactive to discretionary flows rather than programmatic buy or sell imbalances.
Despite the lack of closing imbalance data, the market maintained upward traction into the settlement, with the final cleanup print of 6277.00 holding near the day’s highs. This positioning suggests buyers remained engaged into the close, potentially carrying momentum into the next session.
Overall, Wednesday’s trade reflected solid underlying demand and positive sentiment, reinforced by a strong open-to-close advance and broad participation across the day’s swings. Traders will be watching whether this bullish posture sustains on Thursday as the market continues to probe fresh highs.
Guest Posts:
Dan @ GTC Traders
A Warning for New and Aspiring Traders …
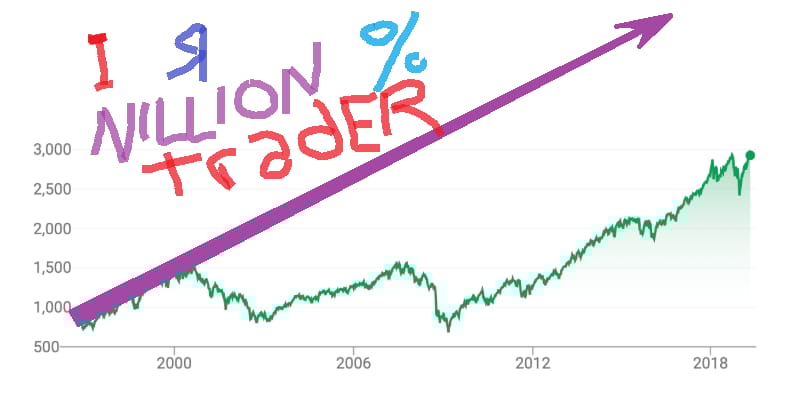
As the forever market continues higher, as we find ourselves in a world where benchmarks pile higher and standard metrics for valuation begin to surpass 2σ, let me tell you what I can recall from 2000 and what typically happens when the benchmark has a great single year that … generally … is when you start to see people fudge performance.
In my time, I have seen many, many, many tricks … wherein people try to ‘arrange’ performance metrics to look ‘better’. Better than what? Better than reality and better than what is accepted in the industry. That, in and of itself, is a tell. It’s a tell that the person in question doesn’t realize how seriously SROs and those you report to … take accuracy. Which in itself is a tell that ones ever sat through an audit and know anything ABOUT performance metrics in the first place … much less what is ethical.
I’d say 75% of the time? It’s a lack of knowledge of how to do it accurately, and ethically. But there is a 25% … and it’s usually found in trading education? That’s when you see the ‘tricks’ show up. And it is without question intentional.
Cash accounts that aren’t properly cross-margined and specified as such … are using far more cash than even a business margin would be allowed to use without getting a margin hit. Assuming allowances of what would even be permitted in a PORTFOLIO MARGIN account, for any cash equity transactions. I’ve seen people try to take programs, and SUM the performance of different trading programs; rather than properly registered from how the buying power is allocated and permitted by a broker.
“LOOK! I’m up 40% in 3 months with all the trading programs!” (Not that 40% is in itself impossible. It’s not, and has been done thousands of times. But a higher number generally garners a closer look from someone who can allocate because it IS possible. And that’s when the bologna surfaces on closer inspection ) .. or they start reporting performance on margin for single trades instead of program total on total capital. “Look, I’m up 84% this month”. And then you take a closer look … and you find out they are not up 84%. They returned 84% on a great binary trade from the MARGIN outlay or they have a capital contribution scheme, and are counting capital they added in.

Good grief.
There are many more little tricks than that … and often? You find a COMBINATION of much of the above! LOL. They’re basically using what amounts to Portfolio Margin (or in excess of it … to newer and aspiring RETAIL traders mind you … privileges a typical retail trader couldn’t gain access to in a BILLION years) while counting the capital they add in, and counting binary trades, or worse performance on margin outlay w/o specifying. ALL of the above!
Point being … all of the above comes from the human need to shine, which all comes down to ego.
Regardless, this entire article has been for the benefit of new and aspiring retail traders. Know that as this trend continues? The convexity to the bologna out there regarding returns WILL go through the roof.
All of this has happened before. All of this will happen again.
Or … as Hooverphonic now sings?
“Fake is the new dope … fake is the new hope. We all live … in a plastic world”
Until next time, stay safe … and trade well.
Technical Edge
Fair Values for July 3, 2025
-
S&P: 49.42
-
NQ: 207.69
-
Dow: 296.21
Daily Breadth Data 📊
For Wednesday, July 2, 2025
-
• NYSE Breadth: 71% Upside Volume
• Nasdaq Breadth: 75% Upside Volume
• Total Breadth: 75% Upside Volume
• NYSE Advance/Decline: 73% Advance
• Nasdaq Advance/Decline: 68% Advance
• Total Advance/Decline: 70% Advance
• NYSE New Highs/New Lows: 122 / 12
• Nasdaq New Highs/New Lows: 202 / 63
• NYSE TRIN: 1.09
• Nasdaq TRIN: 0.66
Weekly Breadth Data 📈
For the Week Ending Friday, June 27, 2025
-
• NYSE Breadth: 58% Upside Volume
• Nasdaq Breadth: 60% Upside Volume
• Total Breadth: 59% Upside Volume
• NYSE Advance/Decline: 72% Advance
• Nasdaq Advance/Decline: 66% Advance
• Total Advance/Decline: 68% Advance
• NYSE New Highs/New Lows: 216 / 80
• Nasdaq New Highs/New Lows: 465 / 275
• NYSE TRIN: 1.86
• Nasdaq TRIN: 1.24
S&P 500/NQ 100 BTS Trading Levels (Premium Only)
/
BTS Levels:
ESU2025
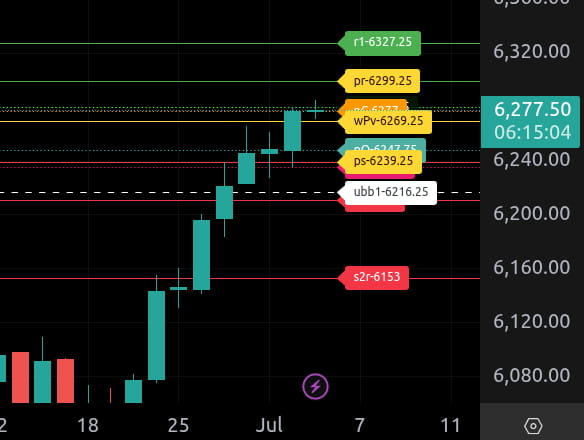
The bull/bear line for the ES is at 6269.25. This is the key level that must be held for bullish momentum to persist. Above this level, buyers are favored intraday.
Currently, ES is trading around 6277.50, showing strength above the bull/bear line. If the price maintains above this level, the next upside target is 6299.25, our upper range target for today. A push above that could lead to a test of the 6327.25 resistance area.
On the downside, initial support comes in at 6247.75. Below that, watch for further weakness towards 6239.25 and 6235.50. A break below these levels could drive price towards 6216.25 and then the lower range target of 6211.00.
Overall, holding above 6269.25 keeps the short-term trend bullish, with buyers targeting 6299.25 and higher. A sustained move below 6239.25 shifts the bias back to the downside, with risk of testing deeper support zones.
NQU2025
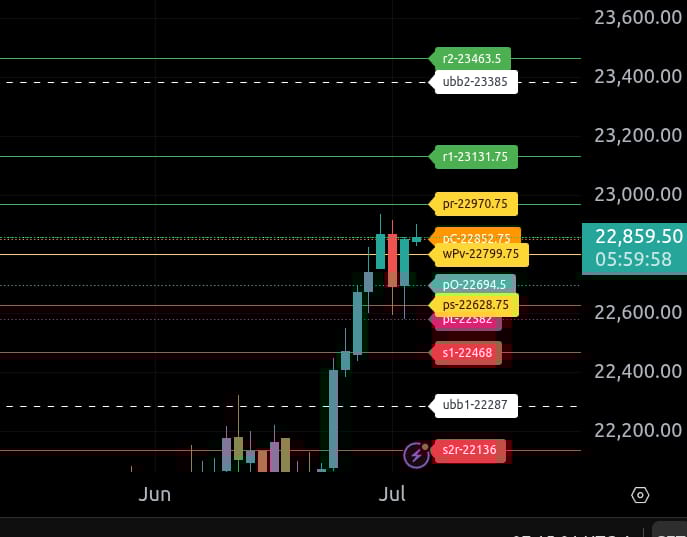
The bull/bear line for the NQ is at 22,799.75. This is the key level that must be reclaimed for bullish momentum to resume. Above this level, we look for potential buying opportunities on dips.
Currently, NQ is trading around 22,850.50, indicating strength above the bull/bear line. If the price can hold above this zone, the next upside resistance comes in at 22,852.80 and then at 22,970.80, our upper range target for today. A break and sustained trade above these levels could open the door to a move towards 23,131.75.
On the downside, immediate support is seen near 22,694.50, followed by 22,628.75 and then the lower range target at 22,468.00. A failure to hold above the bull/bear line would likely lead to tests of these support levels.
Overall, the trend leans bullish as long as NQ holds above 22,799.75. Should the market slip below this line, caution is warranted, and sellers may regain control, targeting deeper retracements toward 22,468.00.
Trading Room News:
Polaris Trading Group Summary: Wednesday, July 2, 2025
Morning Session Highlights:
-
Pre-market context:
-
ADP data showed the biggest drop in service jobs since COVID, increasing rate-cut expectations (July cut odds rose to 27%).
-
This macro backdrop set the tone for potential volatility.
-
-
Daily Trade Strategy (DTS) Execution:
-
Precision Strike: The market hit both the upper target zone (6265–6270) and the lower target zone (6240–6235) early on.
-
NQ Open Range Long:
-
PTGDavid called an AR LONG trade setup.
-
All upside targets were fulfilled, offering traders a clean, structured opportunity.
-
Price retested 6265 later, reacting precisely at the projected resistance.
-
-
The best move of the day happened in the morning, after which price consolidated.
-
Educational Focus:
-
Solid refresher on Fibonacci retracements, DLMB structure, and managing bias around precision levels.
-
Emphasis on patience (Sabr)—waiting for setups rather than forcing trades.
-
Reminders about flexibility: even during consolidation, staying prepared if levels break.
Technical Issues:
-
Audio dropped briefly but was quickly restored.
-
Some traders had to refresh or log out/in to get charts back up.
Afternoon Session:
-
Lunch break: Market continued in consolidation.
-
Late day note: Market-on-close (MOC) imbalance of $1.4 billion to buy, though no additional active trade calls were highlighted.
Positive Trades:
-
The NQ Open Range Long trade was the standout winner, with all targets achieved cleanly.
-
The DTS levels were highly accurate, demonstrating the power of preparation and structured trade planning.
Lessons Learned:
-
Discipline pays off: Best moves often occur early—be ready and then respect midday chop.
-
Know your levels: Price repeatedly reacted precisely at forecast zones.
-
Stay patient: After morning moves, consolidations can drain focus—step away and re-engage only if new signals emerge.
DTG Room Preview – Thursday, July 3, 2025
-
Early Close Today: U.S. stock markets close at 1:00pm ET ahead of the July 4 holiday.
-
Jobs Report in Focus: The June Jobs Report (8:30am ET) is highly anticipated after soft ADP numbers and weak JOLTs data. Markets are increasingly pricing in two rate cuts for 2025.
-
Trade & Politics: President Trump announced a second trade deal with Vietnam, reducing tariffs on Vietnamese goods to 20%. The House advanced his “big beautiful bill” overnight with a final vote expected today.
-
Economic Calendar:
-
8:30am ET – Unemployment Claims, Trade Balance
-
9:45am ET – S&P Global Services PMI
-
10:00am ET – ISM Services PMI, Factory Orders
-
11:00am ET – Fed’s Bostic speaks from Frankfurt
-
-
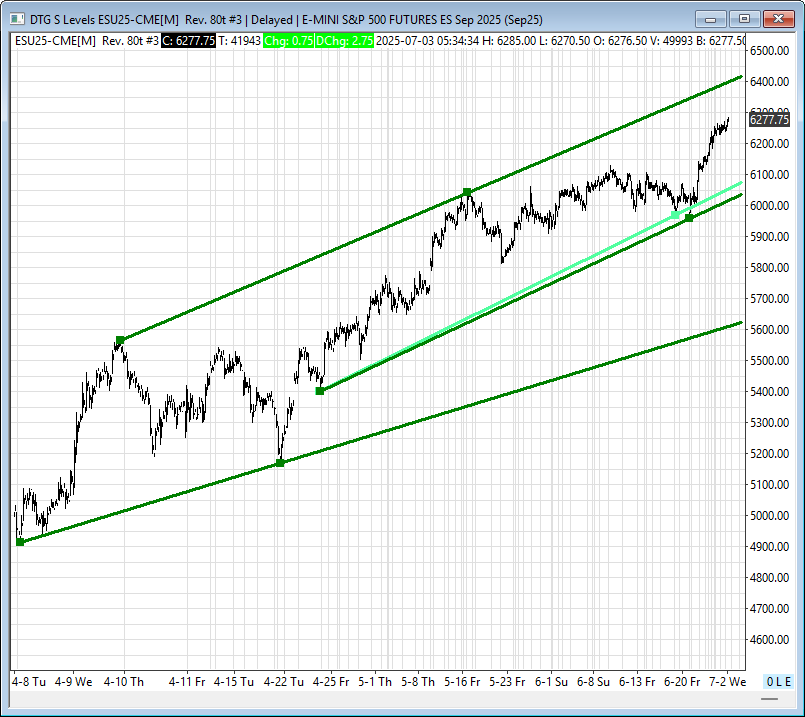
Market Technicals:
-
ES bounced off its Dec 6 back-adjusted all-time high (6285.75).
-
Potential trendline resistance: 6407–6410
-
Potential trendline supports: 6065–6058, 6030–5963, 5626–5631
-
-
Volatility: Slight uptick Wednesday, but expected to ease into the long weekend (5-day ES average range: 47 points). No significant overnight large trader activity noted.
Calendars
Economic Calendar Today
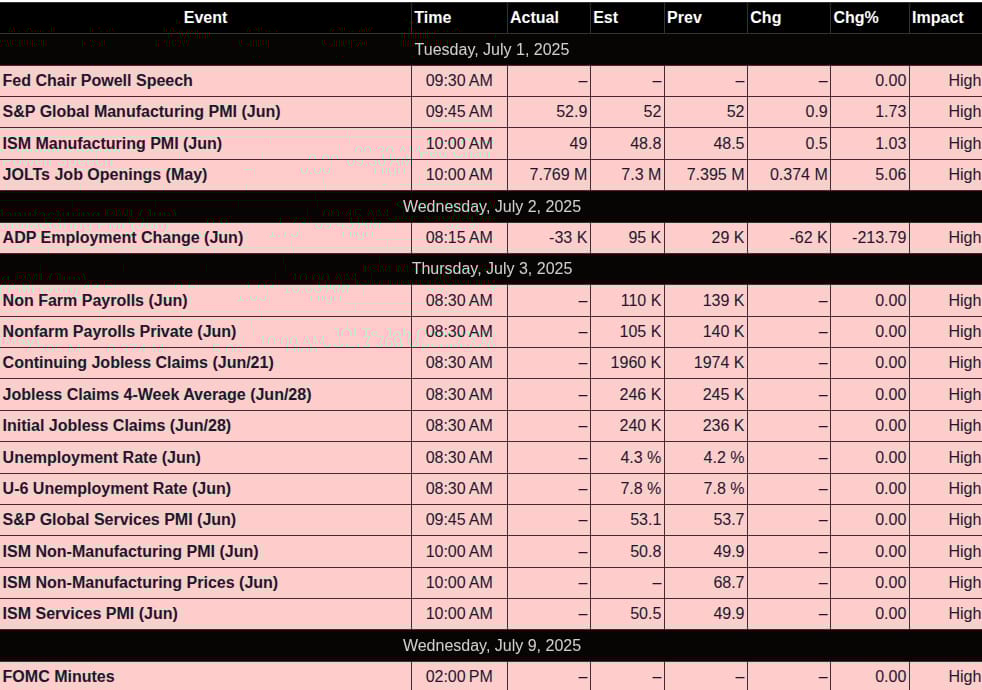
This Week’s High Importance
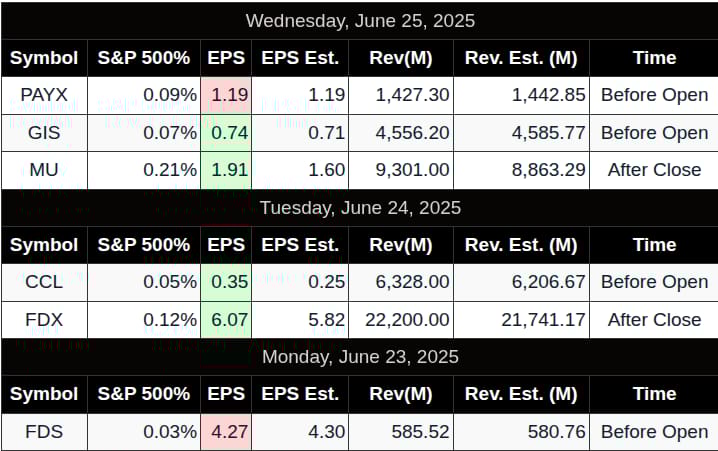
Earnings:
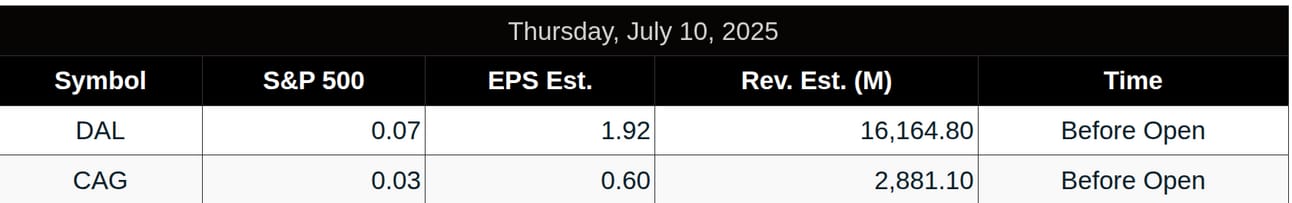
Released
Good grief.
Affiliate Disclosure: This newsletter may contain affiliate links, which means we may earn a commission if you click through and make a purchase. This comes at no additional cost to you and helps us continue providing valuable content. We only recommend products or services we genuinely believe in. Thank you for your support!
Disclaimer: Charts and analysis are for discussion and education purposes only. I am not a financial advisor, do not give financial advice and am not recommending the buying or selling of any security.
Remember: Not all setups will trigger. Not all setups will be profitable. Not all setups should be taken. These are simply the setups that I have put together for years on my own and what I watch as part of my own “game plan” coming into each day. Good luck!
This post goes out as an email to our subscribers every day and is posted for free here around 2 PM ET. To get your real-time copy, sign up for the free or premium version here: Opening Print Subscribe.
Comments are closed