This post goes out as an email to our subscribers every day and is posted for free here around 2 PM ET. To get your real-time copy, sign up for the free or premium version here: Opening Print Subscribe.
AAPL Up 5% In One Day
Follow @MrTopStep on Twitter and please share if you find our work valuable!
Our View
Nikkei 225 +0.65%
Hang Seng +0.69%
CAC +1.3%
DAX +1.7%
FTSE +1.17%
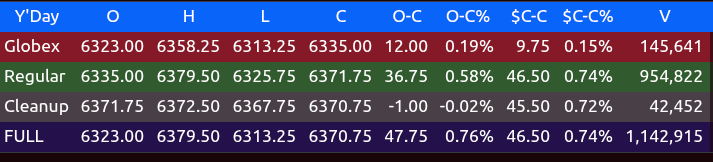
Globex High: 6358.25
Globex Low: 6313.25
9:30 Open: 6335.00
Day High: 6379.50
Day Low: 6325.75
3:50 Imbalance: 2.9 to sell
4:00 Print: 6371.75
5:00 Close: 6370.75
Total Volume: 1.14 million
WANT TO KNOW WHERE THE S&P IS GOING? FOLLOW THE MONEY
You can’t beat the ES and NQ with a stick. The index markets had a 4-day selloff that eclipsed last Friday. After being down hard at the end of the week, the ES and NQ shook off the extremely bad employment data and did what they do best: take bad news and make good of it.
People always ask me, “Why are the S&P and Nasdaq going up so much?” I always say, if you want to know where the S&P is going, follow the money flows and rotations.
If you want to learn more about how to follow the money, try the MrTopStep NYSE 3:50 cash imbalance meter. You can see how money flows in and out of different sectors. I suggest you follow this link: Market Imbalance Meter
ETF Inflows Snapshot
June
ETF inflows hit $97.8B in June—the largest monthly total since February, when inflows were $110.8 billion. That brings year-to-date inflows to $556.4 billion. At this pace, ETFs are on track to surpass $1 trillion in annual inflows for a second year in a row.
Strong performance across financial markets helped fuel the surge. U.S. stocks climbed to new record highs during the month, while bond markets stabilized after a rocky spring. Investor interest was spread across asset classes:
-
U.S. equity ETFs: $26.7 billion
-
U.S. fixed-income ETFs: $22.6 billion
-
International equity ETFs: $28.6 billion
July
In July, U.S.-listed ETFs saw inflows of approximately $116 billion, the highest monthly total of the year, bringing year-to-date net inflows to $672.8–$683.3 billion.
-
U.S. equity ETFs: $52–$74.5 billion, driven by strength in the S&P 500 and Nasdaq-100, fueled by AI-related tech stock gains.
-
International equity ETFs: $24–$26.2 billion
-
U.S. fixed-income ETFs: $18.3–$26 billion
-
Currency ETFs (especially crypto-related): $11.8–$12.8 billion, with Bitcoin ETFs at $6 billion and Ethereum ETFs at $5.3–$5.4 billion
August
So far, August has seen U.S.-listed ETFs bring in approximately $70–$75 billion.
In the end, I bet most retail traders do not look at money flows—and I doubt most even know about the NYSE and NASDAQ 3:50 imbalances and the 4:00 cash close.
In terms of the ES’s and NQ’s overall tone, they acted firm all day, even when they sold off into and after the 3:50 imbalance, which showed $2.7 billion to sell. They still made new all-time highs on the 5:00 futures close.
ES overall trade, volume was low at 1.169 million contracts traded.
Brent crude futures settled 1.1% higher at $66.89 a barrel.
The VIX Cboe fell below 17, and the yield on the 10-year note edged higher after a $42 billion auction of new 10-year notes attracted lackluster demand. The yield rose to 4.219% from 4.196% on Tuesday.
APPLE rose 5% yesterday and is up another 2% in the after-market.
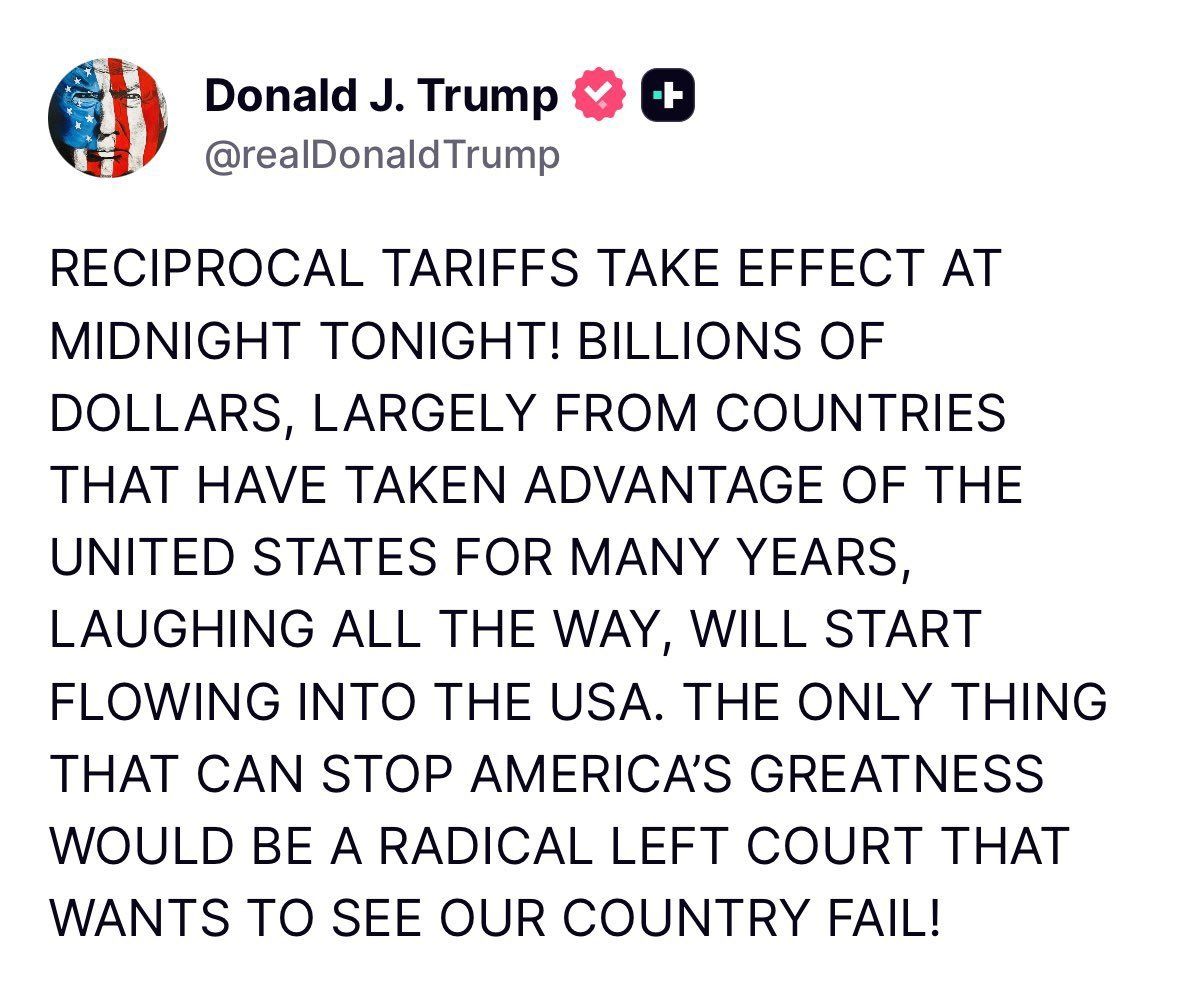
As Trump continued his tariff parade, he called for 100% tariffs on semiconductors and chips, stating he would impose a 100% duty on imported semiconductor chips—with the exception of companies “building in the United States.”
“We are going to be putting some very large tariffs on semiconductors, but the good news is for companies like Apple: if you’re building in the U.S. or have committed to build, without question, committed to build in the U.S., there will be no change.”
Taiwan Semiconductor Manufacturing Co. (TSMC) hit a new all-time high as shares rose 5% in premarket trading on Thursday after announcing it will not have to pay the 100% tariff on U.S. sales.
Our Lean
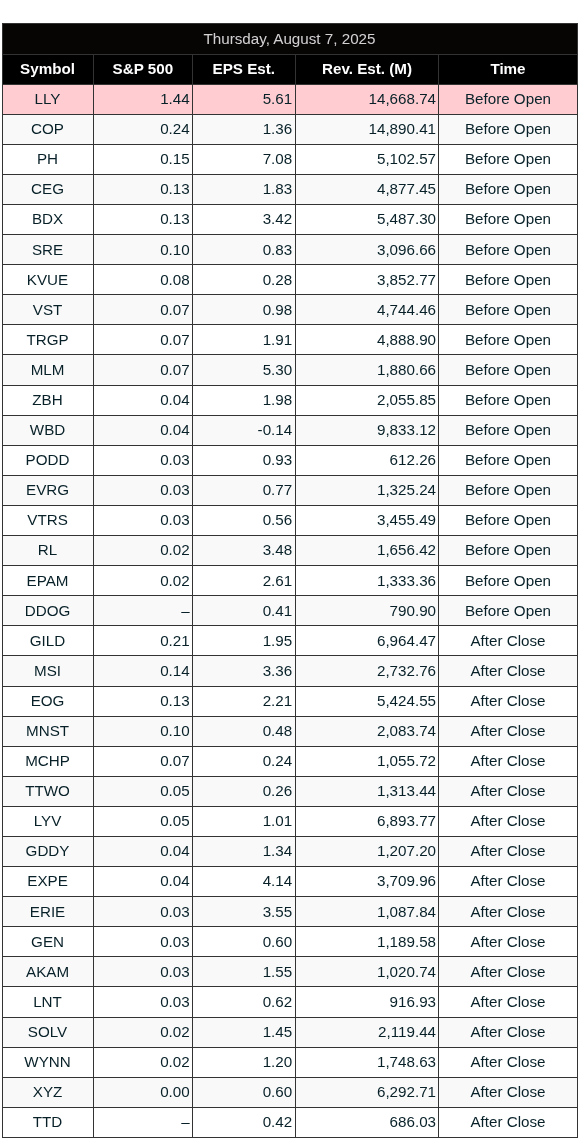
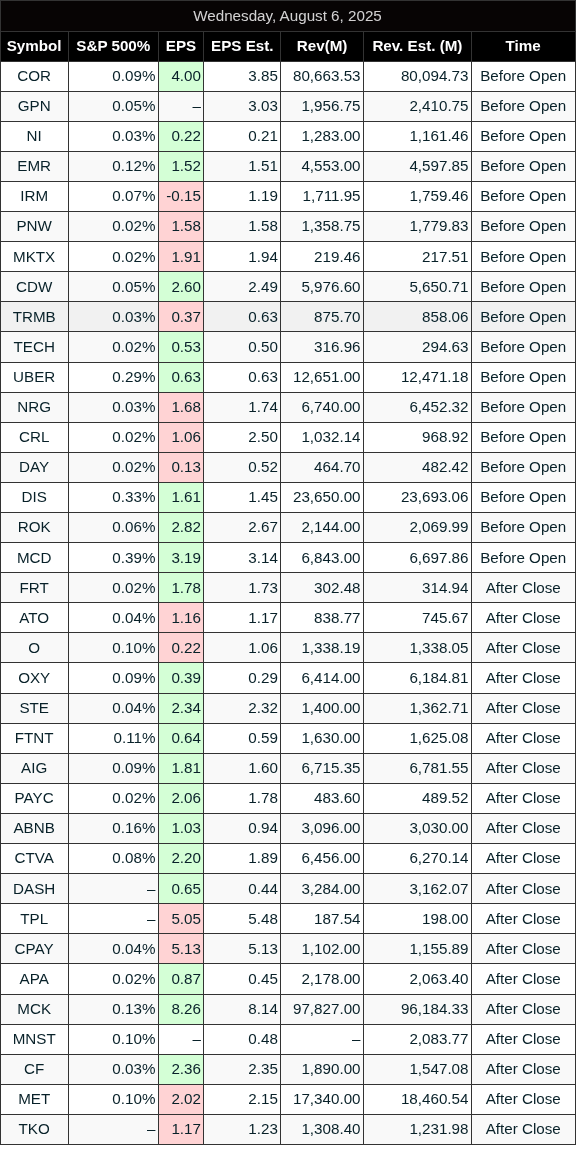
There are 4 economic reports and a 10:00 AM speech from Atlanta Fed President Raphael Bostic. A batch of earnings is due, including:
Pre-market: Eli Lily and Company, Toyota, Brookfield, Constellation Energy, and Datadog
Post-market: The Trade Desk, Conoco Phillips, Motorola Solutions, and Take-Two Interactive Software
Our lean: I am a bull. I am always a bull, and I should not forget it.
What we all have to understand is that liquidity outweighs the negatives. If you can maintain that idea during the downdrafts, you won’t get thrown off.
It’s 6:45 AM and the ES just traded up to 6426.75, up 0.90%, and the NQ is trading 23,626.25, up 1%.
Here’s how this goes today:
You can sell the open or the early rips and buy the pullbacks. Or just be patient and buy the pullbacks—especially if the ES and NQ are pulling back into the European close.
MiM and Daily Recap
Intraday Recap
The overnight Globex session began with weakness, dropping to a low of 6313.25 at 18:20 ET. A modest bounce followed, reaching a lower high at 6326.00 at 19:10 before another pullback to a higher low at 6316.00 by 20:00. From there, momentum shifted upward, and a steady rally carried ES to a Globex session high of 6358.25 by 03:50, a gain of 42.25 points (+0.67%). However, selling pressure resumed after the peak, leading to a series of lower highs and lows: 6343.75 at 07:10, 6331.75 at 06:50, and a final Globex low of 6330.75 at 08:10. The session closed at 6335.00, a 12.00-point gain (+0.19%) from the session’s open.
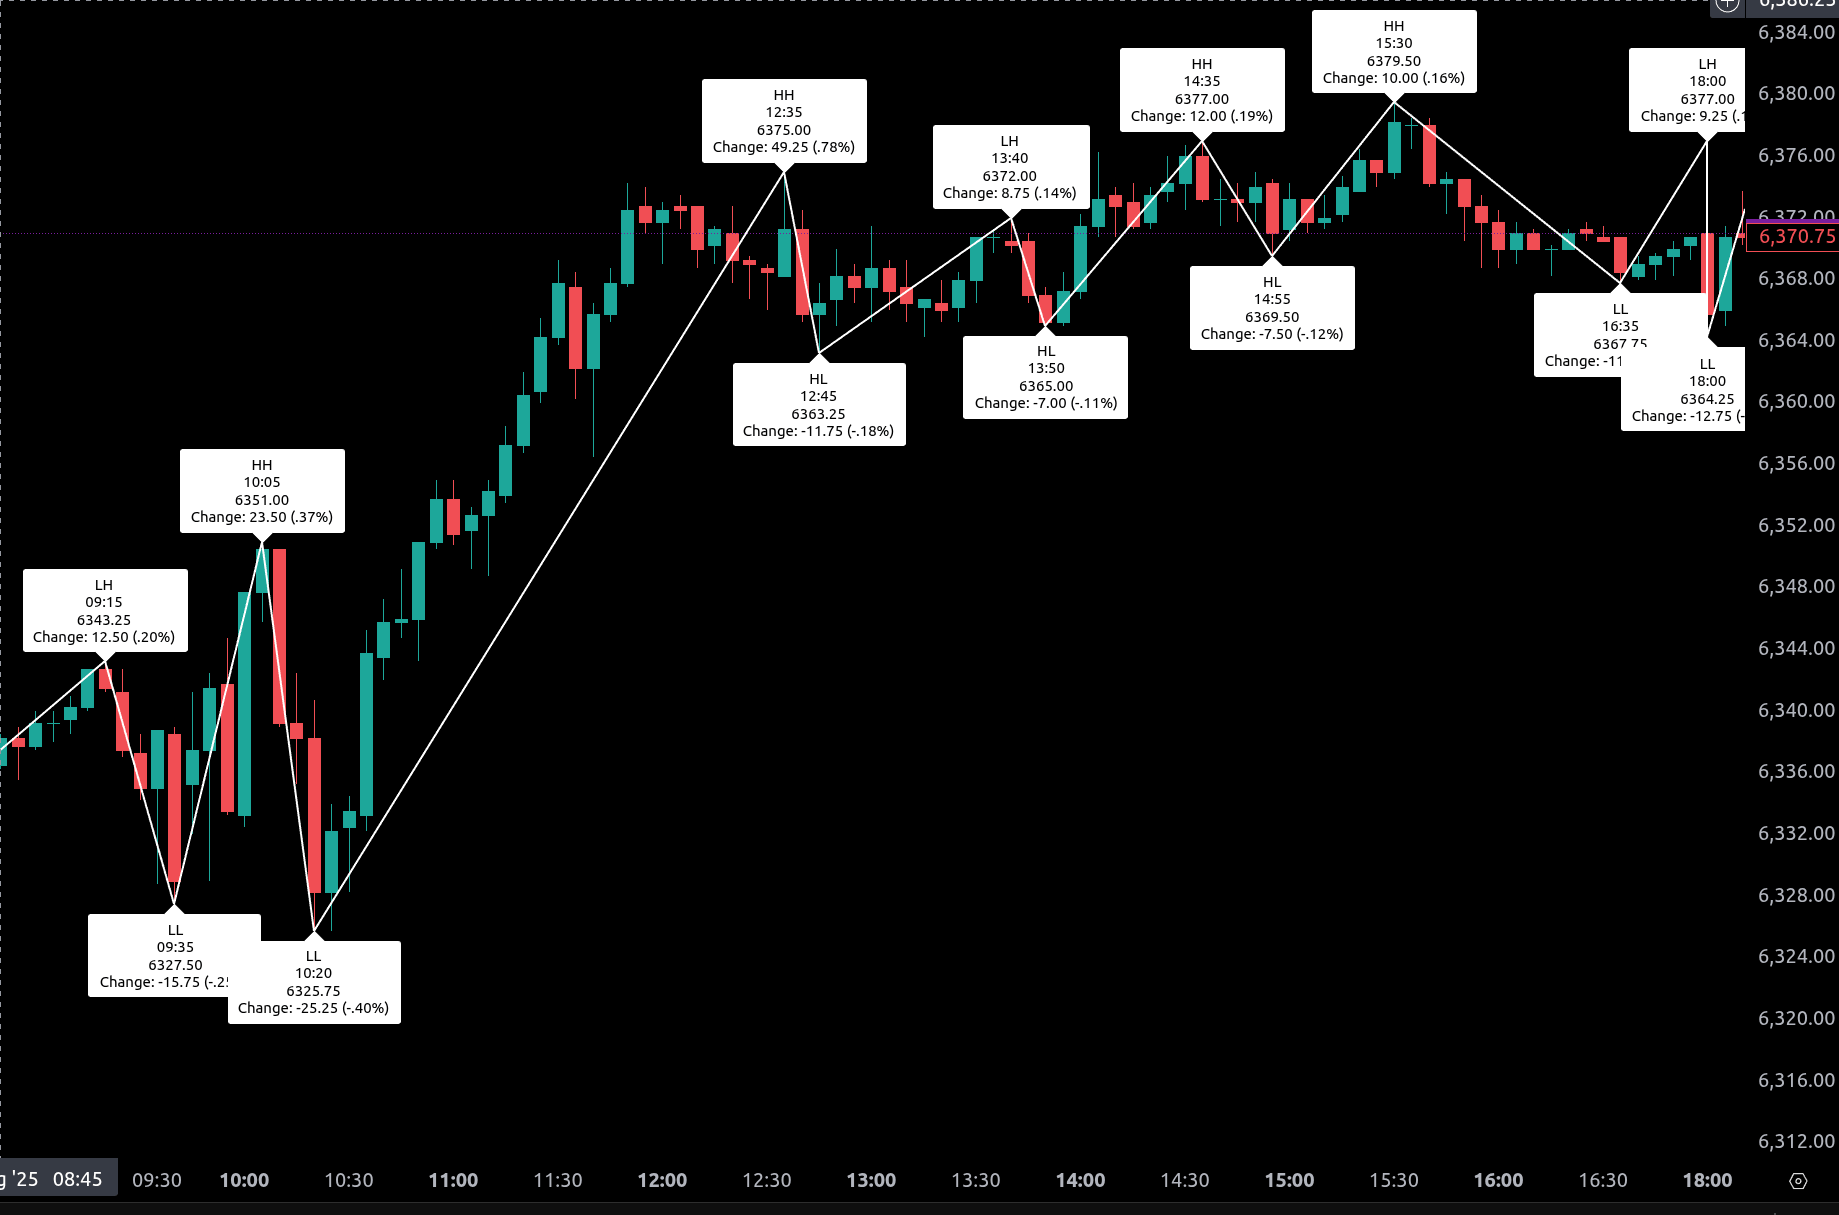
The regular session opened at 6335.00 and started with two quick drops to lows at 6327.50 (09:35) and 6325.75 (10:20), the latter setting the regular session low. After that, the bulls took charge. A sharp advance peaked at 6375.00 at 12:35, a 49.25-point run off the morning low (+0.78%).
From there, the market transitioned into chop. A midday dip to 6363.25 at 12:45 retraced part of the move before a smaller rally pushed ES to 6372.00 at 13:40. Another sequence of modest pullbacks and marginal highs followed: 6365.00 at 13:50, 6377.00 at 14:35, 6379.50 at 15:30, and a final push back to 6377.00 at 16:00 before sellers took over.
The closing sequence saw a sharp drop to 6364.25 at 18:00, but ES settled the session at 6371.75, up 36.75 points (+0.58%) from the regular open and 46.50 points (+0.74%) from the prior day’s close.
Market Tone & Notable Factors:
The tone of the session was bullish overall, marked by a strong intraday reversal and follow-through after early weakness. Despite overnight selling and some choppy action into the afternoon, the bulls maintained control, pushing ES to fresh highs late in the session.
Total volume for the day reached 1.14 million contracts, with the bulk of activity (954K) concentrated during regular hours. The steady midday grind higher lacked urgency but held firm support levels through minor pullbacks, suggesting dip-buying behavior remained intact.
The Market-on-Close (MOC) imbalance ended with -$3B to sell, and the symbol imbalance closed at 51.5% sell, below the 66% threshold for significance. This modest sell pressure into the bell had little impact on price, with ES finishing near the top end of its range.
In summary, the day featured an initial test of lower levels, followed by a resilient rally and constructive intraday structure. With ES closing just shy of the high, the session leaves a bullish footprint heading into the next trade day.
Guest Posts:
Dan @ GTC Traders
Linear Preference: Discretion to Chip Management
In the video entry that you can find here at this link, we discussed the reason and rationale as to why we are targeting a linear Return Profile.
At the same time, in the GTC Sample Portfolio’s Short-term Trading Account, we have begun to demonstrate two new quantitative strategies that work in tandem with one another.
The “Delta-Neutral Yield Arbitrage” Program on 10-Year Derivatives using ETFs. And the “Quad Trading Program” tuned to a linear target return profile.
These two programs are yielding good results. We have tested these programs through many decades of market data, and they have been thoroughly tested for robustness. And they have already returned 21 BPS and 164 BPS respectively, in the few short weeks we have been running them.
However, they only represent about 29% of the capital in the short-term trading account, and about 6% of the total portfolio.
Wait a minute?
If they have been performing so well, and are so well tested, why not have them represent a larger piece of the total portfolio?
Well, we’ll get there. We are slowly turning up the ‘knob,’ as it were, as to their percentage allocation within the portfolio.
But the question can remain: why do this at all? Why not simply have those two programs represent the majority of the short-term trading account?
The answer?
Anyone could definitely decide to do this. That is the choice of the individual trader.
We have decided to allocate the capital in the way we have to keep to our overall mandate of low month-over-month return volatility. As we slowly, over the months, increase the allocation to these programs, we can slowly build alpha in a controlled, linear manner. Keeping to our target for a linear return profile. If someone did not have those goals, they could simply allocate more of the capital to the programs.
Think of it this way. Think of it like chip management in playing a game of poker.
Chip Management as an Analogy
In poker, chip management is everything. Every player at the table has a stack of chips, and with each hand, they must decide how many to put into the pot. Do they go all-in on a strong hand to maximize their potential winnings? Or do they bet small, preserving their stack for future opportunities? It is a constant balancing act between risk and reward, guided by their strategy and goals for the game.
Trading is no different. Portfolio managers, like poker players, have a finite amount of capital, their ‘stack.’ Each strategy they deploy is like a hand they play. And just like in poker, they must decide how much of their stack to commit to any given strategy.
In our case, we are playing a measured game. By allocating just 29% of the short-term trading account to the “Delta-Neutral Yield Arbitrage” and “Quad Trading Program” strategies, we are betting a modest portion of our chips. This lets us capitalize on their early success while keeping the bulk of our stack intact, either in cash or other strategies. It is about staying in the game with a steady, linear return profile, avoiding the wild swings that come with over-committing.
An Example in Action
Picture a poker player sitting down with a $1,000 stack. They draw a strong hand, say a pair of aces. They could shove all $1,000 into the middle, hoping to double up. But instead, they bet $100, risking only 10% of their stack. If they win, their stack grows to $1,100. If they lose, they still have $900 to keep playing. It is a controlled move, balancing reward with survival.

We are doing the same. With only 29% of the short-term trading account in these two strategies, we are risking a portion of our capital while keeping the rest safe. As these programs continue to perform, we can turn up the knob, increasing their allocation bit by bit, much like a poker player who starts betting bigger as their stack grows through smart play.
Discretion in the Driver’s Seat
Here is the kicker: in poker, the choice of how many chips to dedicate to a single hand, or a string of hands, rests entirely with the player. One might go big early, chasing a quick payout. Another might play tight, building their stack slowly. It all depends on what they are trying to achieve, their tolerance for risk, and the game they are playing.
The same goes for us. Our decision to allocate capital conservatively reflects our aim for low volatility and a linear return profile. Another trader, with a different mandate, might pile more chips into these strategies right away. Neither approach is inherently right or wrong. It is about discretion, about matching the allocation to the goal.
Until next time, stay safe and trade well.
Technical Edge
Fair Values for August 7, 2025
-
S&P: 24.95
-
NQ: 109.14
-
Dow: 104.57
Daily Breadth Data 📊
For Wednesday, August 6, 2025
• NYSE Breadth: 44% Upside Volume
• Nasdaq Breadth: 54% Upside Volume
• Total Breadth: 53% Upside Volume
• NYSE Advance/Decline: 48% Advance
• Nasdaq Advance/Decline: 48% Advance
• Total Advance/Decline: 48% Advance
• NYSE New Highs/New Lows: 74 / 54
• Nasdaq New Highs/New Lows: 109 / 116
• NYSE TRIN: 1.13
• Nasdaq TRIN: 0.77
Weekly Breadth Data 📈
For the Week Ending Friday, August 1, 2025
• NYSE Breadth: 32% Upside Volume
• Nasdaq Breadth: 37% Upside Volume
• Total Breadth: 35% Upside Volume
• NYSE Advance/Decline: 31% Advance
• Nasdaq Advance/Decline: 22% Advance
• Total Advance/Decline: 25% Advance
• NYSE New Highs/New Lows: 217 / 133
• Nasdaq New Highs/New Lows: 438 / 322
• NYSE TRIN: 0.95
• Nasdaq TRIN: 0.46
BTS Levels:
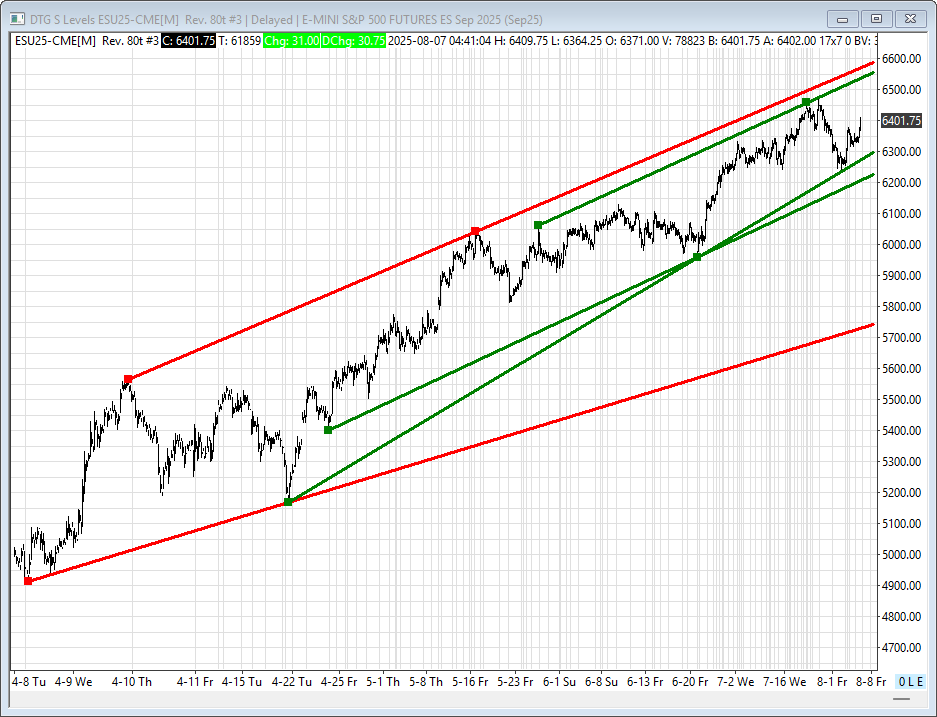
ESU2025
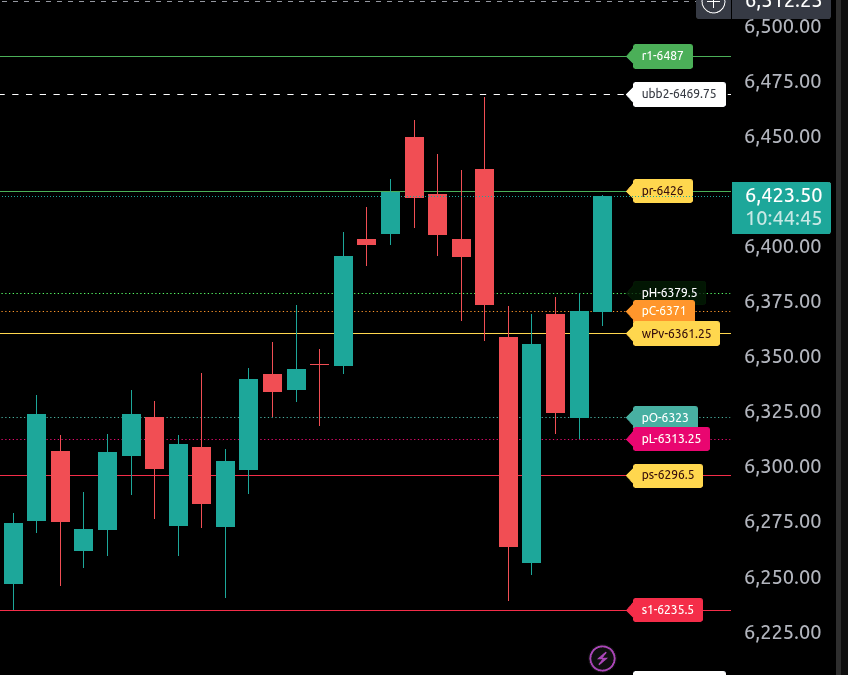
The bull/bear line for the ES is at 6361.25. Price is currently trading around 6425.00, which indicates bullish momentum above the key pivot level. Holding above 6361.25 keeps the bias to the upside for today’s session.
The immediate upside target is 6426.00. A break and hold above this level could open the door to 6469.75 (ubb2) and 6487.00 (r1), which represent higher resistance zones and potential exhaustion points for buyers.
On the downside, initial support sits at 6371.00 (previous close), followed by 6323.00 (pO). The lower range target for today is 6296.50. If selling intensifies, the next level to watch is 6235.50 (s1), which would represent a breakdown scenario and likely shift sentiment toward bearish.
Reminder, we are still in a long-term bullish trend. Pullbacks into support zones can offer buying opportunities unless price breaks below 6235.50 with momentum.
NQU2025
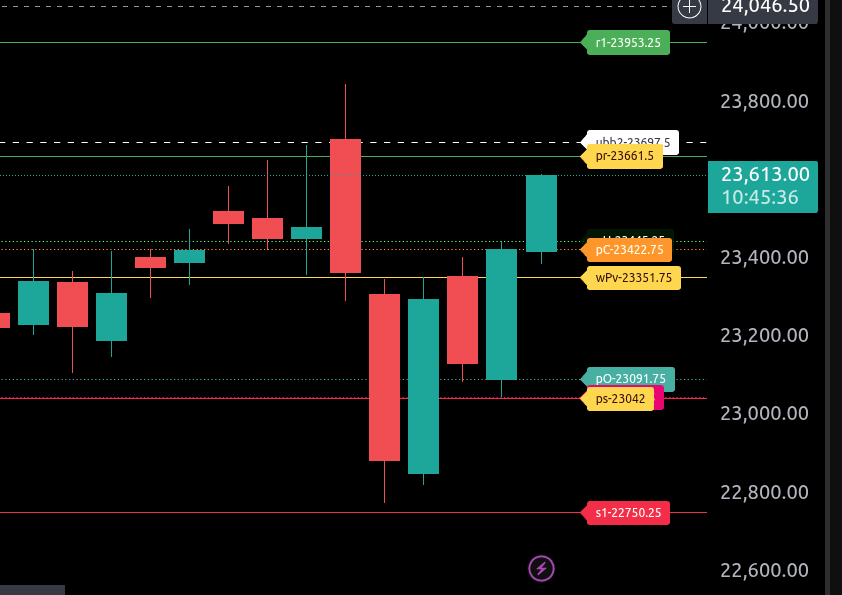
The bull/bear line for the NQ is at 23,351.75. This is the key pivot level for today, and it will determine directional bias. Currently, NQ is trading above it, around 23,614.25, suggesting bullish momentum in the pre-market session. As long as NQ holds above 23,351.75, the path of least resistance favors the upside.
The upper intraday range target is 23,661.50. If this level is cleared with strength, look for a potential extension toward the 23,697.50 area (ubb2), and then into 23,953.25 (r1), which will act as significant resistance and a potential exhaustion zone for today’s rally.
On the downside, if NQ breaks back below the bull/bear line at 23,351.75, expect pressure to build toward 23,091.75 and then into the lower range target at 23,042.00. A breakdown below this level could open the door to further weakness toward 22,750.25.
Reminder, we are still in a long-term bullish trend. However, holding above or below the 23,351.75 pivot will shape today’s intraday bias.
Calendars
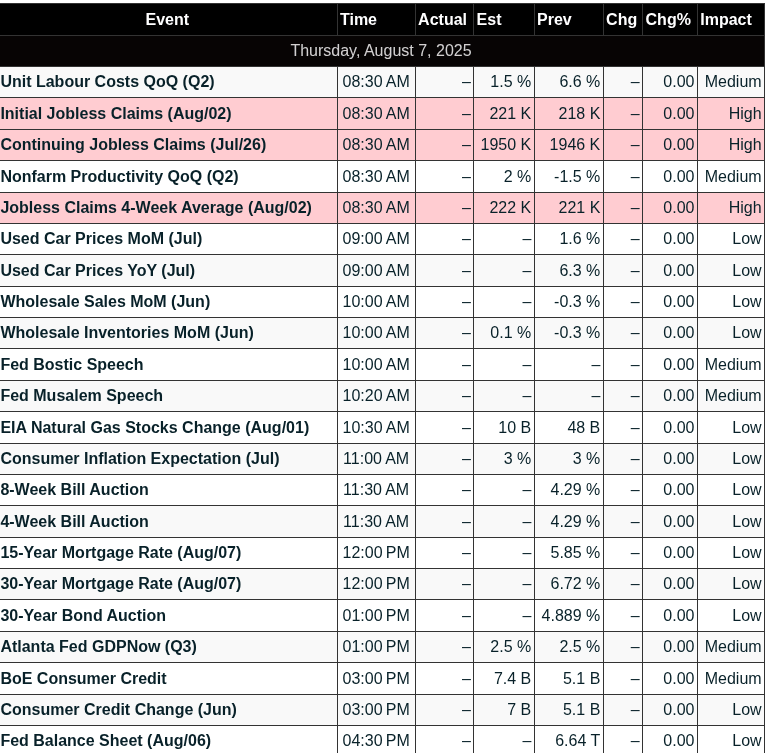
Economic Calendar Today
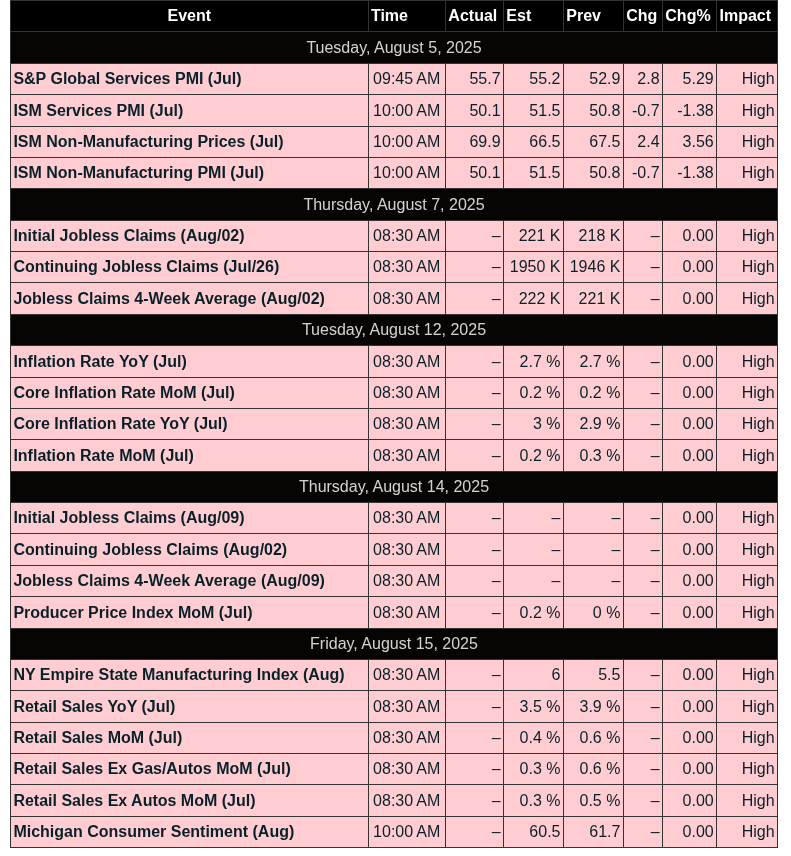
This Week’s High Importance
Earnings:
Released
Trading Room News:
Polaris Trading Group Summary: Wednesday, August 6, 2025
Wednesday’s session was a strong performance by the Bulls, marked by clean technical respect of key levels, disciplined trade setups, and valuable market insights from PTGDavid and the community.
Key Trades & Technical Highlights
-
Overnight Action: Price successfully back-tested the CD1 Low (6315.50) and rallied to the initial upside target of 6355.50. This confirmed the Daily Trade Strategy’s expectation for a CD1 Low retest.
-
LIS (Line in the Sand) at 6325 acted as “the Rock of Gibraltar”—strong, consistent support throughout the session.
-
PTGDavid emphasized: staying above 6325 targeted 6335–6340, then revisiting 6355–6360. This unfolded as projected, validating the plan.
-
Afternoon Action: Price tested and held 6365 structural support, then proceeded toward 6377 and 6383 targets, aligning with blibby71’s ATR projection of 6384.
-
End of Day: Despite a $2.7B sell imbalance at the MOC, markets held strong—imbalance was paired off, and the day closed near highs, setting up for potential bullish continuation into Thursday.
Lessons & Insights
-
Discipline Matters: A standout reminder came from PTGDavid: “NO TRIGGER, NO TRADE” and the necessity of always aligning with the dominant force. Triple-A setups only. Risk management is paramount.
-
Trader Psychology: A great exchange between Manny and PTGDavid reflected on the psychology of doing “the opposite” and how difficult it is to trade against ingrained instincts. It highlighted the power of structured systems over emotion.
-
Community Value: Traders like DanV, Manny, and blibby71 shared observations that enriched the room, including macro influences like the breaking news of tariffs on India and technical nuances like GEX levels and composite profiles.
Positive Takeaways
-
Textbook Execution of the Daily Plan.
-
Strong community engagement and support.
-
Market respected key levels with clarity, providing high-probability opportunities.
-
Multiple educational moments—both technical and psychological.
Summary:
Cycle Day 2 played out as a bullish recovery and continuation day, with structure holding, targets achieved, and the room staying in sync with the dominant force. With consolidation and breakout action confirming strength, momentum is positioned to spill over into Thursday.
Affiliate Disclosure: This newsletter may contain affiliate links, which means we may earn a commission if you click through and make a purchase. This comes at no additional cost to you and helps us continue providing valuable content. We only recommend products or services we genuinely believe in. Thank you for your support!
Disclaimer: Charts and analysis are for discussion and education purposes only. I am not a financial advisor, do not give financial advice and am not recommending the buying or selling of any security.
Remember: Not all setups will trigger. Not all setups will be profitable. Not all setups should be taken. These are simply the setups that I have put together for years on my own and what I watch as part of my own “game plan” coming into each day. Good luck!
This post goes out as an email to our subscribers every day and is posted for free here around 2 PM ET. To get your real-time copy, sign up for the free or premium version here: Opening Print Subscribe.
Comments are closed