This post goes out as an email to our subscribers every day and is posted for free here around 2 PM ET. To get your real-time copy, sign up for the free or premium version here: Opening Print Subscribe.
Two-Way Trade Ahead as S&P Grapples with Uncertainty and Rate-Cut Pressure
Follow @MrTopStep on Twitter and please share if you find our work valuable!
Our View
I thought the ES could trade lower—and it did. It sold off down to 6409.00 and opened Wednesday’s Fed-filled session at 6428, down 4.75 points or 0.07%. It rallied up to 6430.75 and then tumbled down to 6362.75, short-covered, and then made a sequence of higher lows and rallied all the way up to 6422.25. It pulled back to 6414.50 and then rallied up to a new high at 6422.50 at 3:37.
I got short early and rode the ES down, but of course I covered too early—then got long 6 points off the low of the day. It was that first failed rally up to the 6403 level, followed by a strong higher low at 6380.75, that set up the change in price action at 11:51. The rest of the day was all about buying the dips.
I called for the 3:50 imbalance to be $2 billion to buy—and it came out $2.2 billion to buy. The ES traded up to 6424.00, sold off down to 6411.25, and traded 6413.75 on the 4:00 cash close, down 0.30%. After 4:00, the ES drifted up a bit and settled at 6414.50, down 0.28% on the day.
In the end, I could be wrong, but it looks like everyone sold the Fed before the Fed. In terms of the ES and NQ’s overall price action, they acted resilient—with some late help from NVDA, which made a late high at $175.64 and settled at $175.40, down 0.14%.
In terms of the ES’s overall trade, volume jumped to 1.528 million contracts traded. The yield on the 10-year note ended the session at 4.296%. Crude rose 1.4% to $63.21 per barrel, Bitcoin traded at $114,281, gold futures closed 0.9% higher at $3,388.50, and the dollar closed at 98.21, up 0.24% over the past week.
When it comes to the Fed, we should all expect the unexpected.
The Fed minutes showed mixed opinions among central bankers, with most agreeing that it was too soon to lower interest rates after the minutes were released. This was the first time in over 30 years that multiple governors voted against a rate decision. I get it—everyone wants lower rates, but not when inflation is still rising and job growth is falling!
Let’s face it, folks: even if the Fed lowers interest rates in September, that’s not going to reduce the cost of living or offset the impact of the tariffs. Tell me I’m wrong, but this feels like a bad balancing act that’s about to have an accident.
Upcoming economic data:
-
7:30 AM: Atlanta Fed President Raphael Bostic speaks
-
8:30 AM: Initial Jobless Claims and Philadelphia Fed Manufacturing Survey
-
9:45 AM: S&P Flash US PMI
-
10:00 AM: Existing Home Sales and U.S. Leading Economic Indicators
Our Lean
As of the close, 93% of the companies in the S&P have reported—mostly positive results—showing an 11% jump in earnings per share in Q2. That’s the good part. The bad part is the uncertainty surrounding interest rate reductions.
The Nasdaq roared to new highs after the CPI number, and everything we read or heard was about half-point rate cuts, with more to come by the end of the year. But over the last few days, the ES and NQ have been pricing in an apprehensive Fed and its next moves. Like the old saying goes… the S&P hates uncertainty.
When I saw yesterday’s lows, the only thing I could think of was that the ES and NQ had already sold off and priced in some of the potential bad news from Powell. I also think Powell—despite his independence—is under pressure from the Trump administration to lower rates, and the public is starting to agree.
Our lean: No one can say for sure what the ES and NQ will do next. But as bad as the ES acted earlier this week, it looked like it was trying to shake off some of the news. My guess is that today is a two-way trade that sees lower volume and some back-and-fill action.
I know everyone thinks lower, and there’s no doubt that if Powell backtracks on the upcoming rate cuts, the markets will sell off, but I think bad news will eventually get bought again.
Key levels:
-
Support: 6380 and 6360
-
Swing level: 6400
-
Resistance: 6430, 6443, 6455, 6475–6480
MiM and Daily Recap
Intraday Recap
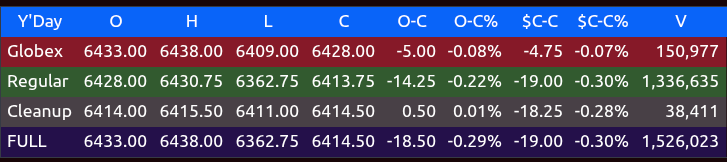
The overnight Globex session opened at 6433.00 and initially pushed higher to 6438.00 by 18:00, marking the session peak. Selling soon emerged, dragging the contract into a series of lower highs and lower lows through the evening. Prices dropped to 6425.75 at 19:25 before extending the decline to 6415.50 by 21:00. A brief bounce carried ES back to 6427.75 at 21:50, but sellers quickly regained control, pressing prices to a low of 6409.00 at 23:55. The early morning hours turned more balanced, with ES grinding back toward 6425.50 by 03:25 and a regular 10 to 15-point chop characterized Globex going into the cash open. Globex closed the session with a 5.00-point decline from the open, down 0.08%, on 150,977 contracts.
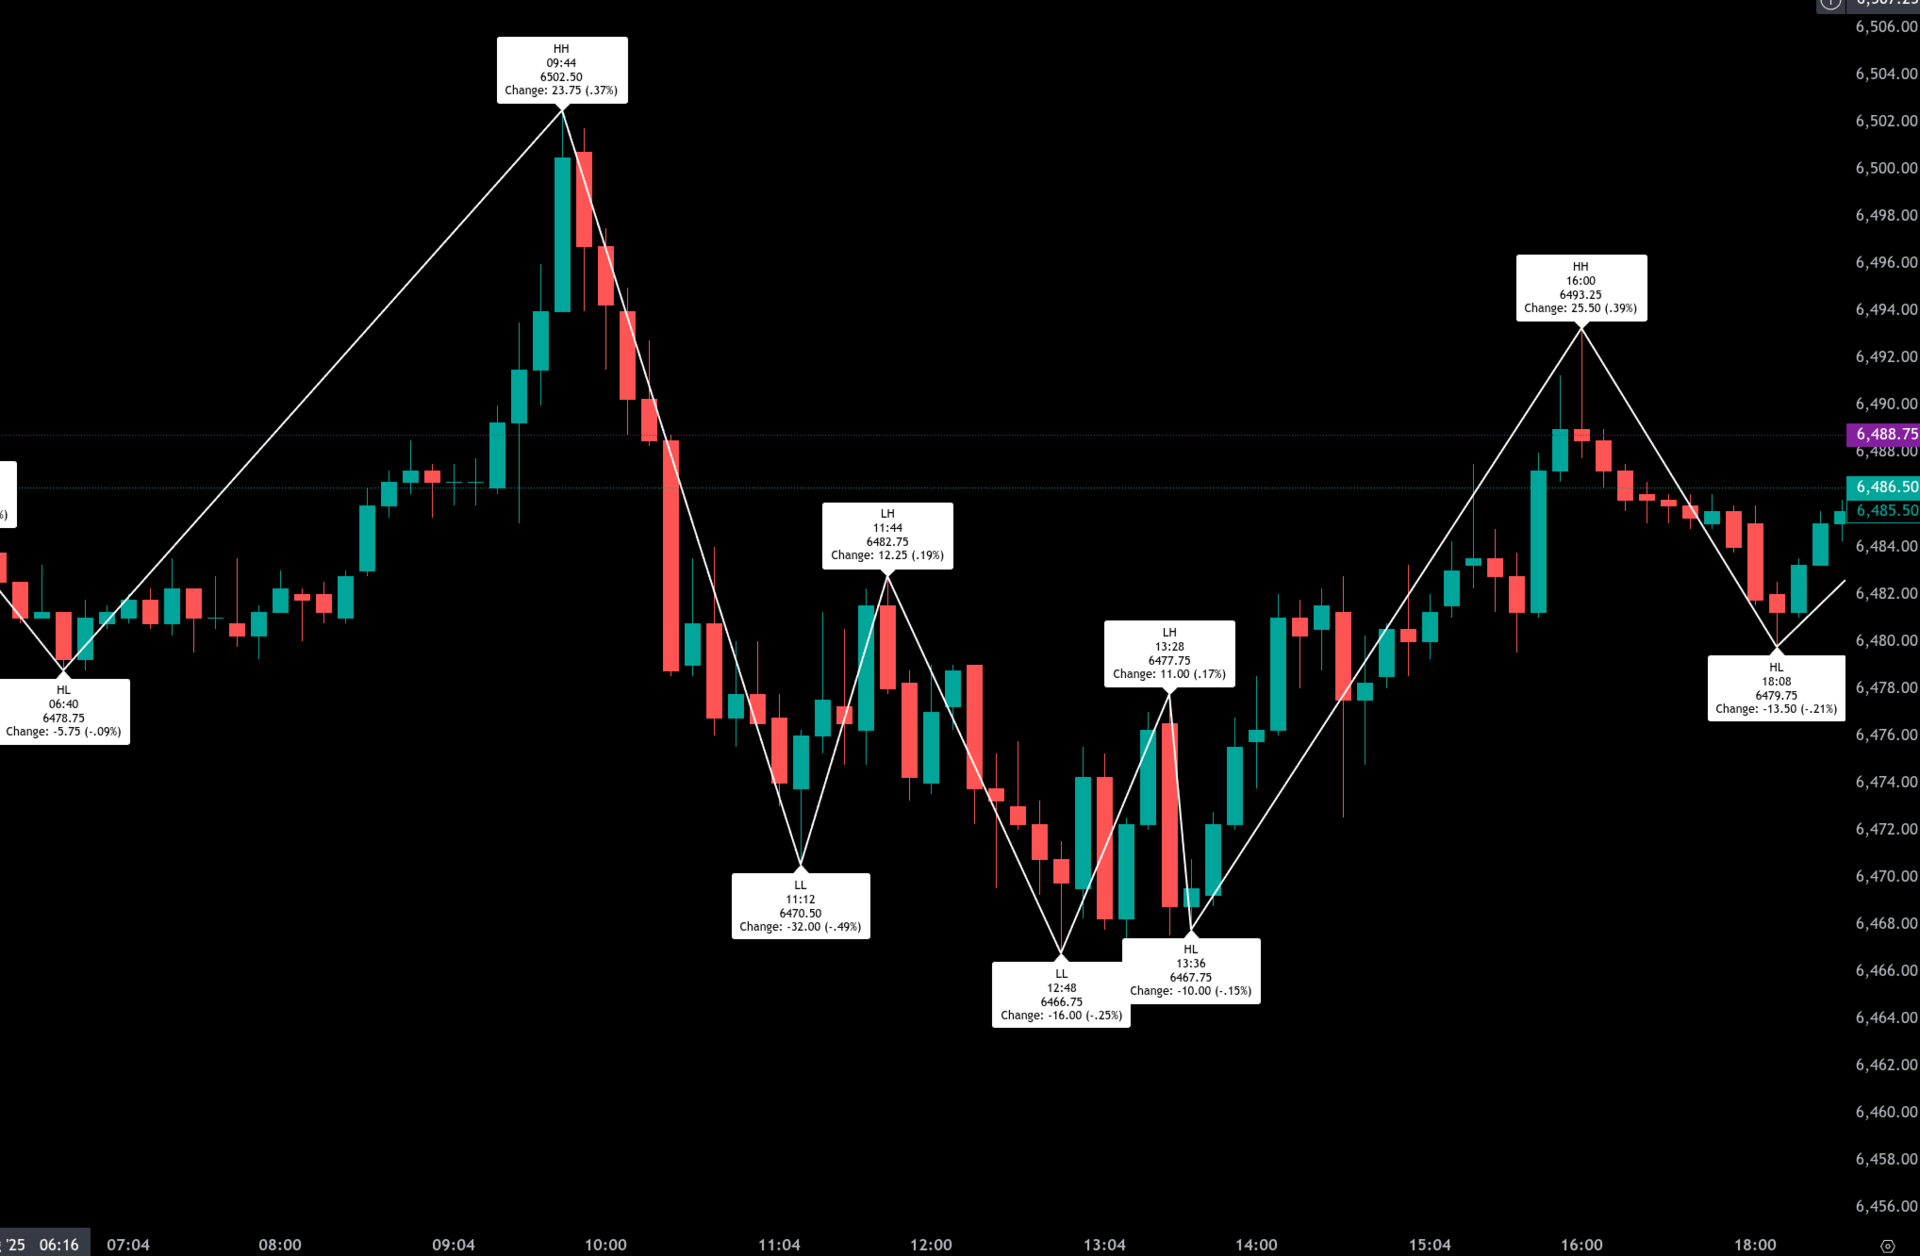
The cash session began with a push to the day’s high at 6430.75 just after the open at 09:30, but that strength was quickly rejected. By 10:50, sellers had driven ES down sharply to 6362.75, down 68 points or -1.06%, marking the regular session low. Buyers attempted to stabilize conditions, staging a rally into midday that carried ES to 6413.25 at 13:45. After a brief dip to 6385.50 at 14:20, momentum shifted higher again, peaking at 6424.25 by 15:50, up 27.75 from the 14:20 low. However, the late afternoon lost steam, with a rollover into 6413.75 at the close of the regular session, down 14.25 points or -0.22% from the open. Total day session volume reached 1,336,635 contracts.
The cleanup session was relatively quiet, opening at 6414.00 and closing unchanged at 6414.50 after a narrow 4.5-point range. This left the full-session settlement at 6414.50, down 18.50 points (-0.29%) from the prior day’s close, with cumulative volume of 1,526,023 contracts.
Market tone throughout the day reflected heavy selling pressure in the morning, followed by two notable recovery attempts that ultimately failed to recapture the opening high. The intraday swings were wide, with both bears and bulls active, but the inability to sustain momentum above the 6425–6430 zone capped rallies and reinforced a bearish undertone.
The Market-on-Close imbalance data showed a strong buy-side tilt. At 15:50, imbalance dollars measured $2.21B, with 70.4% on the buy side and 52.4% of symbols leaning positive. This imbalance exceeded the 66% threshold, signaling strong institutional buying interest into the close. The late-session recovery into 6426.25 was consistent with this buy-side flow, though the effect moderated after 16:00 as the imbalance passed.
Overall, the session closed with a negative net change, erasing early strength and leaving ES 19 points lower (-0.30%) versus the prior cash close. The tone was mixed but leaned bearish given the morning breakdown, though the strong MOC imbalance may indicate underlying dip-buying support heading into the next session.
Guest Posts:
Dan @ GTC Traders
It’s a Bubble: Part Seven? Private Markets … Private Equity
In the previous installments of this series, we’ve unpacked our view that we’re in the late stages of a longer-term stock market rally … and the beginning stages of a stock market bubble. We’ve covered quantitative factors like extreme valuations, upward standard deviations in price, and exploding upside deviations in returns. We’ve also touched on qualitative signs of euphoria … that “this time it’s different” mindset echoing 1999 and 2007. And we’ve discussed how this environment mandates a conservative “nit” game in our portfolio. Smaller positions, patience over chasing gains.

But bubbles are funny things. They don’t stay confined to one corner of the market. They spread. Before anyone sees them. Seeping into other facets of the economy like private equity, private credit, and alternatives. What starts as over-enthusiasm in public equities often inflates valuations in illiquid spaces … where opacity hides risks until it’s too late. Let’s examine how this bubble is manifesting in private markets. Drawing from recent data and timeless principles.
The Private Equity Over-Allocation Trap
Private equity has been the darling of institutional investors for years. Pensions allocate around 15%. College endowments 30%. Elite ones like Yale pushing 40-45%. But step back. The S&P 500’s 500 giants boast $50 trillion in market cap. Massive, profitable, scaled businesses. The next 2,000 public firms (Russell 2000) total just $2-3 trillion. Private Equity? About 12,000 companies … average size $300 million … aggregate value similar to the Russell 2000.
Yet these are small, low-margin, highly levered outfits? Think local dry cleaners versus Microsoft. Intuitively, they should be riskier. More volatile, prone to bankruptcy in recessions (25% rates aren’t unheard of). But institutions pile in. Drawn by promises of equity-like returns with very low bond-like volatility. Surveys show 90%+ expect private equity to beat public markets by only 200 basis points net of fees.
Reality check: As of mid-2025, distributions have collapsed to 10% of NAV (the lowest since 2008) despite all-time stock highs. Fundraising peaked three years ago. Down 40% in capital raised. Exits? Slow Mergers and Acquisitions, scant IPOs for vertical Software as Service (SaaS) firms … even Yale is selling up to $2.5 billion in PE and VC stakes from its $46 billion endowment. Why? Liquidity trap. Money flows in. But trickles out slower than expected.
Volatility Laundering and Hidden Risks
Private equity values seem steady, with just 10% yearly swings … like safe corporate bonds. But that’s misleading. They are valued infrequently, hiding true volatility. Look at private equity funds listed on London’s stock exchange: their values seem stable, but their market prices jump 24% a year … trading at 70% of stated value in 2025 (down from 95% in 2021). Their real risk? About 1.6 times higher than small public companies … debt makes them swing more.
The Yale model was clever after the 1970s economic slump … diversifying into private markets when they were new. Early on, they bought family businesses at 40% discounts … big wins over time. But too much money has flooded in, erasing those deals. Now? Investors are overloaded with small, debt-heavy firms … 50-60% debt on $2+ trillion of equity, plus equal private loans.
Bubbles drive this. Stock market excitement spills into private investments … big players chase “alternatives” as stocks soar. But with payouts drying up … and risks like tariffs growing? Trouble looms. No crash yet … more a slow leak, unless a recession sparks failures.
A Multi-Variate View … and Alternatives
Combining our series’ variables:
• Equities at extreme valuations and deviations.
• Qualitative euphoria now infecting private allocations.
• Depressed PE distributions signaling liquidity woes.
• Volatility illusions hiding small-cap-like risks.
Our mandate? Stay conservative. We are continuing with our mandate, which is continuing to print basis points every single month. Bubbles spread … but discipline endures. New traders: Avoid the herd. Seek meta-analysis … what others overlook.
Until next time, stay safe … and trade well.
Technical Edge
Fair Values for August 21, 2025
-
S&P: 18.35
-
NQ: 76.09
-
Dow: 67.91
Daily Breadth Data 📊
For Wednesday, August 20, 2025
• NYSE Breadth: 51% Upside Volume
• Nasdaq Breadth: 42% Upside Volume
• Total Breadth: 43% Upside Volume
• NYSE Advance/Decline: 48% Advance
• Nasdaq Advance/Decline: 46% Advance
• Total Advance/Decline: 47% Advance
• NYSE New Highs/New Lows: 69 / 30
• Nasdaq New Highs/New Lows: 82 / 141
• NYSE TRIN: 0.85
• Nasdaq TRIN: 1.11
Weekly Breadth Data 📈
For the Week Ending Friday, August 15, 2025
• NYSE Breadth: 55% Upside Volume
• Nasdaq Breadth: 63% Upside Volume
• Total Breadth: 60% Upside Volume
• NYSE Advance/Decline: 65% Advance
• Nasdaq Advance/Decline: 65% Advance
• Total Advance/Decline: 65% Advance
• NYSE New Highs/New Lows: 267 / 94
• Nasdaq New Highs/New Lows: 571 / 303
• NYSE TRIN: 1.44
• Nasdaq TRIN: 1.09
BTS Levels:
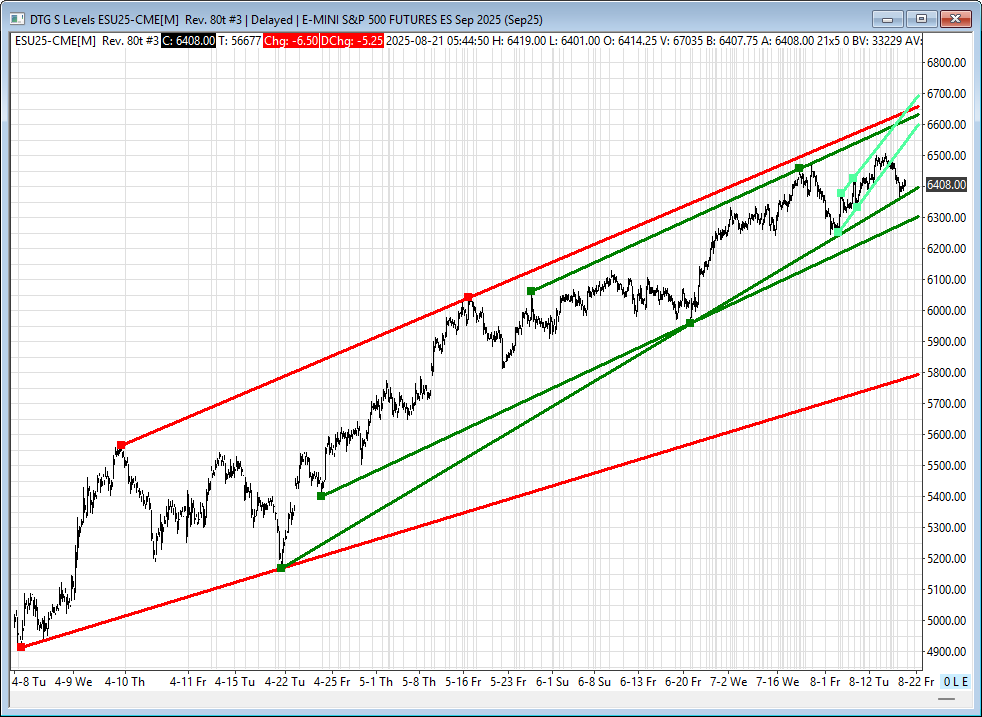
ESU2025
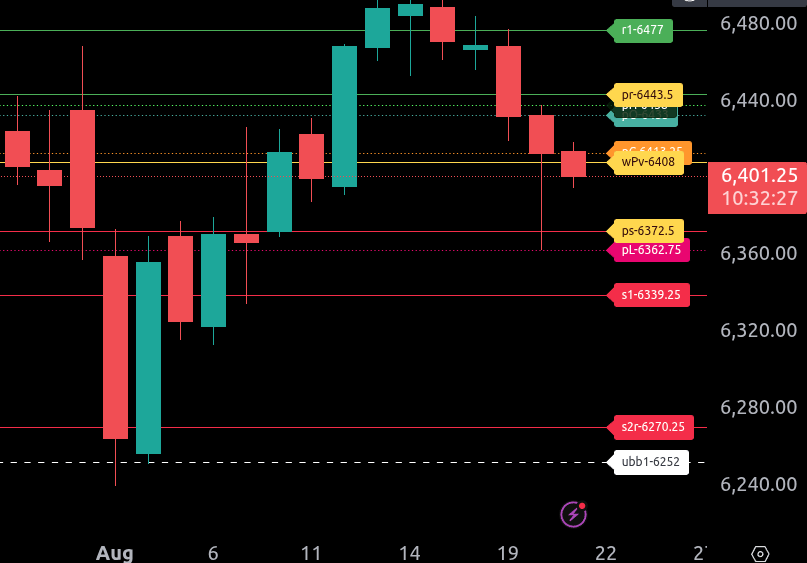
The bull/bear line for the ES is at 6408. This is the key pivot level for today. If price reclaims and sustains above 6408, bullish momentum may build, targeting resistance levels higher. Remaining below this level signals weakness and favors the downside.
Currently, ES is trading around 6399.50, slightly under the bull/bear line, keeping pressure on the downside. If sellers maintain control below 6408, the first downside level to watch is 6372.50, followed by stronger support at 6362.75 and 6339.25.
On the upside, if ES can climb back above 6408 and hold, the first test is 6413.25, with further resistance at 6443.50. A sustained move higher opens the door to 6477, our upper range target.
Overall, the near-term bias remains bearish while trading under 6408. Bulls need to regain and hold above this level to shift momentum. Until then, the path of least resistance is lower, with eyes on 6372.50 and below. Reminder, we are still in a long-term bullish trend.
NQU2025
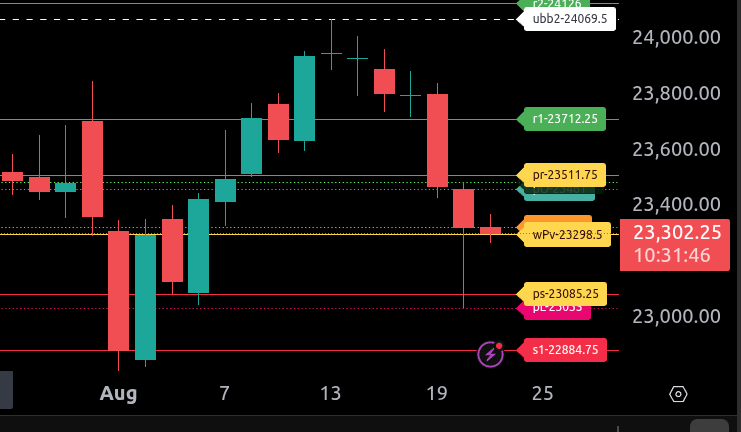
The bull/bear line for the NQ is at 23,298.50. This is the key pivot that will dictate sentiment today. Holding above this level could open the door for buyers to attempt a rebound, while staying below keeps the pressure on the downside.
Currently, NQ is trading at 23,298.75, essentially right at the bull/bear line. If buyers can sustain above this level, the first resistance test comes at 23,324, followed by 23,461 and then the upper range target of 23,511.75. Beyond that, stronger resistance sits at 23,712.25.
On the downside, failure to hold 23,298.50 puts the lower range target of 23,085.25 in focus. Below that, further support levels are at 23,035 and then 22,884.75. A decisive break of these levels could extend the decline toward 22,688.25.
Overall, the market is testing a key decision zone at 23,298.50. Bulls need to reclaim and build above it to neutralize selling pressure, while bears will look for sustained trade below to press toward lower support levels.
.
Calendars
Economic Calendar Today
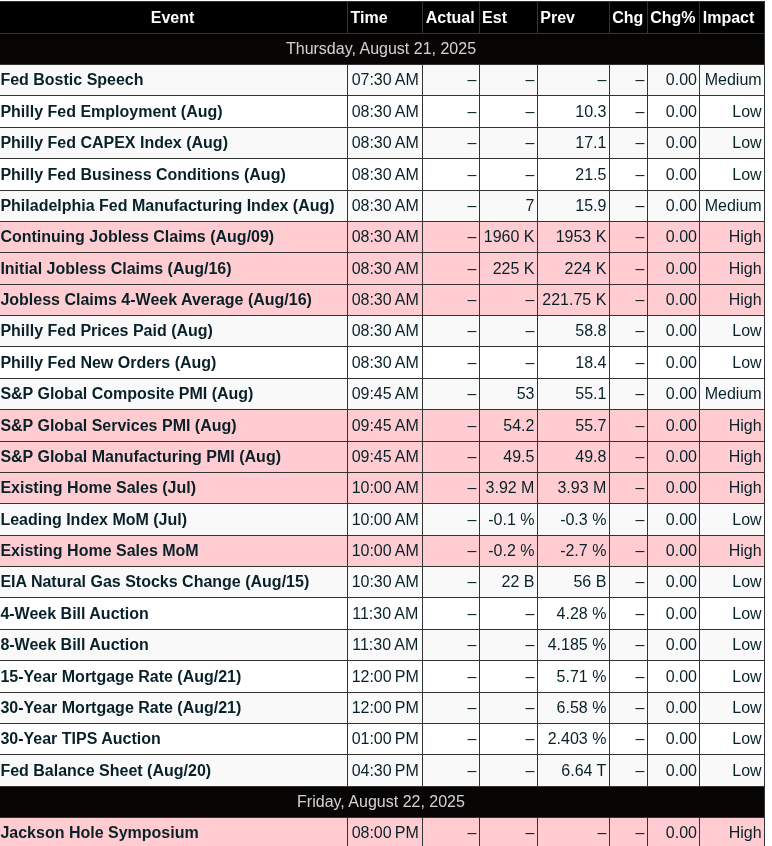
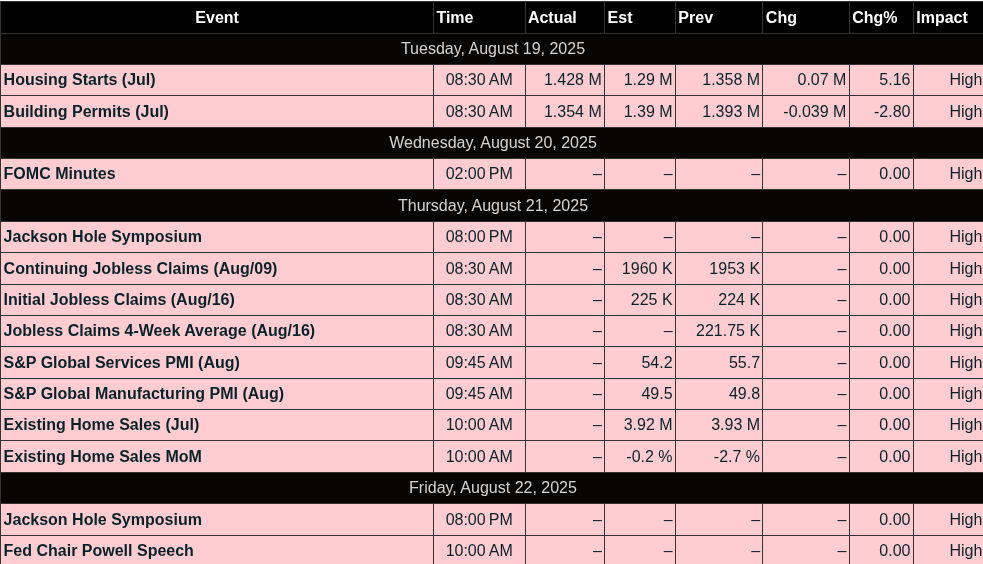
This Week’s High Importance
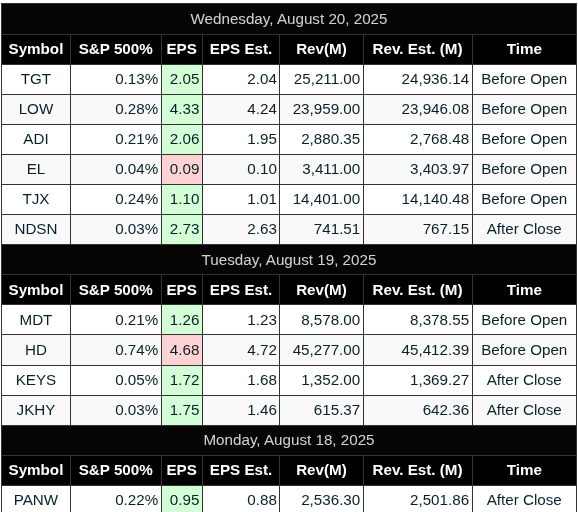
Earnings:
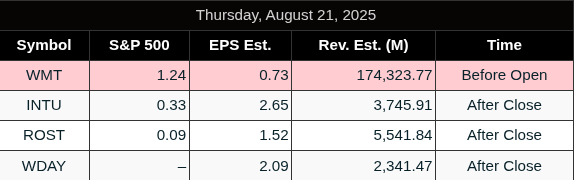
Released
Trading Room News:
Polaris Trading Group Summary: Wednesday, August 20, 2025
Market Context:
-
Cycle Day 3 in play.
-
Overnight action fulfilled Lower Target Zones in both ES and NQ, setting up a bearish open.
-
The goal was to reclaim CD1 Low at 6456, with early focus on holding/breaking key zones around 6430, 6415–6405, and ultimately 6370, which was the projected CD3 low.
Key Trades & Highlights
Morning Downside Opportunity
-
Early morning presented a prime short opportunity around 9:42 AM, as price failed to hold above sandbox zone (6420–6430).
-
Multiple members highlighted this spot, calling it a textbook bearish setup.
Alignment Sell Side & Discipline
-
PTGDavid emphasized staying aligned with the sell side, which several members like Ram took to heart. He shared a personal breakthrough: avoiding probing in downtrends, keeping him in alignment.
-
Ram and Roy discussed how adjusting expectations quickly and trading what’s in front of you are game changers.
Mental Framework – The OODA Loop
-
David introduced the OODA Loop (Observe, Orient, Decide, Act) as a mental model to sharpen trading decisions and avoid “stupid human things.”
-
Traders resonated with this approach, helping to clarify thought processes and avoid emotional reactions.
Reversal Highlight – Trade of the Day
-
Around 11:20 AM, the market hit the Cycle Day 3 projected range low (~6370), and launched a sharp reversal rally with “ULTRA PRECISION,” as David put it.
-
This produced the “Gold Mine” 0DTE Call play, which Ram inquired about earlier. Perfect RSPR setup with zero heat.
-
David celebrated this as “Precision Laser Trading,” and called it a textbook reversal off major support.
Lessons & Member Growth
-
Roy_ reflected on not trading the down move due to pre-bias and emphasized needing to “trade what I see.”
-
Ram highlighted the power of building habits that reinforce the right setups and avoid bottom-fishing.
-
Manny noted he often performs better later in the day, when he has a more developed read.
-
David reminded everyone that replay and practice are the key to embedding this precision into their process.
Afternoon Session
-
After a consolidation near VWAP, David broke for lunch.
-
2 PM brought a classic “Shake n’ Bake” to the sell side.
-
Into the close, MOC printed a $2.25B Buy Imbalance, adding a bullish tailwind.
Final Wisdom
-
David closed with a reminder: despite the rise of AI, human error still dominates the market, and staying disciplined and prepared is what truly creates an edge.
Summary Takeaways
-
Big win: Reversal from CD3 low offered high R/R long trade with precision entry.
-
Key lesson: Alignment with trend and execution on context-rich setups are crucial.
-
Mental edge: Applying frameworks like OODA helps traders stay calm and structured.
-
Growth: Multiple traders showed progression in discipline, patience, and self-awareness.
Affiliate Disclosure: This newsletter may contain affiliate links, which means we may earn a commission if you click through and make a purchase. This comes at no additional cost to you and helps us continue providing valuable content. We only recommend products or services we genuinely believe in. Thank you for your support!
Disclaimer: Charts and analysis are for discussion and education purposes only. I am not a financial advisor, do not give financial advice and am not recommending the buying or selling of any security.
Remember: Not all setups will trigger. Not all setups will be profitable. Not all setups should be taken. These are simply the setups that I have put together for years on my own and what I watch as part of my own “game plan” coming into each day. Good luck!
This post goes out as an email to our subscribers every day and is posted for free here around 2 PM ET. To get your real-time copy, sign up for the free or premium version here: Opening Print Subscribe.
Comments are closed