This post goes out as an email to our subscribers every day and is posted for free here around 2 PM ET. To get your real-time copy, sign up for the free or premium version here: Opening Print Subscribe.
Bounce or Trounce
Follow @MrTopStep on Twitter and please share if you find our work valuable!
Everything was going as planned Friday morning. The ES was lower for most of the Globex session, then rallied and opened at 6788.00. and immediately pushed up to 6806.75. It pulled back to 6784.00 at 10:20 but stayed in a 10-handle back-and-fill pattern, sitting at the top of the bar at 6796.75 just before 11:00 (Trump’s favorite time). Then it crashed down to 6659.00 at 11:39 — a drop of 136.75 points in 39 minutes.
After the low, the ES bounced back up to 6705.75 at 11:51, then made a series of lower lows, reaching 6641.00 at 1:12. It rallied again to 6673.75 at 1:40 before selling off to a new low of 6603.50 at 3:40. It then traded up to 6633.00, began to tick down, and traded 6623.50 as the 3:50 imbalance showed $2 billion to sell. The ES sold off down to 6591.50 at 3:54, upticked briefly, and then fell to a new low of 6591.75 on the 4:00 cash close.
After 4:00, the ES had a little sideways price action, traded up to the 6607.00 level at 4:20, traded 6601.00 at 4:48, before dropping 60.25 points to yet another new low at 6540.25 at 4:51. It finally settled at 6552.00, down 236 points or -2.71%.
The NQ settled at 24,397.00, down 892 points or -3.53%.
The last time the ES saw a comparable drop was on April 21, when it closed down 2.45%. The last time it fell more was April 10, when it dropped 3.38%. For the NQ, a similar decline occurred on April 16, when it closed down 2.98%, or on April 10, when it fell 4.17%.
In the end, the ES and NQ futures shifted from a quiet grind to a massive sell-off, triggering sell stops, outright selling, and thousands of sell programs. The overall tone of the ES and NQ remained extremely weak right into the 5:00 futures close. Despite the significant move, total ES trading volume was high at 2.55 million contracts, though still lower than expected for such a large decline.
Why October Gets the “Black Swan” Reputation
October has earned a notorious label as the “month of market crashes,” largely due to historic downturns that fuel the psychological “October Effect”—the fear that stocks will decline during this month. However, this is more myth than statistical destiny.
Major crashes, often labeled “Black” days, are outliers—not a predictable pattern. True Black Swans, by definition, are unpredictable, which makes attributing them to October more about hindsight bias than fact.
Key October Crashes:
-
Panic of 1907: Bank runs and trust failures triggered a liquidity crisis; J.P. Morgan intervened. (~50% DJIA decline over months; no single-day Black Swan.)
-
Wall Street Crash of 1929 (Oct 24 & 29): A speculative bubble burst amid margin debt, sparking the Great Depression. (-13% Oct 28, -12% Oct 29; ~89% total drop by 1932.)
-
Black Monday (Oct 19, 1987): Program trading amplified a global sell-off—the largest one-day drop ever. (-22.6% or 508 DJIA points; markets recovered quickly.)
-
2008 Financial Crisis Peak (October 2008): Lehman’s collapse and a credit freeze led to bailouts. (-17% monthly drop; part of a ~50% bear market.)
I’m not saying this is the beginning of a Black Swan event—but I’m also not going to say it’s impossible. The U.S. government has been financed by foreign investors, particularly through Treasury auctions, and all China has to do is start unloading its U.S. Treasury holdings.
We can think what we want, but the U.S. is in bad shape. None of its problems are going away, and some are getting bigger.
OnTap – Fed Speaker Calendar
Monday, Oct 13:
-
Philadelphia Fed President Anna Paulson (12:55 PM ET)
Tuesday, Oct 14:
-
Fed Governor Michelle Bowman (8:45 AM ET)
-
Fed Governor Christopher Waller (3:25 PM ET)
-
Boston Fed President Susan Collins (3:30 PM ET)
Wednesday, Oct 15:
-
Atlanta Fed President Raphael Bostic (12:10 PM ET)
-
Fed Governor Stephen Miran (12:30 PM ET)
-
Fed Governor Christopher Waller (1:00 PM ET)
Thursday, Oct 16:
-
Richmond Fed President Tom Barkin (8:00 AM ET)
-
Fed Governor Stephen Miran (9:00 AM ET)
-
Fed Governor Christopher Waller (9:00 AM ET)
-
Fed Governor Michelle Bowman (10:00 AM ET)
-
Richmond Fed President Tom Barkin (12:45 PM ET)
-
Fed Governor Stephen Miran (4:15 PM ET)
-
Richmond Fed President Tom Barkin (4:30 PM ET)
Our View
A few days ago, I highlighted how many prominent investors were warning about a market crash. I questioned how so many smart people could be so wrong. Part of the answer is that large investors often predict corrections or crashes that never materialize.
However, this may change in the long run. The U.S. national debt is rapidly approaching $38 trillion (see: usdebtclock.org), the geopolitical environment is deteriorating, the U.S. government is shut down, and political unrest in the U.S. isn’t helping.
While I may not be able to connect all the dots, it’s increasingly clear that the U.S. risks being pulled into a broader conflict in Ukraine. Meanwhile, China’s President Xi Jinping continues expanding influence in the South China Sea and around the world.
I think there are two pivotal moments:
-
The creation of BRICS, and
-
The first in-person meeting between Russian President Vladimir Putin and Xi after the 2022 Ukraine invasion.
And this weekend, Xi sent a message to North Korean leader Kim Jong-un, signaling that Beijing is ready to strengthen strategic cooperation with Pyongyang on both regional and international issues. It feels like the Indians are circling the wagons.
Despite the tariff extensions, China has taken a firmer stance with the Trump administration—restricting rare earth exports to the U.S. and pressuring TSMC not to sell chips to American companies. Again, I’m not the guy to connect all the dots, but it seems China is no longer bowing to Trump’s threats and is now stepping up its pressure.
Our Lean
I remain a cautious bull, despite skyrocketing stock valuations and historically high complacency.
The PitBull asked me at 3:00 PM what I thought, and I told him they could do anything. I pointed out that after 4:00 on Friday, when the ES fell another 60 points, it was trading at a steep discount to the S&P cash. When that happens, futures usually bounce.
That said, I believe the recent market drop is a reminder of how fast things can unravel.
On Friday, the Magnificent Seven stocks—Apple, Microsoft, Alphabet, Amazon, Nvidia, Meta, and Tesla—were near highs, and then lost a combined $768 billion in market capitalization. Nvidia led the decline with a $243.5 billion loss.
While I remain a bull, I think it’s important to remind myself—and readers—that the U.S. stock market is fighting an uphill battle fraught with risk.
Our lean: After Trump’s “step back,” I think we could see a bounce. This seems to be how it works.
The 50% retracement from Friday’s high of 6806.50 to the low of 6540.25 is 266.25 points, and 50% of that is 133.125, which gives us 6673.375.
While today could get busy, keep in mind it’s Columbus Day, and the banks and bond market are closed. That means customers who had margin calls on Friday won’t be able to wire in funds until Tuesday, adding another layer of concern.
I can do my own support and resistance, but today I’m using @HandelStats levels. Keep an eye on his pivots and standard deviations.
My guess is we’ll see higher prices—the real question is: Will they hold?
I would think 6700–6740 would be a brick wall.
From @HandelStats
INTC Options Setup — Structured Trade Example
Actionable idea for the week
Intel (INTC) designed to capture near-term premium while maintaining longer-term upside exposure.
Sell: Oct 17 36/39 put spread for $2.00 credit
Buy: Dec 19 50 call for $1.00 debit
Net Credit: $1.00
This position establishes a neutral-to-bullish bias with limited downside risk and defined reward. The next step will be to sell an additional put spread next week to continue generating income and manage overall exposure. Of course you can always do one side or the other independently.
More to follow as this trade evolves.
— HandelStats.com
Quantitative data. Structured trades.
-
Links to HandelStats Daily Sheet:
Bonds & Notes
Cryptos
Indicies
Metals
Oil
MiM and Daily Recap
Intraday Recap
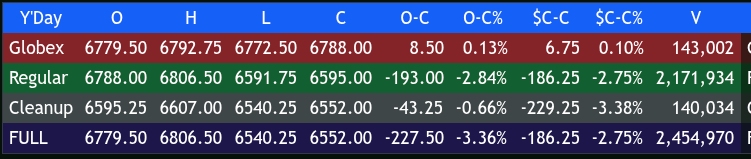
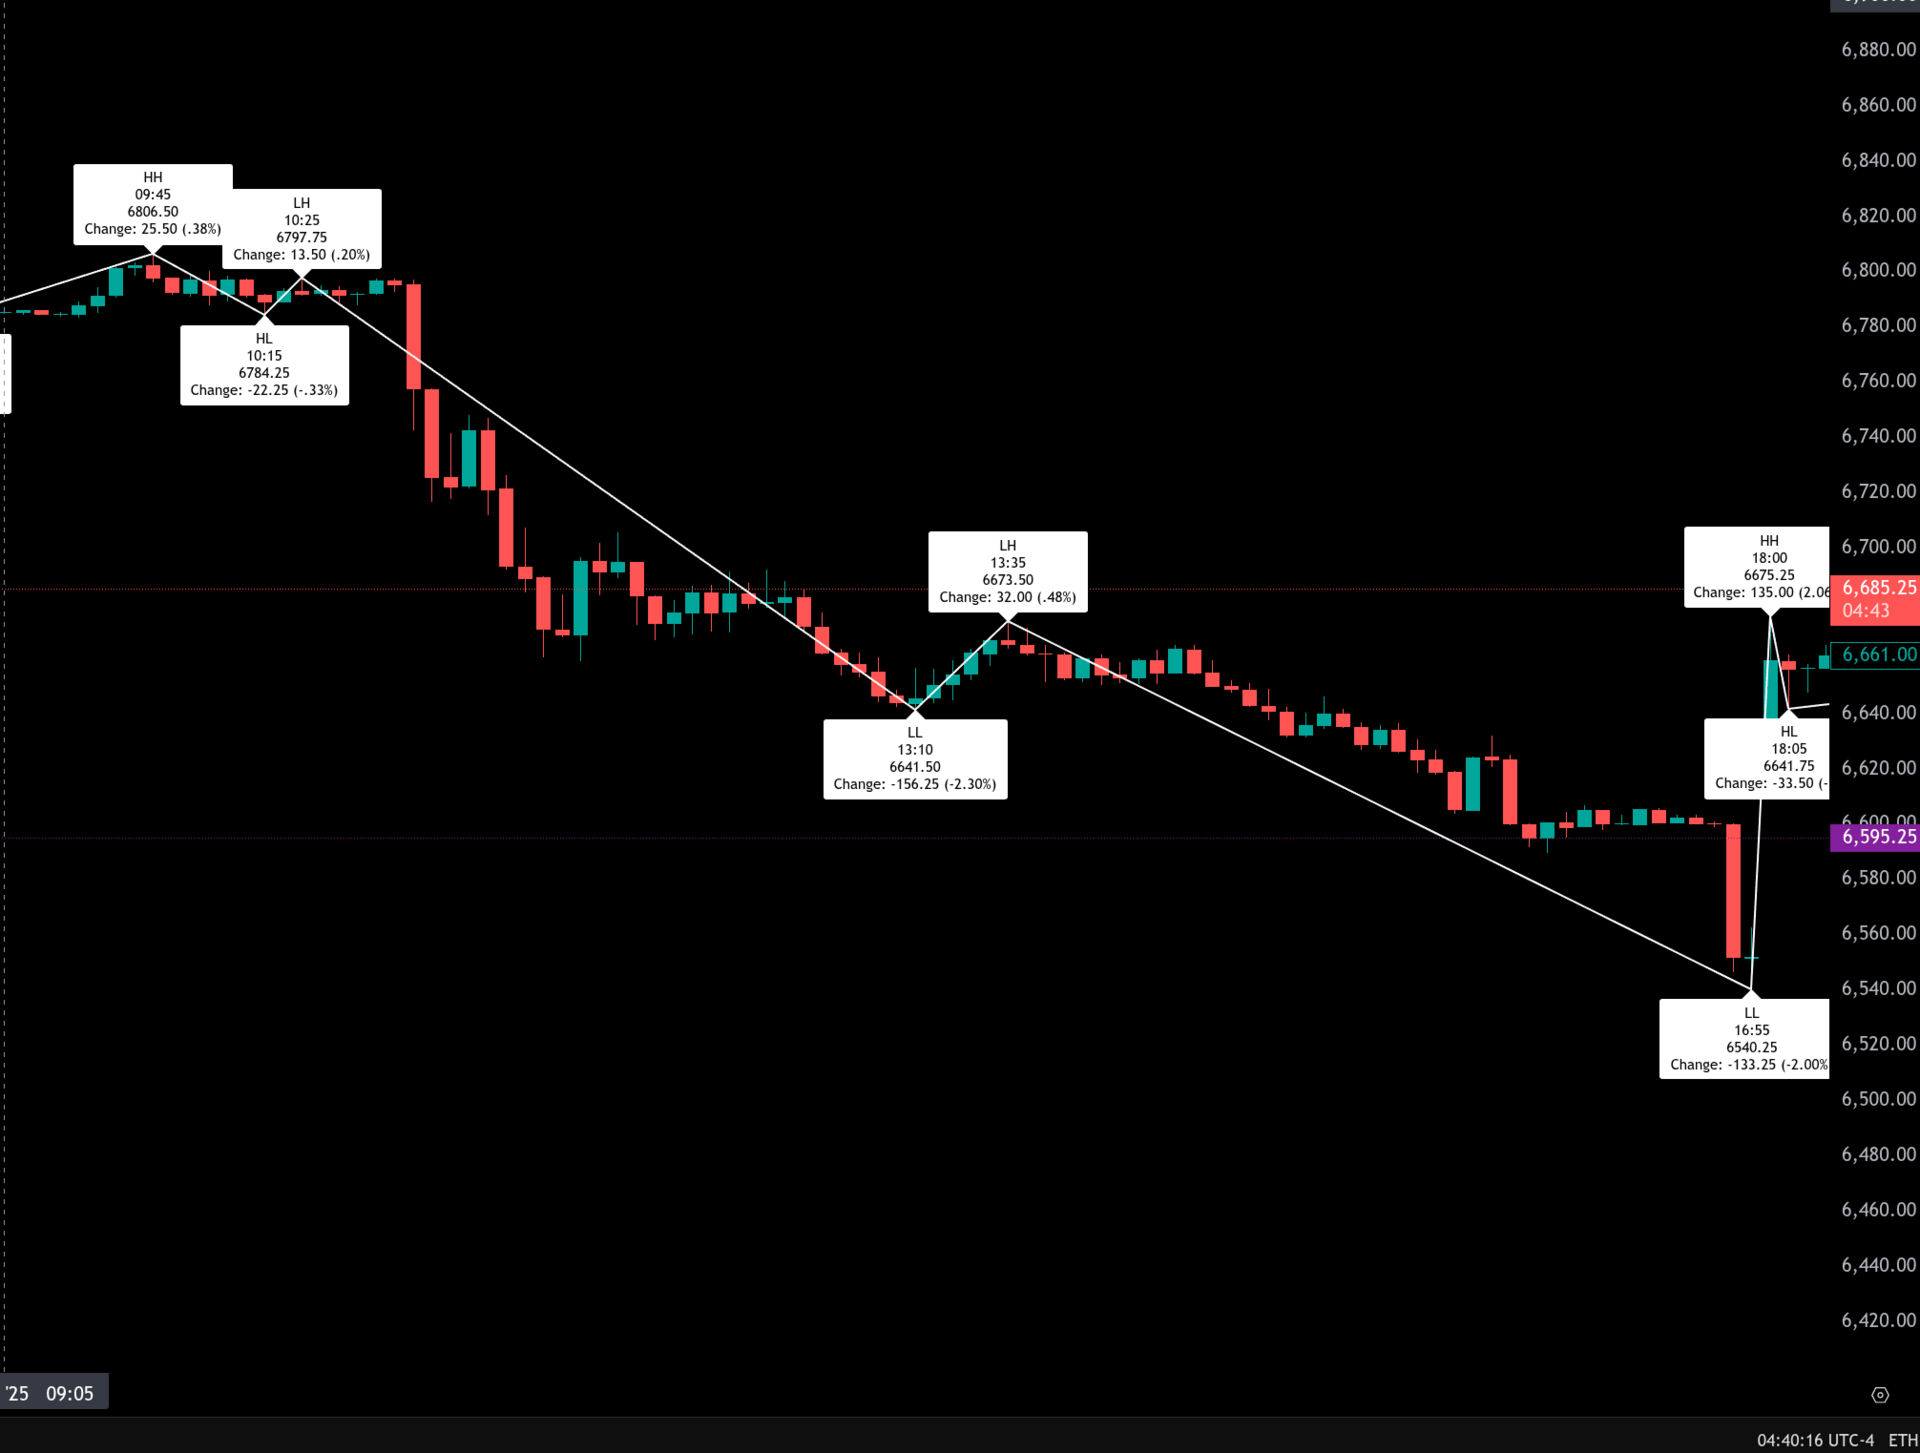
The ES futures opened the Globex session at 6779.50 and traded within a narrow early range, climbing modestly before encountering resistance. An initial push took the contract from 6779.50 up to 6791.75 at 20:00, marking the first significant high. After a brief pullback to 6785.75 at 20:10, buyers regained momentum and extended the rally to a higher high at 6792.75 by 21:25. That strength faded into the late-night hours, leading to a gradual retreat as the ES fell to 6784.50 at 23:55 and then 6780.50 by 1:00. A minor bounce to 6790.50 at 4:45 was met with renewed selling, producing a session low of 6772.50 at 5:55. The ES recovered modestly into the morning, trading 6788.00 at the 9:30 open. The Globex session closed at 6788.00, up 8.50 points or 0.13% from its open and 6.75 from the previous cash close.
The regular session opened firm at 6788.00 and immediately tested the upside, printing 6806.50 at 9:45. That early rally proved to be a bull trap as sellers seized control. A lower high formed at 6797.75 at 10:25, followed by a sharp decline to 6641.50 at 13:10 marking a 156.25-point plunge from the intraday high. The index attempted a midday recovery to 6673.50 at 13:35, but another wave of selling drove prices down to 6540.25 at 16:55, the lowest print of the day. Including the cleanup session, prices edged further to 6552.00 by 5:00 PM, bringing the full-session loss to 186.25 points (-2.75%) from Thursday’s settlement.
Volume was heavy throughout, with 2.17 million contracts traded during the regular session and a total of 2.45 million across all sessions, underscoring broad participation amid a decisive downside move. The cash-to-cash change showed a -186.25-point or -2.75% drop, highlighting how the day’s weakness extended the market’s retracement phase.
Market tone was distinctly bearish. The early strength in Globex quickly reversed during regular hours as sellers dominated nearly every rally attempt. Momentum accelerated into midday, triggering a cascade of sell programs that pushed the ES through multiple support levels. Although the late-afternoon rebound briefly eased selling pressure, it was not enough to offset the broad decline.
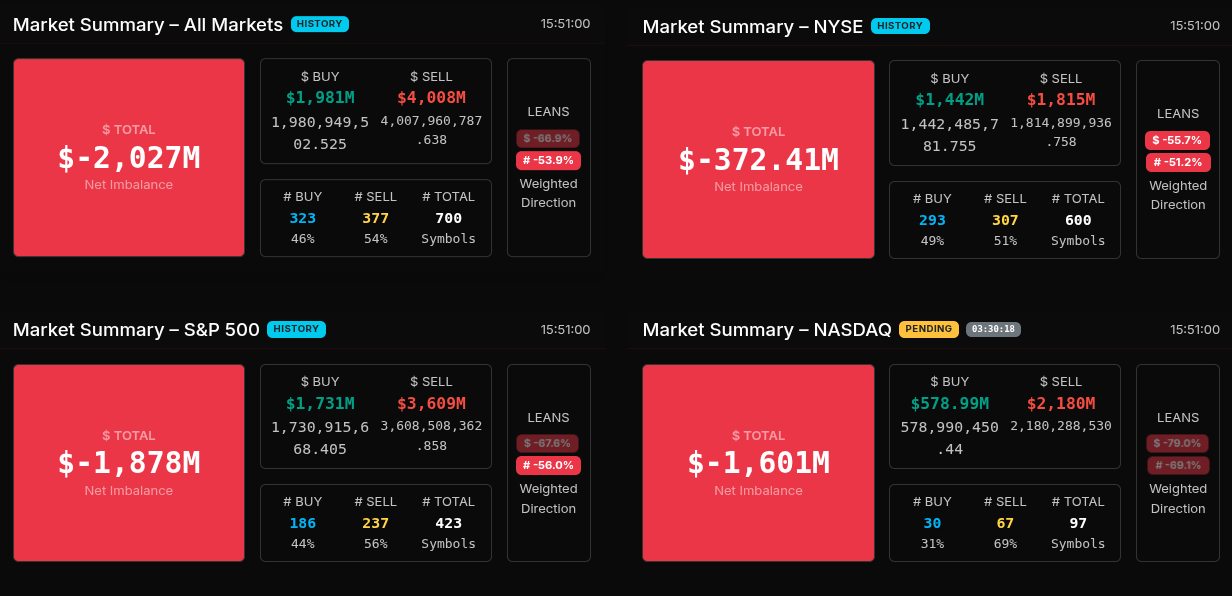
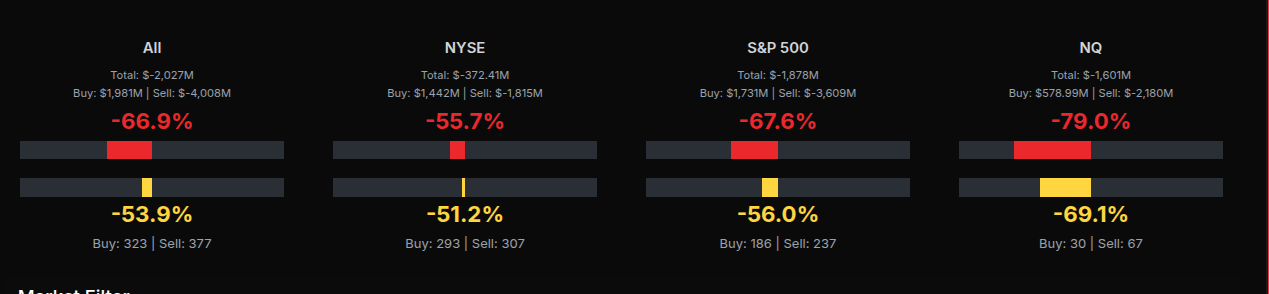
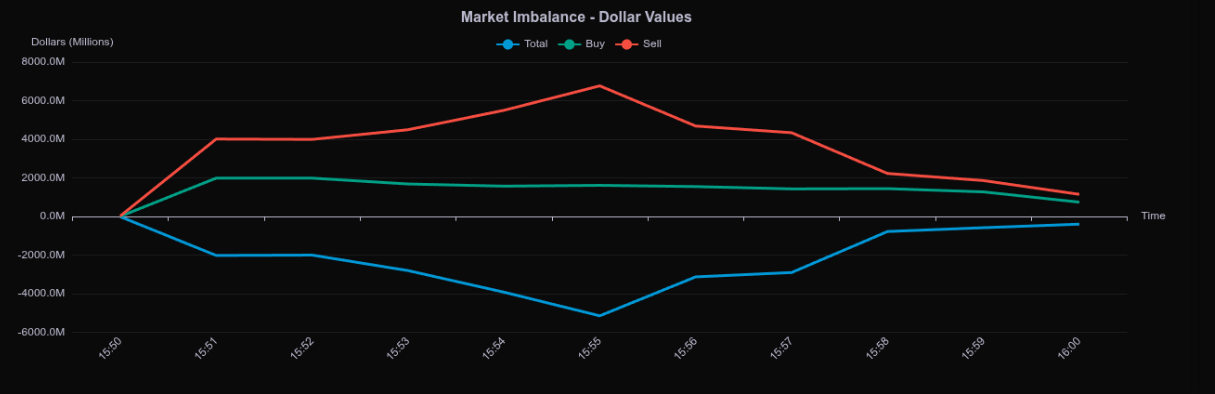
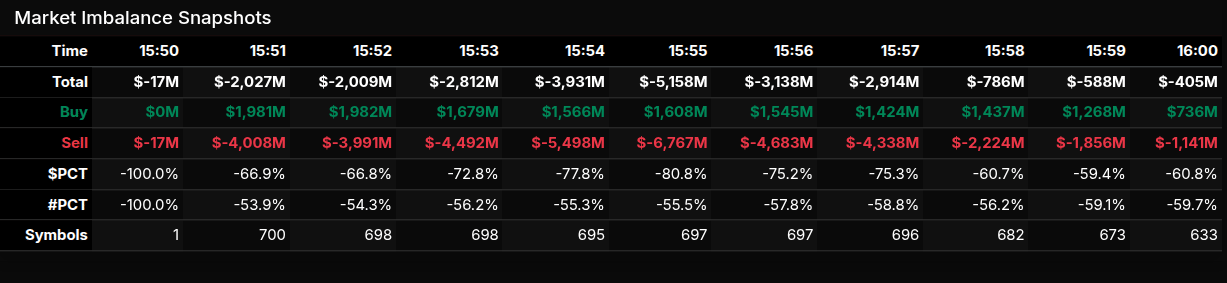
Market-on-Close (MOC) data confirmed the negative bias. The imbalance peaked between 15:54 and 15:56 with $5.5B to $6.7B to sell, representing over 75% of total notional flow on the sell side. At 15:51, aggregate imbalances reached -$2.027B overall, with the S&P 500 showing a -$1.878B sell imbalance (-67.6%) and the NASDAQ at -$1.601B (-79.0%). The symbol distribution reflected similar weakness, with 237 S&P 500 stocks showing sell imbalances versus 186 to buy.
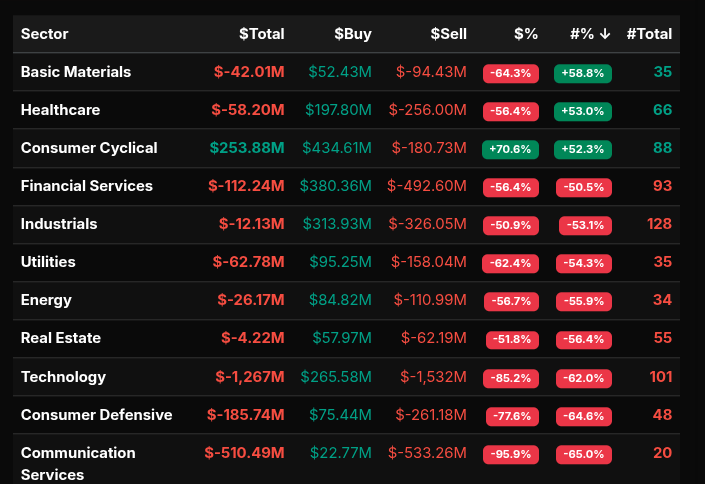
Sector data revealed concentrated selling across growth and technology names. Technology led with -$1.27B in net sell flow (-85%), followed by Communication Services (-$510M) and Consumer Defensive (-$185M). Only Consumer Cyclical registered a net positive of +$253M, likely on rotational positioning. Weighted direction metrics indicated a uniform skew toward liquidation across major groups.
In summary, Friday’s action marked a decisive shift in tone after several sessions of narrow, range-bound trading. The ES’s failure to hold above 6800.00 early gave way to broad-based liquidation that accelerated as MOC pressures hit. With the full session closing near the week’s lows and a strong negative imbalance into the bell, sentiment ended bearish heading into Monday’s trade. Any recovery attempt next session will likely hinge on whether buyers can defend the 6540–6550 support zone established late in the cleanup session..
MIM
Technical Edge
Fair Values for October 13, 2025:
-
SP: 41.1
-
NQ: 175.51
-
Dow: 218.29
Daily Breadth Data 📊
For Friday, October 10, 2025
-
NYSE Breadth: 13% Upside Volume
-
Nasdaq Breadth: 21% Upside Volume
-
Total Breadth: 20% Upside Volume
-
NYSE Advance/Decline: 15% Advance
-
Nasdaq Advance/Decline: 17% Advance
-
Total Advance/Decline: 16% Advance
-
NYSE New Highs/New Lows: 71 / 122
-
Nasdaq New Highs/New Lows: 230 / 192
-
NYSE TRIN: 0.86
-
Nasdaq TRIN: 0.77
Weekly Breadth Data 📈
For Week Ending October 10, 2025
-
NYSE Breadth: 37% Upside Volume
-
Nasdaq Breadth: 52% Upside Volume
-
Total Breadth: 47% Upside Volume
-
NYSE Advance/Decline: 19% Advance
-
Nasdaq Advance/Decline: 30% Advance
-
Total Advance/Decline: 26% Advance
-
NYSE New Highs/New Lows: 313 / 149
-
Nasdaq New Highs/New Lows: 814 / 274
-
NYSE TRIN: 0.39
-
Nasdaq TRIN: 0.39
Today’s BTS Levels:
ES Z
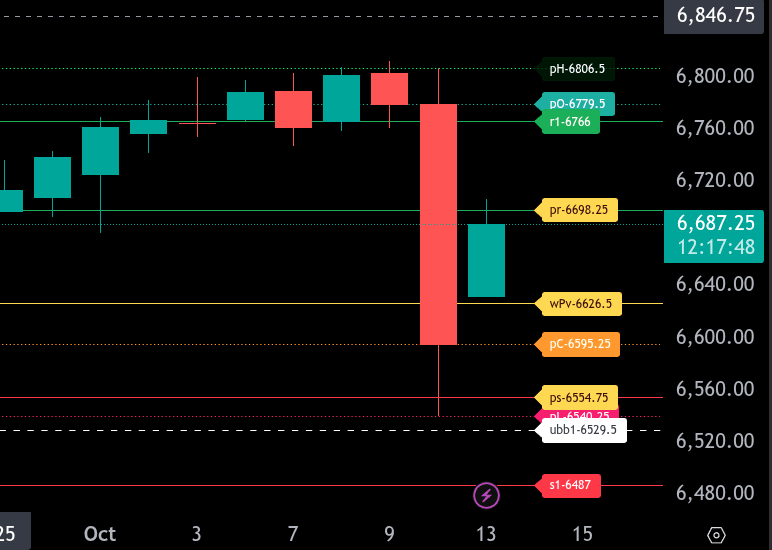
The bull/bear line for the ES is at 6626.50. This level marks the key pivot that will dictate directional bias for today’s trade. Holding above 6626.50 favors the buyers, while sustained trade below keeps momentum bearish.
Currently, ES is trading around 6685.50 in the Globex session, showing a recovery from last week’s heavy selloff. If the market can maintain strength above the bull/bear line, the next upside targets are 6698.25 (the upper range pivot) and 6766.00, with a stretch target at 6806.50. A sustained push above 6779.50 could open the door toward 6813.50.
On the downside, if ES fails to hold 6626.50, look for support at 6595.25 and 6554.75, our lower range target for the day. A breakdown through these levels exposes deeper downside potential toward 6540.25 and 6487.00.
Overall tone: neutral-to-bullish as long as ES remains above 6626.50. A sustained trade below this line shifts bias back to bearish, targeting the 6550s and possibly sub-6500.
NQ Z
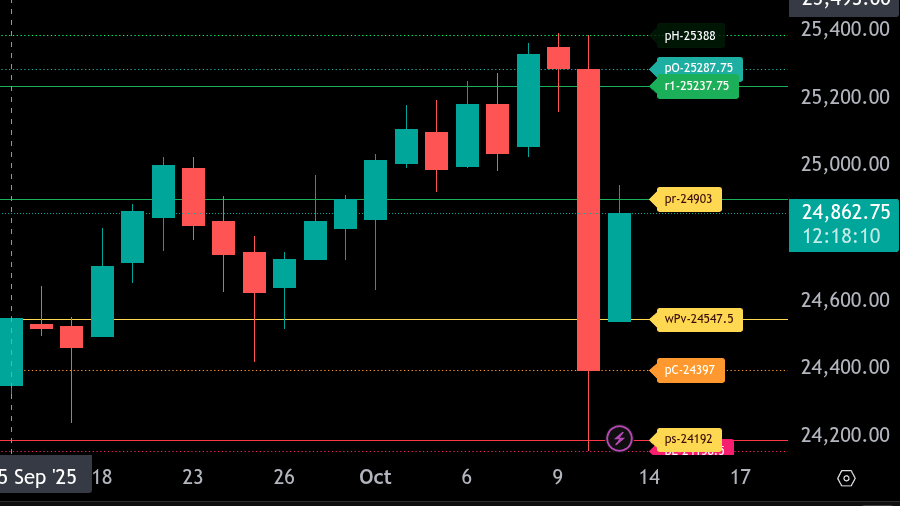
The bull/bear line for the NQ is at 24,547.50. This is the key pivot level that will guide the tone for the session. Holding above this level favors a bullish bias, while trading below suggests continued weakness.
As of the latest Globex session, NQ is trading around 24,856.25, comfortably above the bull/bear line, indicating buyers have regained control after the recent selloff. If the index can sustain above 24,547.50, the next resistance levels to watch are 24,903, the upper range target, and then 25,237.75. A break above 25,237.75 could open the door toward the previous high at 25,388.
On the downside, initial support sits at 24,397. Below that, the next levels of interest are 24,192, the lower range target, and 24,158.50. A sustained move below 24,158.50 would expose deeper downside potential toward 23,857.
Overall, the tone favors the bulls while above 24,547.50, with an upside bias toward 25,237.75 to 25,388. A break back below 24,547.50 shifts the focus lower toward 24,192 and 24,158.50.
Calendars
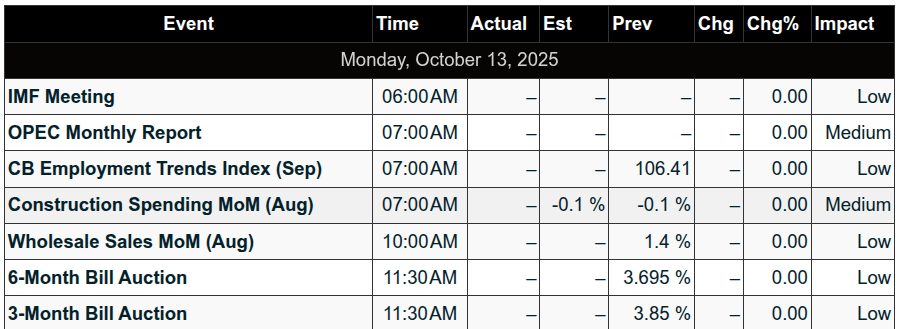
Today’s Economic Calendar
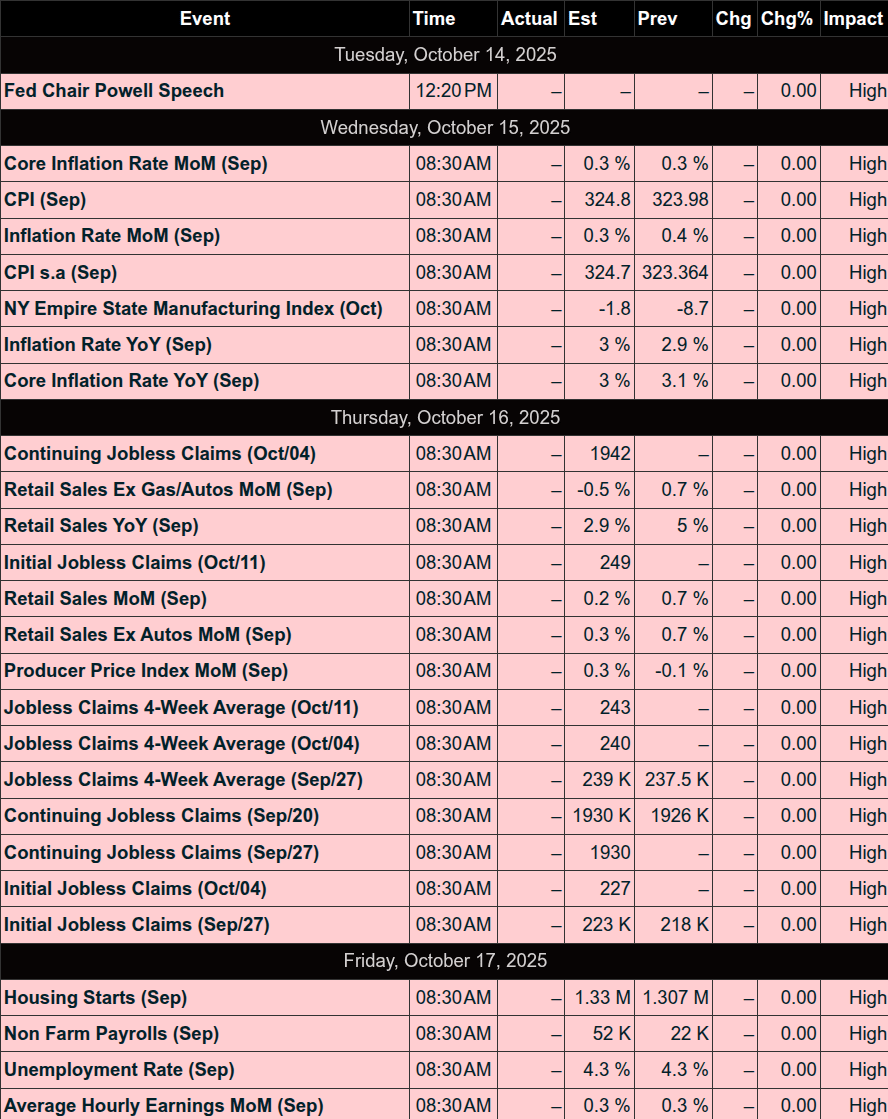
This Week’s Important Economic Events
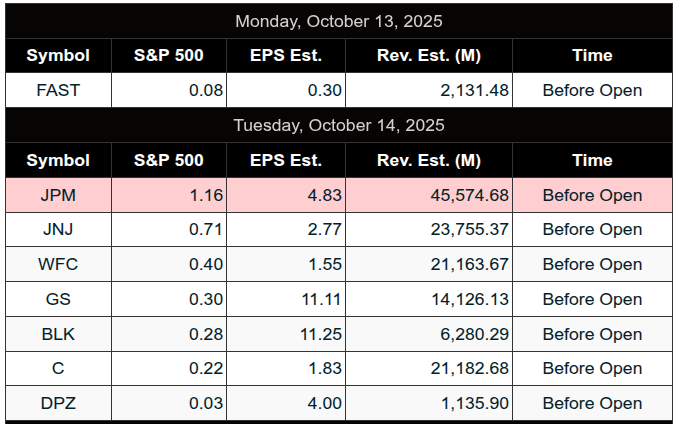
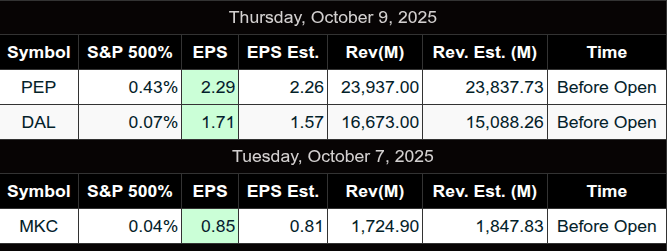
Today’s Earnings
Recent Earnings
Room Summaries:
Polaris Trading Group Summary – Friday, October 10, 2025
Capital Preservation Fryday lived up to its name as volatility surged midday, turning what began as a quiet, range-bound session into a high-octane drop triggered by geopolitical headlines.
Morning Session – Balanced, Cautious Start
-
Pre-Market Review:
David noted overnight price action hit the 6790–6795 target with “ultra precision” before dipping to 6775 “LIS” where buyers stepped in. The tone was set for capital preservation with expected MATD (Morning After Trend Day) rhythms. -
Opening Price Action:
Market opened with a tentative open-drive look, but remained choppy and indecisive. Many traders, including Manny, were cautious, expressing preference for setups that weren’t materializing clearly. -
Notable Trade:
Manny shared a +5pt long from the ONH (overnight high) backtest setup around 9:59 AM, a clean execution of a well-watched setup.
Midday Madness – Trump Tariff Tweet Bomb (TTB)
-
Event Catalyst:
Around 10:58 AM, a tweet from Trump stating “China becoming very hostile” ignited a sudden risk-off reaction. The market dove rapidly—shaking out traders and breaking structure. -
Market Reaction:
-
Massive liquidation broke below support.
-
PTGDavid referenced this as a “Tariff Tweet Bomb” (TTB).
-
A 2-STD IV level at 6670 was tagged quickly—volatility skyrocketed.
-
-
Positive Trades Amid Chaos:
-
slatitude39 nailed a +10pt long from 6675 on the backtest—great execution in high-risk conditions.
-
Earlier, he had a +40¾ point DPL by end-of-day, showing smart, selective trading.
-
Manny, recognizing the chaos, stepped away and reminded everyone: “When volatility spikes, risk doesn’t double—it multiplies.”
-
Late Session – Holding the Line & Lessons
-
PTGDavid’s Guidance:
-
Emphasized selectivity and discipline throughout the day.
-
Reiterated that capital preservation isn’t no-trading—it’s smart, patient, and rule-based trading.
-
Warned of the “trader trap” where Friday’s pressure leads to overtrading.
-
-
Price Levels:
-
Key Pivot at 6625 was highlighted into the close.
-
MOC Sell Imbalance of $2 Billion added further weight to the late-session sell pressure.
-
Lessons & Takeaways
-
Discipline > Opportunity:
PTGDavid and others modeled what it means to stay the course on a volatile day. Slatitude39’s and Manny’s restraint led to protection—and profit. -
Mindset Matters:
Manny shared raw insights on avoiding revenge trades, especially Fridays, emphasizing the importance of mental capital and knowing when to step back. -
Adaptability in Volatility:
Great trades were still possible (e.g., +10pt backtest long) if traders stayed nimble and stuck to their edge.
Summary:
Friday was a game of two halves—starting with a tight, cautious balance and ending with a Trump-induced cliff-dive. While many sat on hands, traders like slatitude39 and Manny navigated the day with precision, patience, and discipline. David’s steady leadership and reminders on capital preservation helped the room stay focused and avoid emotional pitfalls.
“Follow the plan and you are always right.” – PTGDavid
DTG Room Preview – Monday, October 13, 2025
-
Markets were rattled Friday after a post by former President Trump threatening 100% tariffs on China, sparking a sharp selloff. He later downplayed the comment over the weekend, helping fuel a strong premarket rebound this morning.
-
Friday Recap: S&P 500 fell 2.7%, Nasdaq lost 3.5%, wiping out ~$2T in market cap. Morgan Stanley warns of a potential 8–11% further decline if trade tensions persist.
-
Silver Surge: Silver soared over 3% to a record $52/oz in a suspected short squeeze. Gold continues its historic run, now above $4070.
-
Earnings Season Starts: Big banks (JPM, GS, WFC, C, BAC, MS) report Tuesday and Wednesday. Fastenal (FAST) reports this morning.
-
Shutdown & Holiday: With the U.S. government shutdown ongoing and Columbus Day today, the economic calendar is nearly empty.
-
Fed Watch: Only scheduled speaker is Philly Fed’s Anna Paulson at 12:10 PM.
-
Volatility Watch: VIX spiked Friday; ES 5-day ADR jumped to 91.25. Traders expect range-bound action today.
-
Sentiment: Whale bias bearish heading into the U.S. open on strong overnight volume.
-
Affiliate Disclosure: This newsletter may contain affiliate links, which means we may earn a commission if you click through and make a purchase. This comes at no additional cost to you and helps us continue providing valuable content. We only recommend products or services we genuinely believe in. Thank you for your support!
Disclaimer: Charts and analysis are for discussion and education purposes only. I am not a financial advisor, do not give financial advice and am not recommending the buying or selling of any security.
Remember: Not all setups will trigger. Not all setups will be profitable. Not all setups should be taken. These are simply the setups that I have put together for years on my own and what I watch as part of my own “game plan” coming into each day. Good luck!
This post goes out as an email to our subscribers every day and is posted for free here around 2 PM ET. To get your real-time copy, sign up for the free or premium version here: Opening Print Subscribe.
Comments are closed