This post goes out as an email to our subscribers every day and is posted for free here around 2 PM ET. To get your real-time copy, sign up for the free or premium version here: Opening Print Subscribe.
Burry’s Back Swingin’ Puts Like It’s ’08 and AI’s the New Subprime
Follow @MrTopStep on Twitter and please share if you find our work valuable!
FREE Two-Week Offer for the Opening Print Premium. Open up the Lean and other premium features for the next Two Weeks!
Our View
The ES made a high at 6884.00 and sold off down to 6786.25, and opened Turn-Around Tuesday’s regular session at 6810.25, down 1.1%. It traded up to 6814.00 and then dumped down to 6795.75 at 9:36, then rallied 49.75 points up to 6845.50 at 10:39. It then made a slow series of lower highs all the way down to 6796.00 at 1:39.

After the low, the ES traded up to 6815.50, traded down to 6805.50, rallied up to 6815.25, sold off down to 6794.75, traded up to 6810.50 at 3:15, pulled back to 6799.75, rallied up to 6815.25 at 3:45, traded down to 6795.75 at 3:55, and traded 6804.00 as the 3:50 imbalance showed $300 million to sell. It traded 6803.50 on the 4:00 cash close. After 4:00, the ES traded down to 6796.75, traded up to the 6808 level, and settled at the 5 pm ET close at 6806.25, down 79 points or -1.15%. The NQ settled at 25,575.25, down 528 points or -2.02%.
In the end, every time the NQ rallied, there were sellers sitting on top. In other words, every rally was met with selling.
In terms of the ES and NQ’s overall tone, it’s not hard to figure out — big tech and AI are for sale, and so is the rest of the market.
In terms of the ES’s overall trade, volume was higher at 1.63 million contracts traded.
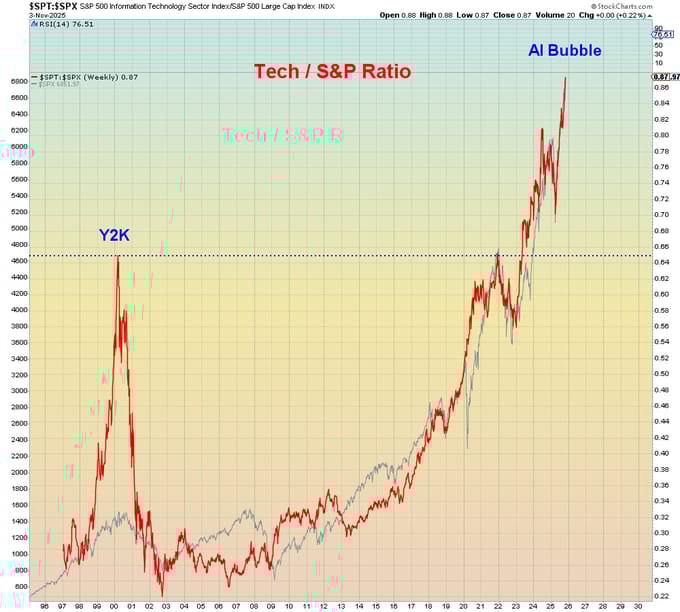
Remember the old saying, what’s hot and what’s not? Well, if we’re talking about the stock market, #tech and #AI are sizzling. I get it — many folks think that AI is already past the level of the 2000 Tech Bubble, and I am 100% sure that is correct, but back then, many of the stocks were for companies that had little to no capital, revenue, or a clear path to profitability. That’s not the case today.
In fact, the total nominal value of the 2000 tech bubble peaked when the Nasdaq Composite Index reached 5,048.62 on March 10, 2000. However, the crash resulted in an estimated loss of over $5 trillion in market value, as the index fell by more than 75% by October 2002.
Compare that to today where as of early November 2025, the combined notional value (market capitalization) of the technology and AI stocks represents a dominant force in the U.S. stock market, with the S&P 500 Information Technology sector valued at approximately $24.771 trillion, and the entire Nasdaq-100 index carrying a total market cap of approximately $25.34 trillion, driven heavily by major AI-focused companies.
While I do not think the AI bubble has arrived, Michael Burry from The Big Short does! Burry is betting that two mega AI stocks at the center of the artificial intelligence trade will drop. According to SEC filings (source), Burry bought options that will pay off if shares of Nvidia and Palantir fall.
Burry believes there are signs that an AI bubble is mounting — sky-high stock valuations, rising AI-related debt, and no clear sustainable business model. Burry, famed for predicting the 2008 subprime crisis, has placed large put option bets: over $900 million on Palantir and $200 million on Nvidia, betting that their shares will fall.
Palantir (valued at 200x forward earnings) dropped nearly 7% Tuesday after the earnings beat expectations, while Nvidia fell 3% in a tech selloff. Palantir CEO Alex Karp called Burry “bat– crazy” and accused him of manipulation.
Burry has been wrong in the past, but the recent storm of AI skepticism — and Palantir’s selloff after the close — only added more skeptics.
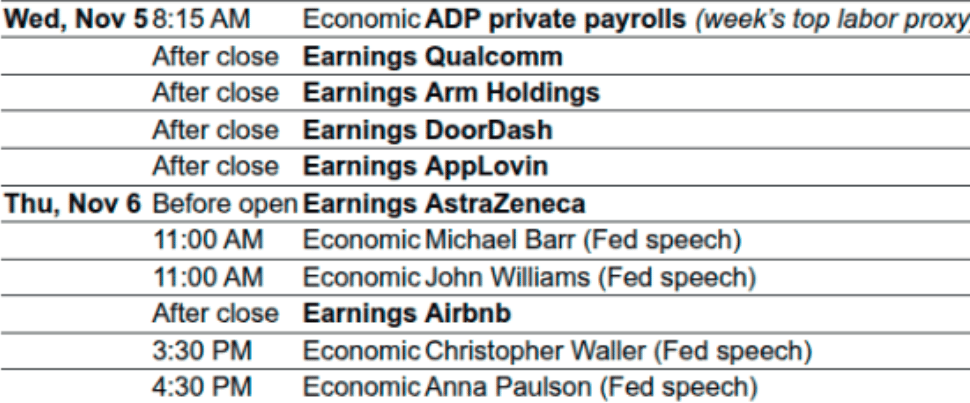
Earnings, Economic Reports and Fed Speak
Our View
Bulls don’t just shrivel up after a decline.
It’s not new news that technology and AI shares have gone a long way over the last few years — and especially since the April 7 lows. The ES has closed lower in 3 out of the last 5 sessions. The 3 losing sessions totaled a loss of 2.64%, while the 2 winning days were up 0.40% — or down 2.40% net, with the ES down another 0.35% at 9:00 PM on Globex.
The NQ is a little different: down 1.45% on 10/30, up 0.47% on 10/31, up 0.38% on 11/03, and down 2.02% on 11/04 — totaling a loss of 3.47%. The up days equal 0.85%, so the net loss is 2.62%, and it was down another 1.01% last night.
The Nasdaq has gone up so much, there should be a sell-off. The NQ traded a low of 23,453.50 on 8/21 and made its high at 26,399 on 10/30 — a gain of 2,945.50 points over 50 sessions, or an average gain of 59 points per day.
I get it — things are frosty — but I don’t see a 15% correction like a lot of people are saying. Right now, both the ES and NQ have been down 1 day in a row — and 2 in a row if they close lower today.
Can the ES and NQ fall 3 or 4 days in a row? Sure. But somewhere in here, the buyers will reappear.
Our Lean
The markets can run, but they cannot hide — they went too far, too fast.
The last two declines off the high were the 178-point drop from 10/9 to 10/10, and the 400-point drop from 8/5 to 8/21. At the current price of 6785.00, the ES is 168.75 points off its 6953.75 high.
Kill job? Not really — but that doesn’t mean there won’t be more of the same today, or at least a start in that direction. So far, the decline has been orderly, and I’m staying with the idea that this is just another pullback.
Of the 360 S&P 500 companies that have reported thus far, roughly 82% have beaten expectations, according to FactSet data. The S&P 500 is set to post a blended growth rate of more than 12%.
Our lean: I can’t rule out another drop, but I am looking for a Hump Day low. If the ES is down hard on the open, I’ll be looking to buy it or the early weakness — using tight stops.
Remember how this usually ends… it takes days and weeks to sell the ES off, and only one to bring it back.
Guest Posts

S&P 500 (ES)
Prior Session was Cycle Day 3: “Free to Move About the Cabin”
Morning action confirmed Cycle Day 1’s low (6843.25) was officially reclaimed, satisfying the 91.82% Positive 3-Day Cycle Statistic — textbook precision. With that milestone hit, the phrase of the day echoed across chatrooms and charts alike:
“Price is free to move about the cabin.”
Range was 97 handles on 1.625M contracts exchanged
For greater detail of how this day unfolded, click on the Trading Room RECAP 11.4.25 link.
…Transition from Cycle Day 3 to Cycle Day 1
Transition into Cycle Day 1:
A new cycle begins with the average decline projection (6824) already exceeded during the prior session’s distribution-phase sell-off. Price closed near the session lows, underscored by a moderately large $2.1B Market-on-Close Sell Imbalance—clear evidence that bears currently have ball control.
A break below 6785 could embolden sellers further, triggering long liquidation and potentially accelerating downside momentum.
However, traders should be mindful of a possible “trap-city” scenario—if bears fail to follow through, that could spark a squeeze-play higher as trapped shorts scramble to cover.
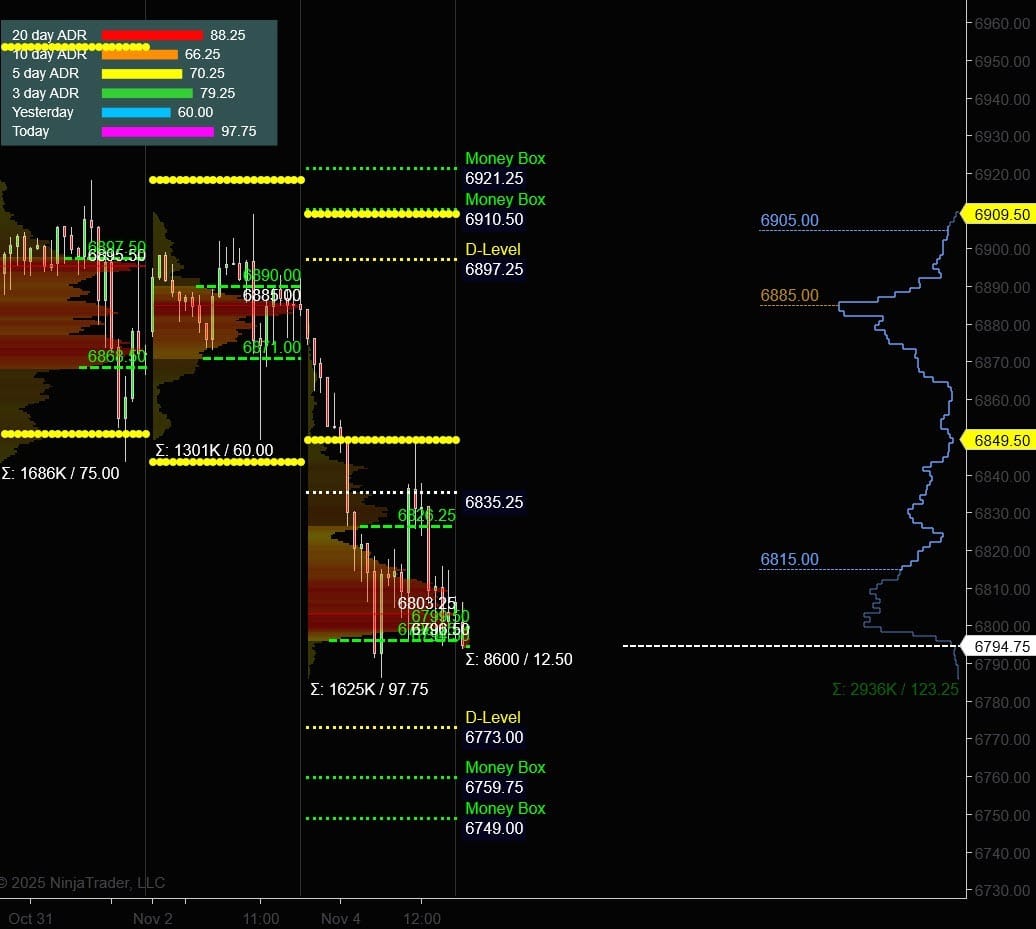
Price now sits at a critical structural crossroads:
-
Downside continuation zones: 6783 → 6773 → 6760 → 6749
-
Failed breakdown response: watch for reactive buying and a momentum reversal back into the upper distribution.
Of course, nothing changes for PTG…Simply follow your plan. Take only Triple A setups and manage the $risk. ALWAYS HAVE HARD STOP-LOSSES in-place on the exchange.
PTG’s Primary Directive (PD) is to ALWAYS STAY IN ALIGNMENT with the DOMINANT FORCE.
As such, scenarios to consider for today’s trading.
Bull Scenario: Price sustains a bid above 6785+-, initially targets 6815 – 6820 zone.
Bear Scenario: Price sustains an offer below 6785+-, initially targets 6773 – 6760 zone.
PVA High Edge = 6826 PVA Low Edge = 6796 Prior POC = 6803
ESZ
Thanks for reading, PTGDavid
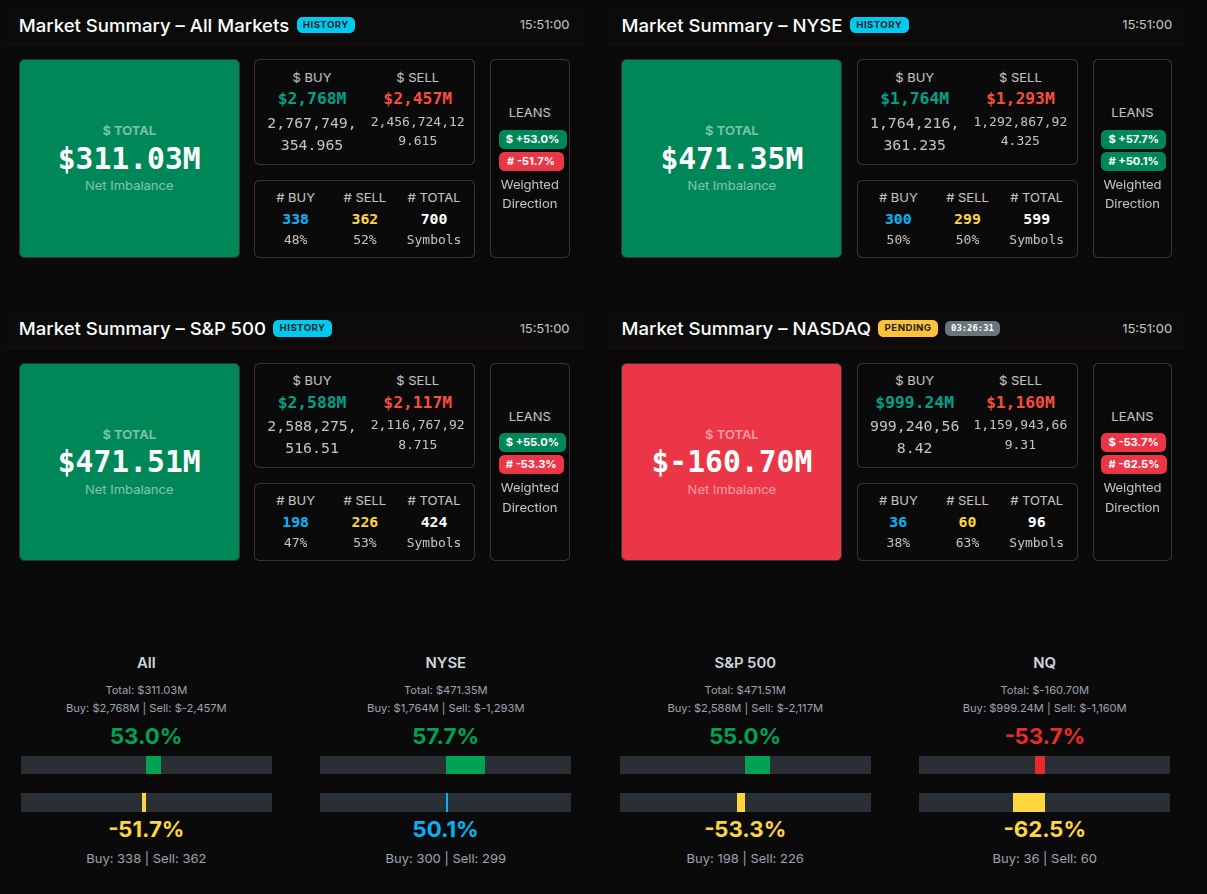
MiM
MOC Recap
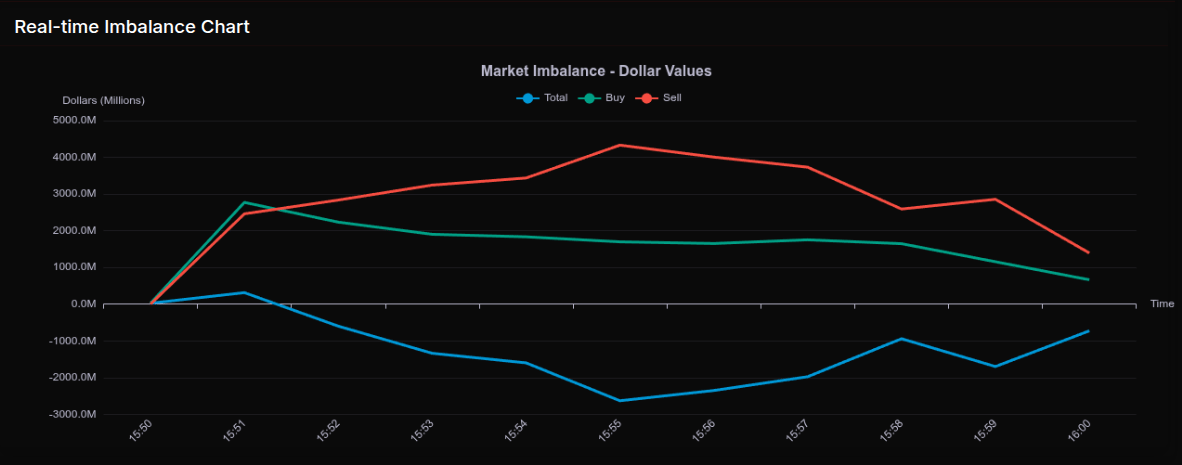
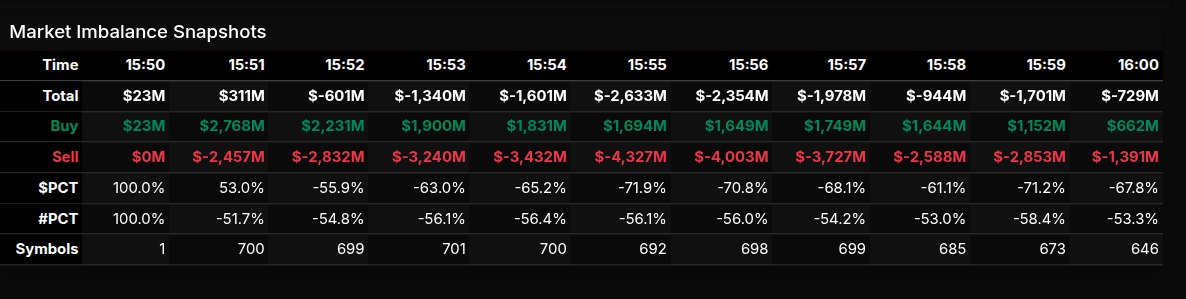
The 3:50 MOC opened with a modest buy (+$23M), then spiked to +$311M at 15:51 before flipping hard to sell. From 15:52 through 15:56, sell pressure intensified to roughly −$2.6B, then bled off into the bell, finishing around −$729M. Under the hood, the tape was split by venue and index mix: NYSE ran net buy (about +$471M) and S&P 500 constituents skewed bid (≈ +$472M), while Nasdaq names carried the liquidation (≈ −$161M).
Leans told the story of style and venue. The NYSE buy lean hovered near 58% while Nasdaq posted a sell lean near −63%, a near-wholesale tilt but just shy of the −66% “all-out” threshold. SPX sat around a 55% buy lean—supportive but not a stampede.
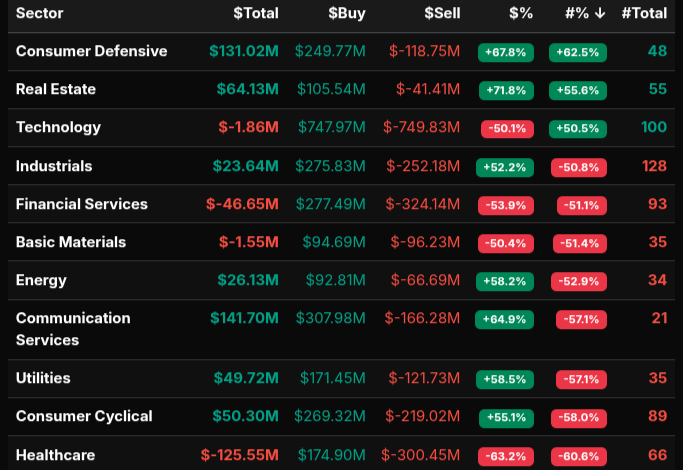
Sector flows were distinctly defensive. Consumer Defensive (≈ +$131M) and Real Estate (≈ +$64M) showed the day’s strongest wholesale demand, with leans north of +66%—classic MOC shelter-seeking. Communication Services (≈ +$142M), Utilities (≈ +$50M), Energy (≈ +$26M), Industrials (≈ +$24M), and Consumer Cyclical (≈ +$50M) were net buys, though with more mixed leans. Healthcare (≈ −$126M) and Financials (≈ −$47M) were the primary sources of supply; Healthcare’s lean pushed toward the −66% line, signaling near-wholesale selling. Technology was essentially rotational: near a 50/50 lean with a slight negative net (≈ −$1.9M), suggesting active two-way flows rather than a broad tech de-risk.
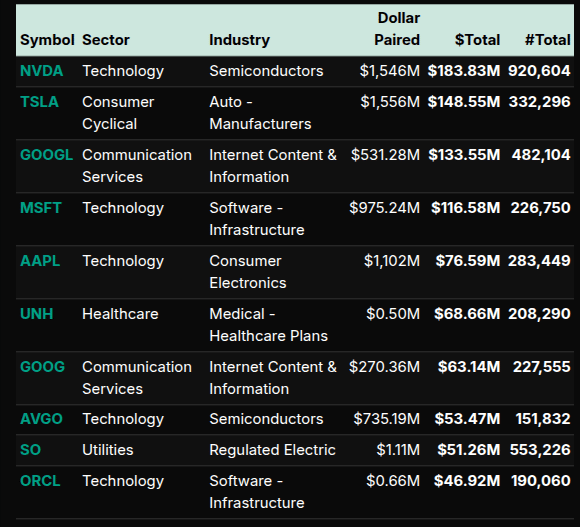
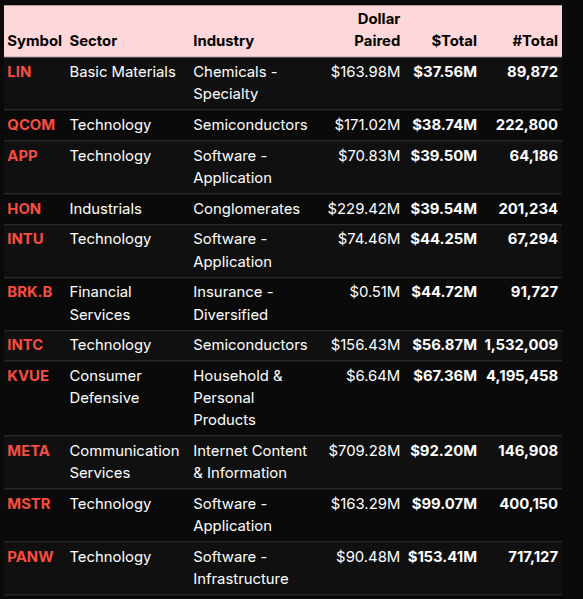
Single-name flow mirrored that split. On the buy side, large bids clustered in mega-cap tech and adjacent growth: NVDA, TSLA, GOOGL/GOOG, MSFT, AAPL, AVGO, ORCL, plus defensives like SO and a healthcare anchor in UNH. On the sell sheet, pressure showed up in LIN, QCOM, APP, HON, INTU, BRK.B, INTC, KVUE, META, MSTR, and PANW—an eclectic list spanning semis, software, and staples, consistent with the mid-auction liquidation wave.
Net-net: the MOC session opened buy, transitioned into a broad mid-run sell program led by Nasdaq and Healthcare/Financials supply, and closed with partial relief. The most notable wholesale signals were the Real Estate and Consumer Defensive buys (>+66%), while Technology’s near-50% lean flagged rotation rather than capitulation.
Technical Edge
Fair Values for November 5, 2025:
-
SP: 27.22
-
NQ: 120.59
-
Dow: 120.55
Daily Market Recap 📊
For Tuesday, November 4, 2025
-
NYSE Breadth: 27% Upside Volume
-
Nasdaq Breadth: 33% Upside Volume
-
Total Breadth: 32% Upside Volume
-
NYSE Advance/Decline: 32% Advance
-
Nasdaq Advance/Decline: 24% Advance
-
Total Advance/Decline: 27% Advance
-
NYSE New Highs/New Lows: 40 / 101
-
Nasdaq New Highs/New Lows: 70 / 297
-
NYSE TRIN: 1.52
-
Nasdaq TRIN: 0.65
Weekly Market 📈
For the week ending Friday, October 31, 2025
-
NYSE Breadth: 46% Upside Volume
-
Nasdaq Breadth: 55% Upside Volume
-
Total Breadth: 52% Upside Volume
-
NYSE Advance/Decline: 32% Advance
-
Nasdaq Advance/Decline: 35% Advance
-
Total Advance/Decline: 34% Advance
-
NYSE New Highs/New Lows: 293 / 181
-
Nasdaq New Highs/New Lows: 700 / 373
-
NYSE TRIN: 0.53
-
Nasdaq TRIN: 0.42
ES Levels
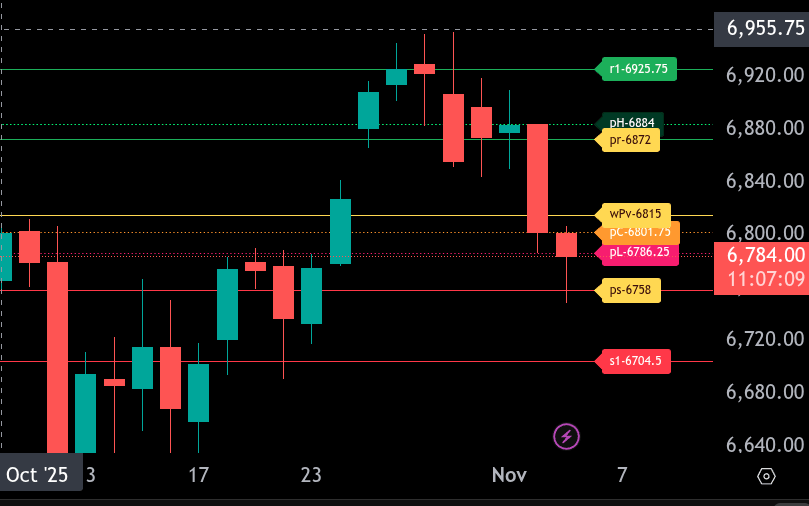
The bull/bear line for ES is 6815.00 (wPv). Below this level, maintain a cautious bearish bias; above it, look for dip buys targeting the next resistance zones.
Currently, ES is trading near 6783.50, below the bull/bear line and yesterday’s close at 6801.75. If price remains below 6815.00, look for downside continuation toward 6758.00 (lower range target). A clean break and hold below 6758.00 opens 6704.50, with risk of an extension if momentum accelerates.
On the upside, the first resistance is 6801.75 (prior close) and then 6815.00 (bull/bear line). Acceptance back above 6815.00 shifts bias higher toward 6872.00 (upper range target) and 6884.00. Sustained strength above 6872.00 puts 6925.75 in play.
Additional context: • Immediate support: 6786.25 (prior low area), then 6758.00 and 6704.50. • Near-term resistance: 6801.75, 6815.00, 6872.00, 6884.00, 6925.75. • Intraday plan: While below 6815.00, favor sells on bounces into 6802.00–6815.00 with stops a few ticks above the rejection. If 6815.00 is reclaimed and held, flip to buy-the-dip into 6815.00 for pushes toward 6872.00.
Trend view: Bearish below 6815.00; neutralizing above it with potential expansion to 6872.00–6884.00. Manage risk around the overnight extremes and be mindful of headline risk during the session.
NQ Levels

The bull/bear line for the NQ is 25,670.50. Below this level, the tone remains bearish; acceptance back above shifts the intraday bias to bullish and opens room for a squeeze.
Currently, NQ is trading near 25,453.25, which is beneath the bull/bear line. While below, look for sell‑the‑rip setups into 25,575.25 and 25,670.50. Failure in that zone favors continuation lower toward 25,522.75, then 25,370.25 (lower range target). A break and hold under 25,370.25 exposes 25,087.75 and then the 25,000.00 handle.
If buyers reclaim and hold above 25,670.50, the first upside objective is 25,970.75 (upper range target). Through there, watch 26,104.50 and 26,253.50, with an extreme stretch toward 26,357.25 if momentum expands.
Calendars
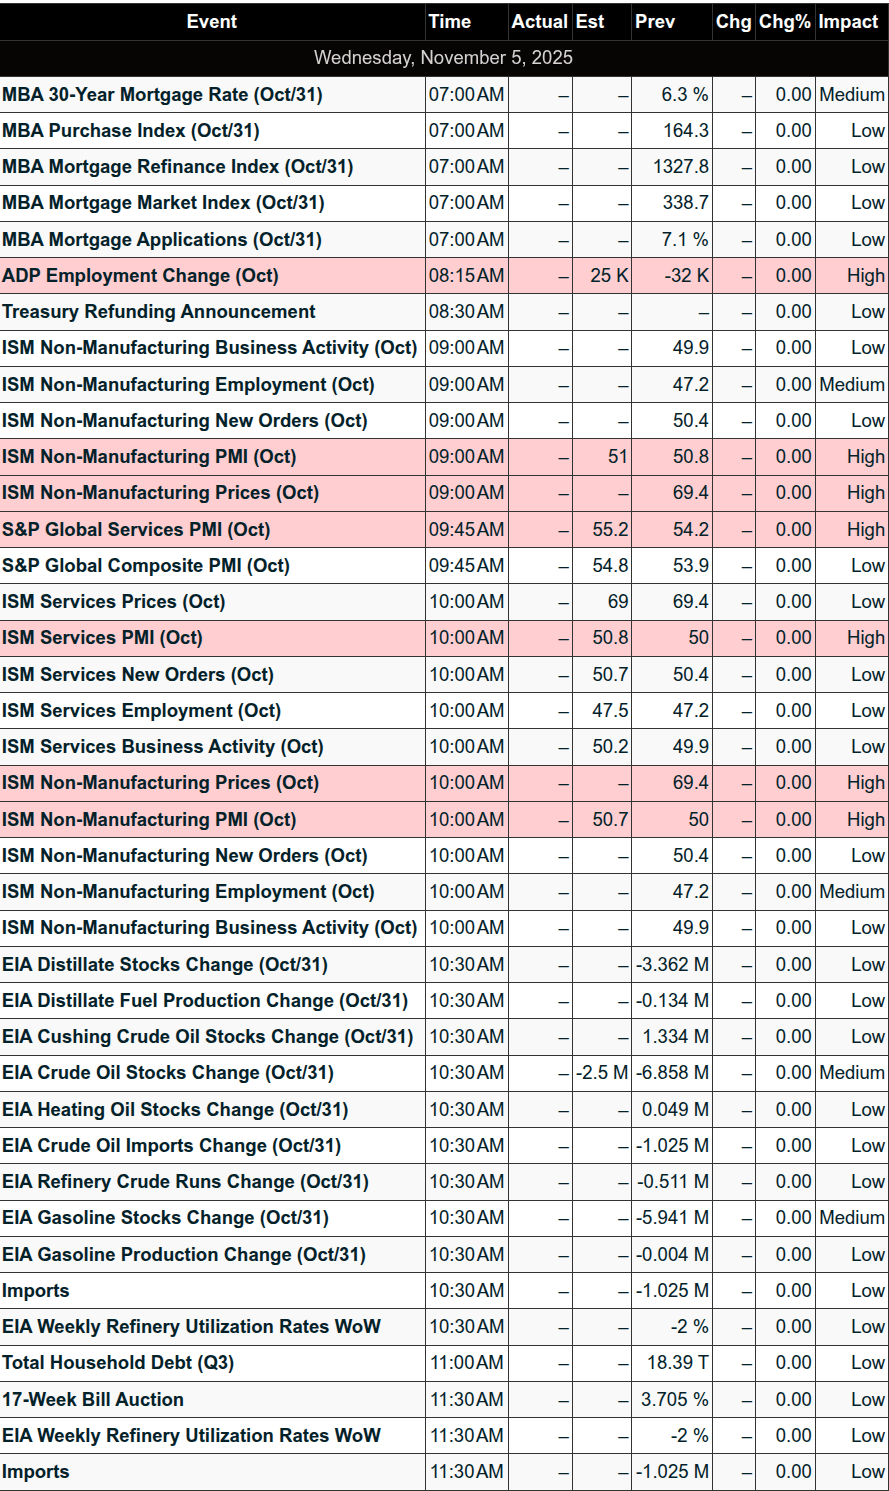
Economic
Today
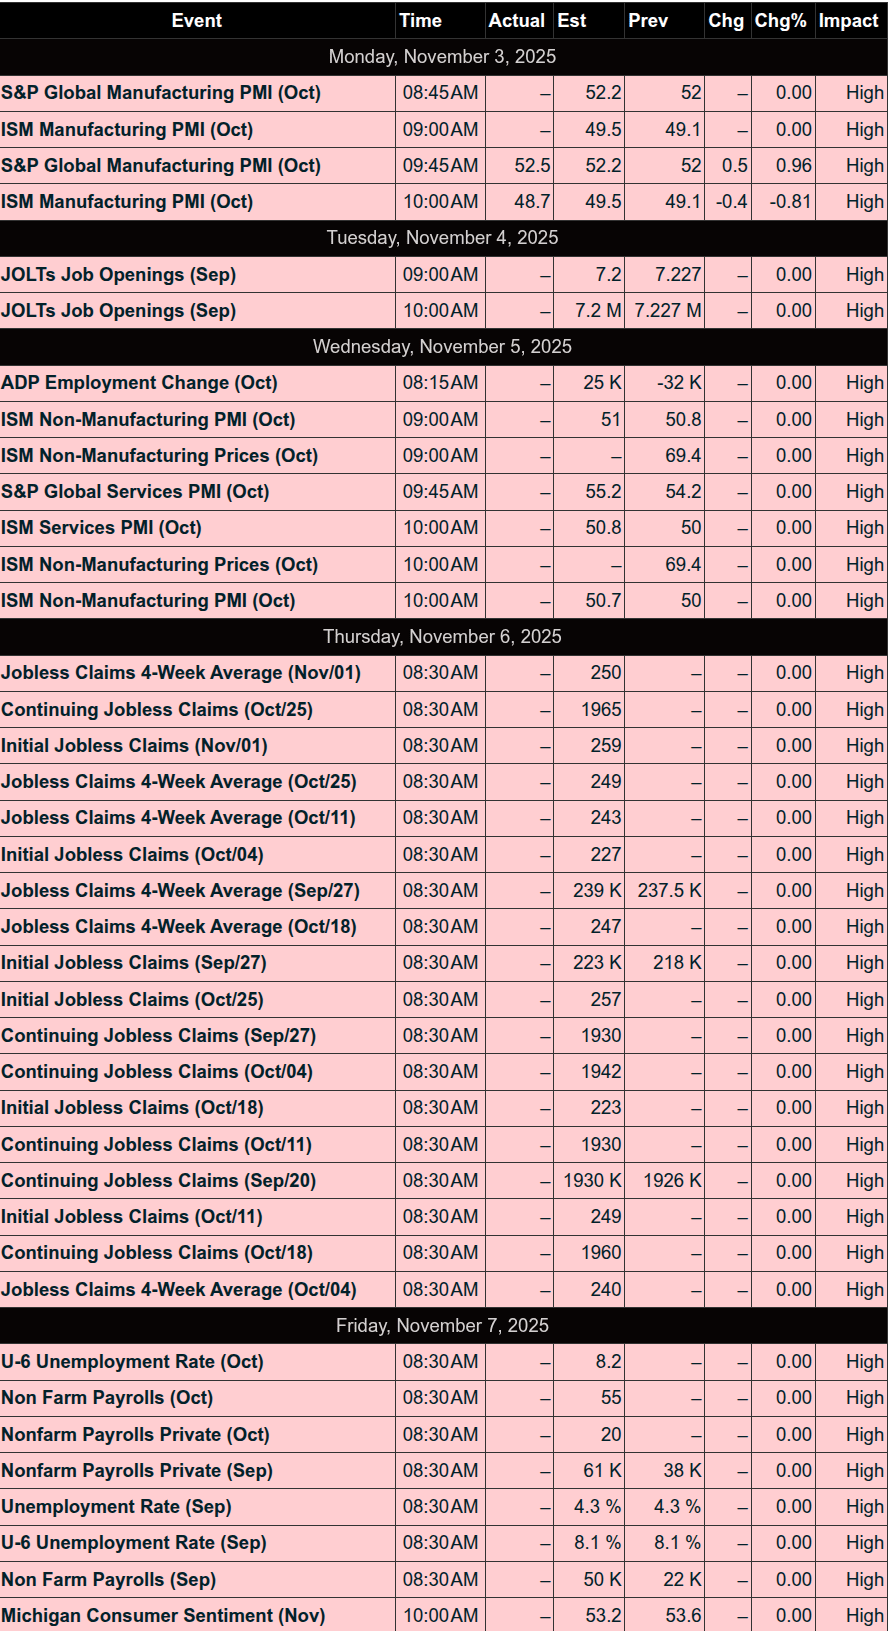
Important Upcoming / Recent
Earnings
Upcoming
Recent
Trading Room Summaries
Polaris Trading Group Summary – Tuesday, November 4, 2025
Tuesday unfolded with a clear technical roadmap and sharp execution, particularly on resistance plays. The day’s structure revolved around disciplined reactions at key levels, guided by cycle day analysis, delta shifts, and liquidity cues. The absence of a squeeze setup kept the tone tactical and tight on risk.
Key Levels & Trade Plans (Pre-market by Manny):
-
Support Buy: ES 6794 – Critical pivot. A break and close below this level hinted at a potential multi-percent drop.
-
Continuation Long: ES 6879 – For sustained upside above VWAP and cumulative delta strength.
-
Resistance Sells: ES 6849 and 6879 – Both played into the day’s landscape favoring resistance shorts.
-
Breakdown Short: ES 6789 – Failed retests and increasing negative delta were required for confirmation.
-
LB&F Setups: ES 6786 and 6641 – Quick reclaim plays signaling failed breakdowns.
Positive Trades & Execution Highlights:
-
Opening Range Longs: Called by David – These paid well early, confirming strength off the lows and supporting the CD1 thesis.
-
Manny’s Resistance Sell (ES 6849):
-
Triggered perfectly off delta flip and absorption signs.
-
Initial +5 points.
-
Added on break <6842.1 with 32 bid fills yielding 10 more points.
-
Shared chart and execution – great trade management.
-
Commended by David: “You laid it out perfectly.”
-
Lessons & Market Reads:
-
No Squeeze: Manny noted that GEX/DEX signals did not support a squeeze environment. The takeaway: respect technicals and manage risk at the edges rather than anticipate runaway moves.
-
Cycle Day Dynamics:
-
CD1 low at 6843.25 was officially reclaimed, satisfying the 91.7% Positive 3-Day Cycle Statistic.
-
Post-stat fulfillment, price was “free to move about the cabin,” as David put it — no further cycle influence.
-
-
6850 Level: Served as a battleground throughout the day, first as backtest resistance, later reclaimed then defended into close.
-
Late Day Flow:
-
Bears regained control in the afternoon.
-
Key fight zone: 6820–25 for bulls to reclaim.
-
6895 line held by bulls but capped upside.
-
Flow & Sentiment:
-
Early: Puts were being monetized → synthetic buying helped the early bounce.
-
Late: Shift to $2.3B in new put buying, showing risk-off sentiment.
-
MOC: Started as a $300M buy imbalance (dismissed by David as a “yawn”), but flipped to a $2.3B sell imbalance, closing the day with bearish pressure.
Final Thoughts:
-
Discipline over bias: Manny cautioned about recency bias from trading long setups in recent months but stuck to the chart’s signals.
-
No chase, structured setups: Even in uncertain environments, sticking to delta cues, acceptance levels, and technical structure led to a profitable and controlled day.
-
PTG Edge in Action: From timing cycles to smart adds on defined setups, the room leaned into its framework and executed sharply.
Discovery Trading Group Room Preview – Wednesday, November 5, 2025
Markets are navigating a complex mix of macro and earnings-driven factors today:
-
Political Shift & Legal Focus: Democrats scored notable victories in off-year elections, flipping governorships in NJ and VA and securing key wins in NYC and CA. Meanwhile, the Supreme Court hears a pivotal case on Trump’s tariff powers, with legal outcomes uncertain and a decision expected by year-end.
-
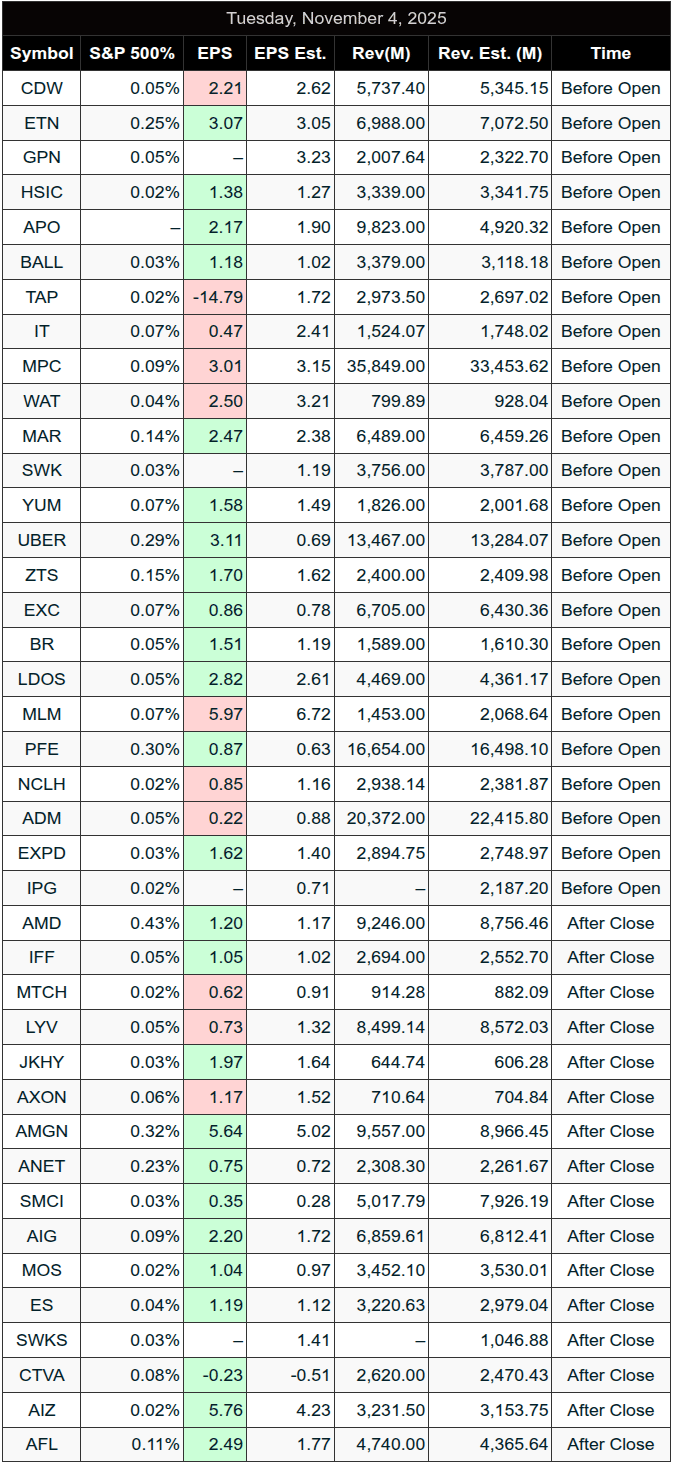
Tech & AI Under Pressure: Big Tech faced headwinds following Michael Burry’s puts on Nvidia and Palantir—both stocks dropped notably, with Palantir down 8% despite a strong earnings beat. AMD’s weak results added to the sector’s malaise.
-
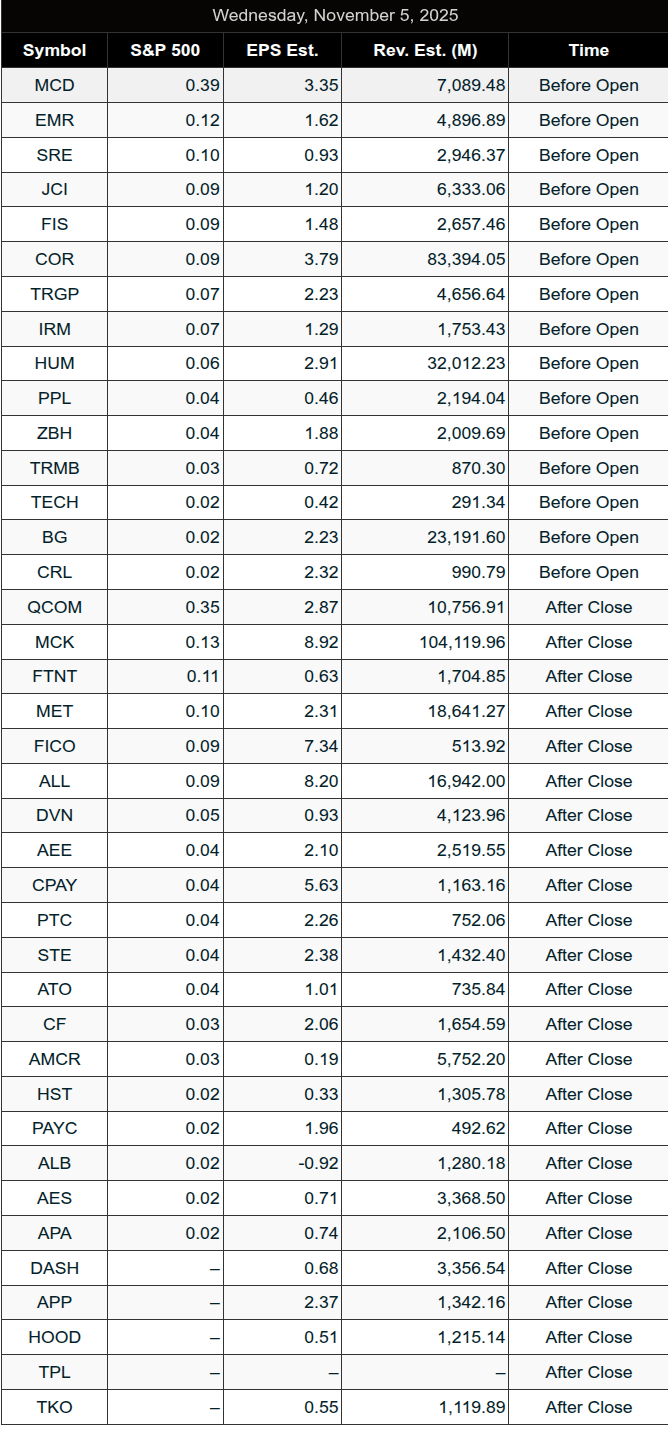
Earnings in Focus: A slew of names report today—pre-market includes Humana, McDonald’s, and Novo Nordisk; post-market highlights feature Qualcomm, DoorDash, Snap, and MetLife. Thursday opens with AstraZeneca, ConocoPhillips, and Warner Bros Discovery.
-
Economic Data Watch: Key releases this morning include ADP Jobs (8:15am ET), S&P Services PMI (9:45am), ISM Services PMI (10:00am), and Crude Inventories (10:30am).
-
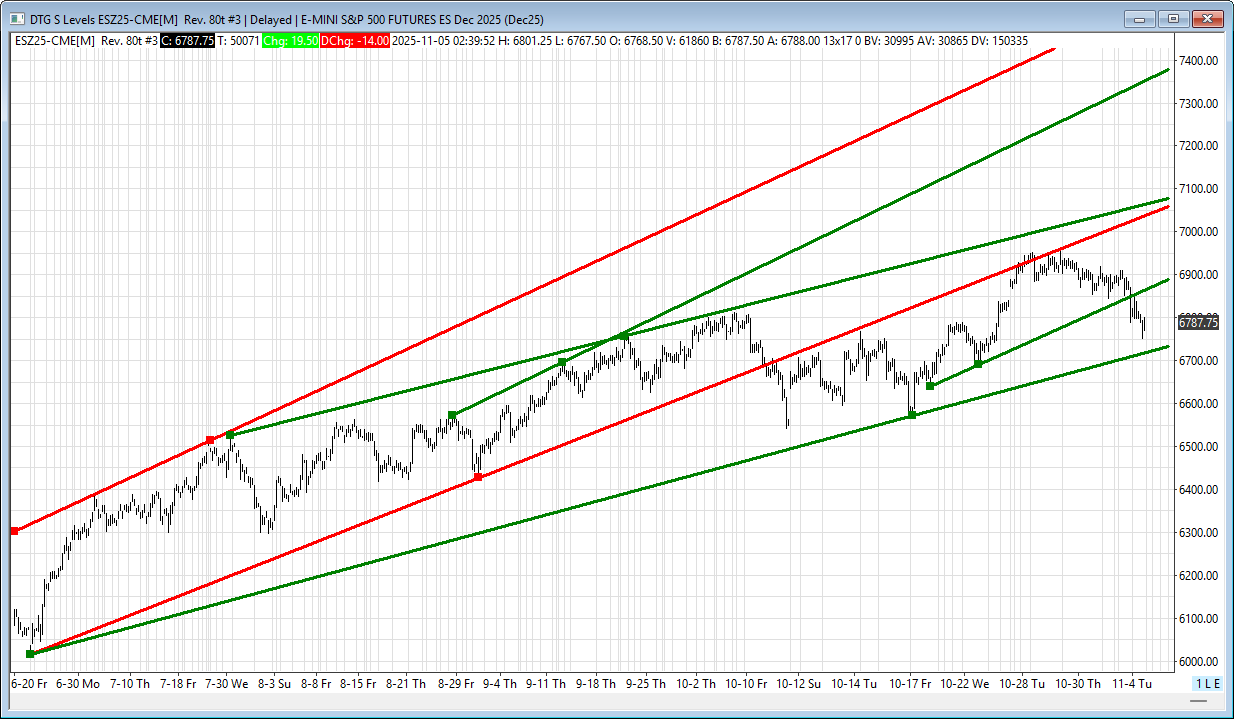
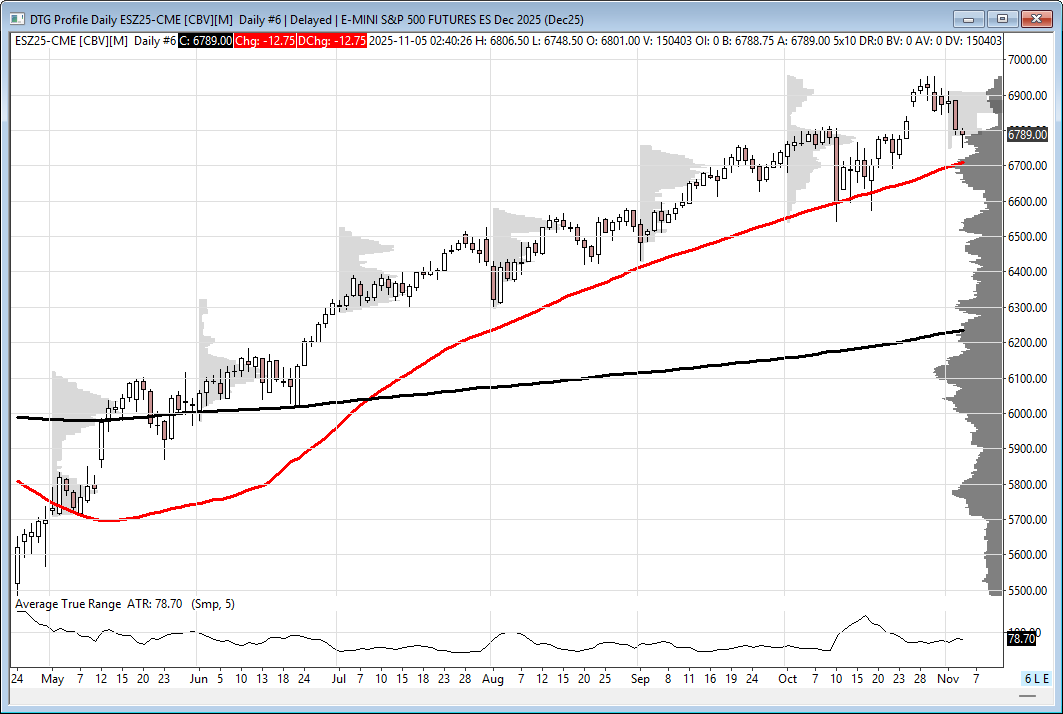
Futures Action: Volatility is up with ES holding under the former channel bottom at 6870/75 (now resistance). Support lies near the MA50 at 5710.50 and the 6721/26 TL zone. Large trader flow remains light with bearish lean into ADP data.
This morning sets up a volatile trading environment with both technical and macro catalysts in play.
Affiliate Disclosure: This newsletter may contain affiliate links, which means we may earn a commission if you click through and make a purchase. This comes at no additional cost to you and helps us continue providing valuable content. We only recommend products or services we genuinely believe in. Thank you for your support!
Disclaimer: Charts and analysis are for discussion and education purposes only. I am not a financial advisor, do not give financial advice and am not recommending the buying or selling of any security.
Remember: Not all setups will trigger. Not all setups will be profitable. Not all setups should be taken. These are simply the setups that I have put together for years on my own and what I watch as part of my own “game plan” coming into each day. Good luck!
This post goes out as an email to our subscribers every day and is posted for free here around 2 PM ET. To get your real-time copy, sign up for the free or premium version here: Opening Print Subscribe.
Comments are closed