This post goes out as an email to our subscribers every day and is posted for free here around 2 PM ET. To get your real-time copy, sign up for the free or premium version here: Opening Print Subscribe.
Carmine’s Restaurant And The AI Bubble
Follow @MrTopStep on Twitter and please share if you find our work valuable!
FREE Two-Week Offer for the Opening Print Premium. Open up the Lean and other premium features for the next Two Weeks!
Our View
Sometimes the market does what you want it to, and sometimes it doesn’t. You could be in a room with 100 people—half sold, the other half bought—and they could all lose. I know price matters, but so does timing. You could have the right level at the wrong time, or the wrong level at the right time.
Many of the old trading tools we used to make money don’t work anymore. And the ones that do work, only work as long as it takes to get coded into the algos. It’s very clear these are not our fathers’ markets or charts—and they never will be again.
The bond market was closed yesterday for Veterans Day. In most cases, that means lower prices across the board. There are also six Fed speakers today, so expect headlines.
Once the government reopens officially on Wednesday, expect a slew of economic reports in the coming days/weeks. Q3 earnings season is 91% complete, with S&P 500 EPS up 13.1% YoY, beating estimates by 5.2%, and revenue up 8.3%—the strongest since 2022. 82% of companies beat EPS (vs. 78% 5-year average).
Time flies when you’re having fun. As of today, there are 35 trading sessions left in the year on the NYSE and NASDAQ. That includes 12 remaining in November (11 full and one half-day on November 28) and 23 in December (22 full days and one half-day on Christmas Eve).
I know the ES and NQ have already moved, and I know there are downside risks. But these markets are still going up—and could accelerate higher.
Our Lean
A guy I worked with on the floor called me yesterday. He’s a nice guy, Italian, and yes, he wears the thick gold chains. I hadn’t talked to “JR” since the CME closed the floor during the COVID-19 BS pandemic. Anyway, he said he and his two cousins had just left Carmine’s Italian restaurant for lunch, and one of the guys asked if he knew me. I know, I’m a Chicago guy and grew up with a lot of Italians in high school and on the floor…you know what I mean?
After a few minutes of discussing the menu, JR says, “DBoy, I need your help, buddy.” He tells me he had a bunch of tech and AI stocks that his advisor put him into. When the market started selling off, he told his guy to get out. The guy said don’t get out, don’t do that. But JR said, “I’m taking my money, I was on the floor during the tech bubble.” He said his wife always asks him how the stocks are doing and tells him all the time: “DON’T TOUCH THOSE STOCKS.” Then he asks me, “What do you think?”
I hate these kinds of calls. He probably wouldn’t be calling if the market crashed, but now it’s going higher, and he already knows what I’m going to say. The music’s going, the other guys in the car are listening and talking at the same time, and I say, “JR, what do you want?” He says, “DBoy, tell me, did I make a mistake getting out?” I asked, “Did you make money?” He said yes. I said, “OK, then you did good.” He says, “ DBoy, you’re not answering my question. Did I make a mistake getting out?” I told him he’d better ask his wife that question, and the other guys in the car were blowing up.
After talking about my CME floor party next summer in Chicago, he says, “You know I still pay to get your newsletter, right?” I said, “Why the hell are you calling me then?”
Our lean: The moral of today’s lean is not so much about following whether to sell the ES into the early rally and buy the pull back, so much as it’s a perfect example of jumping the gun.
These markets are up so much that when they do reverse and crash, meaning 10%, 15%, 30%, 40%, we’ll know the time has come. But until then, we’d all do well to remember Warren Buffett’s most iconic line on holding stocks:
“Our favorite holding period is forever.”
I doubt it’s going to take forever for the next stock market crash, but for now, the money trade remains on the blue side of the trading card, the buy side
Key levels:
-
Upside: 6899, 6922, 6922, 6938, 6964–6950
-
Downside: 6830, 6820, 6800++, 6785+++
Market Recap
/home/marlincobb/Pictures/Screenshots/Screenshot from 2025-11-12 07-28-51.png
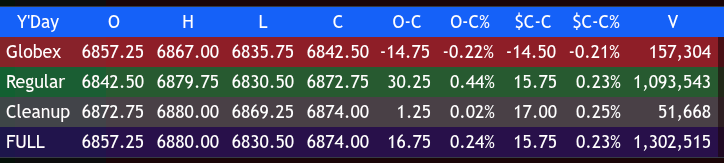
I could do a big play-by-play, but I’m not going to. The ES traded down on Globex, rallied, and opened the regular session at 6842.50. It did what I expected—early rally up to 6948.50 at 9:25, a pullback to 6837.25, then a rally to 6852.00 at 9:55. This was followed by a morning selloff to 6830.00 at 10:55, a bounce to 6851.00 at 11:20, a pullback to a higher low at 6831.00 at 11:30, and then a rally to 6857.50. Another pullback came to 6851.00 at 12:25, followed by a move up to 6876.75 at 1:30.
After that high, the ES pulled back to 6868.25 at 2:05 and slowly traded up to a new RTH high at 6879.25 at 3:10. It sold off to 6868.50 at 3:30, started to go bid, traded 6873.00 as the 3:50 cash imbalance showed $800 million to buy, shot up to 6879.75, sold off to 6867.00 at 3:55, traded 6872.75 on the 4:00 cash close, and settled at 6874.00, up 17.00 points or +0.25%, marking three up days in a row.
The NQ settled at 25,640.75, down 73.75 points or -0.29%. It made its low on 11/07 at 24,709.25 and a high at 25,768.75 yesterday—a 1,059.50 point rally in two sessions.
The YM rallied to 48,083 and settled at 48,030, up 568 points or +1.20%, up three sessions in a row—or four of the last five—surpassing its prior all-time record high set two weeks ago.
In the end, the ES and NQ reversed so fast I don’t think all the shorts have covered yet. In terms of the ES’s overall tone—it acted great. As for the NQ’s lower close, after a 1,000+ point rally in 2.5 days, a -0.29% day isn’t much. ES volume was lower at 1.304 million contracts traded.
After the Senate passed a continuing resolution (CR) 60-40 on Monday to fund the government, the House is expected to vote Wednesday. House Speaker Johnson said he expects it to pass quickly. If approved, the bill goes to President Trump, who said he will sign it into law.
Trading activity may have been below average on Tuesday as cash trading in Treasuries is closed for the Veterans Day holiday.
On tap today, Walmart (WMT) reports earnings before the bell, and Applied Materials (AMAT) reports after the close. There are no scheduled economic reports, but several Fed officials are set to speak:
-
9:20 – New York Fed President John Williams
-
10:00 – Philadelphia Fed President Anna Paulson
-
10:20 – Fed Governor Chris Waller
-
12:15 – Atlanta Fed President Raphael Bostic
-
12:30 – Fed Governor Stephen Miran
-
4:00 – Boston Fed President Susan Collins
Guest Posts

S&P 500 (ES)
Prior Session was Cycle Day 2: “Train Kept A Rollin’”
Prior Session:
Cycle Day 1 fired on all cylinders as bulls capitalized on structured continuation. Momentum carried through the overnight, setting up a textbook Cycle Day 2 rhythm — the measured, two-way battlefield where tactical rotations define the day.
Session Overview:
From the open, ES played the Cycle Day 2 script to perfection — a pullback toward the 6840 target zone, establishing lower support before the intraday rhythm kicked in. Early rotations were choppy, deliberate, and very much in line with the MATD consolidation phase — think chess match, not checkers.
As expected, two-way tactical skirmishes dominated the morning, with Manny’s LB&F setups firing beautifully around the 6834–6838 and 6848–6852 levels. Each reclaim zone served as a micro-trap for impatient shorts, fueling the next leg higher.
By mid-session, the Initial Balance (6831–6852) boxed the field. Price churned inside this “sandbox” while disciplined operators worked their playbooks — volume-weighted edges, delta confirmation, and tactical patience. Then came the moment of truth: a breakout reclaim of 6865.75 (prior high) lit the fuse on the bulls’ afternoon offensive.
The 6875–6885 target zone from the Daily Trade Strategy briefing was hit with surgical precision, validating the “bull scenario” and prompting David’s signature callout:
“Price sustains a bid above 6860+—train kept a rollin’…” 🎸
Cue Aerosmith.
After that — siesta time. Afternoon rotations faded into low-volume drift as traders booked gains and bulls fortified control. The train never derailed; it just coasted elegantly into the close.
Range was 49 handles on 1.302M contracts traded.
For greater detail of how this day unfolded, click on the Trading Room RECAP 11.11.25 link.
…Transition from Cycle Day 2 to Cycle Day 3
Transition into Cycle Day 3: The Three-Day Cycle Statistic (91.88%) remains unbroken as price cleanly fulfilled the 6856.42 objective on CD1 and reaffirmed it during CD2 — textbook execution.
Bulls closed the prior session perched near the highs, demonstrating persistent momentum and flawless defense of key structural levels.
Having met the Cycle objectives, today’s session earns “wild-card” status — capable of either continuing the current rally or staging a tactical pullback to reload the troops for another coordinated advance higher.
Stay Flexible to either scenario.
Of course, nothing changes for PTG…Simply follow your plan. Take only Triple A setups and manage the $risk. ALWAYS HAVE HARD STOP-LOSSES in-place on the exchange.
PTG’s Primary Directive (PD) is to ALWAYS STAY IN ALIGNMENT with the DOMINANT FORCE.
As such, scenarios to consider for today’s trading.
Bull Scenario: Price sustains a bid above 6875+-, initially targets 6885 – 6895 zone.
Bear Scenario: Price sustains an offer below 6875+-, initially targets 6865 – 6855 zone.
PVA High Edge = 6878 PVA Low Edge = 6842 Prior POC = 6873
ESZ
Thanks for reading, PTGDavid
Guest Post: Tom Incorvia – Blue Tree Strategies
This week, I’m taking a slightly different approach. Typically, I highlight a potential trade setup with a deeper dive into specific opportunities. However, I want to shift the focus toward illustrating setups that go beyond simple chart patterns or trendlines.
For instance, last week I noted the growing demand within the Oil Services industry and identified several individual names within the sector that reflected that same strength.
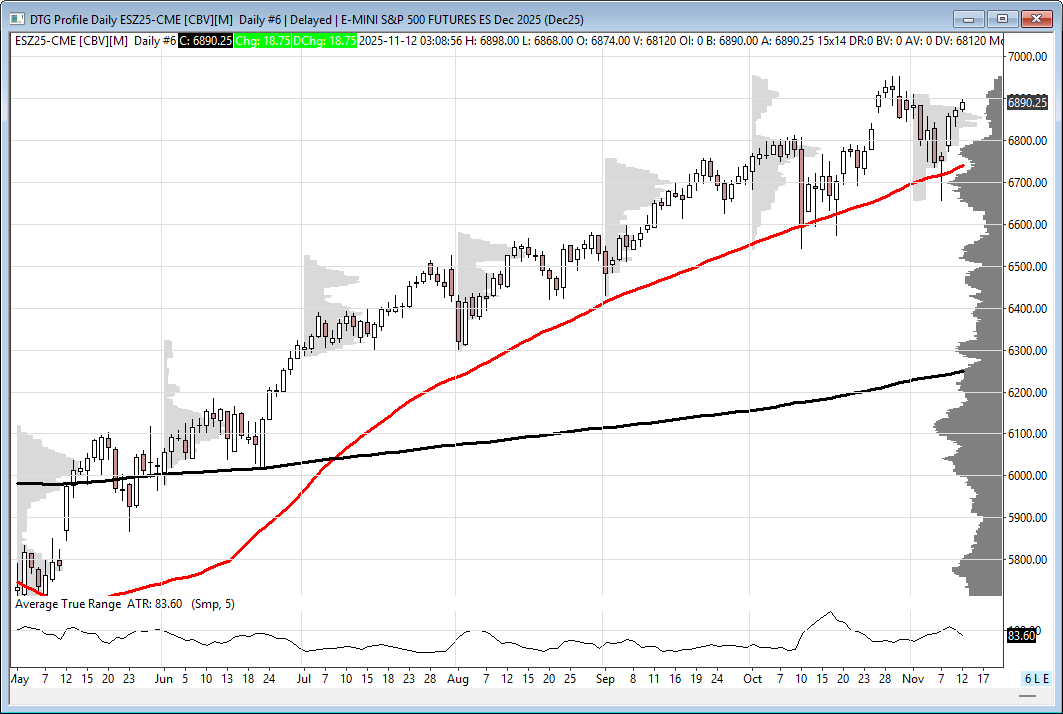
Today, my attention turns to the SPY. I’ll be breaking down how to properly apply Volume Profile—a powerful yet often misunderstood tool. Many traders use Market or Volume Profile incorrectly, overlooking its core advantage: it removes the element of time and allows price to form its natural distributions. This perspective helps uncover key supply and demand zones, offering a clearer view of where real market interest lies.
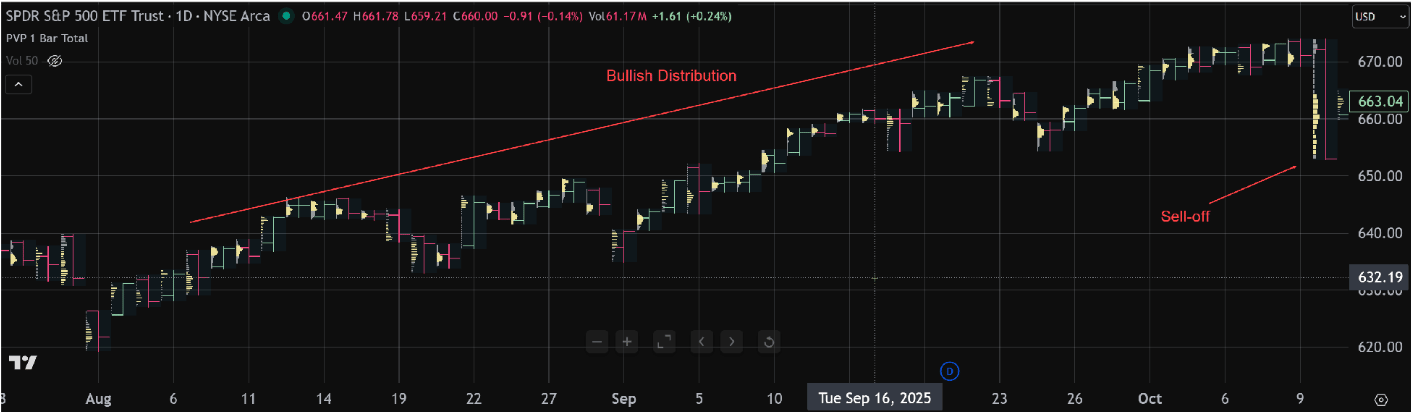
This is a daily chart of SPY. There are two things I want to point out, the bullish distribution and the sell-off on October 10th.
Over the next five trading sessions, prices remained balanced, reflecting a period of indecision among market participants. The formation of a mature, well-defined bell curve within the Volume Profile highlights this equilibrium. Such a clear distribution often signals that the market is preparing for a directional move—traders should anticipate a potential breakout, either higher or lower, as balance eventually gives way to imbalance.
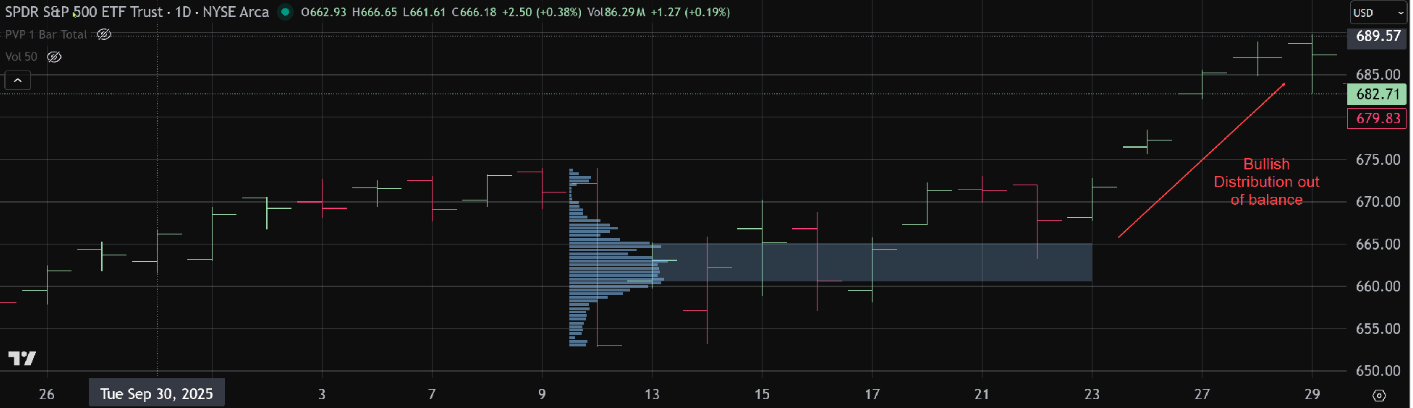
Prices eventually broke out of the balance area, initiating a new bullish distribution. This emerging structure is clearly directional, characterized by a longer and narrower profile compared to the traditional bell curve. Within this move, two distinct gaps appeared—an important observation, as gaps often signal strong trader participation and momentum. However, when two gaps occur within just three trading sessions, it can also suggest exhaustion or overextension. Since gaps are frequently revisited or filled, this served as a cautionary signal that a short-term correction could be on the horizon.
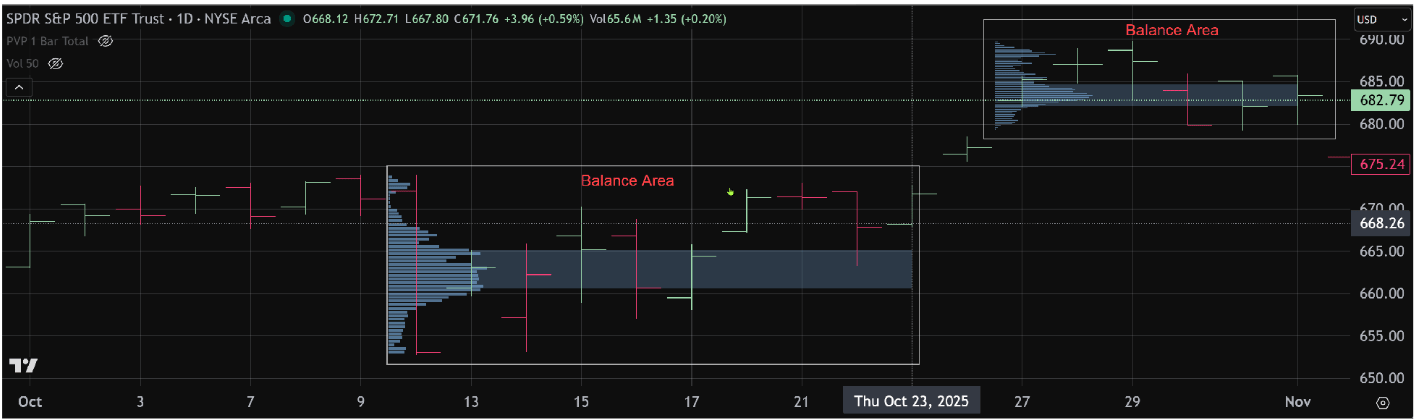
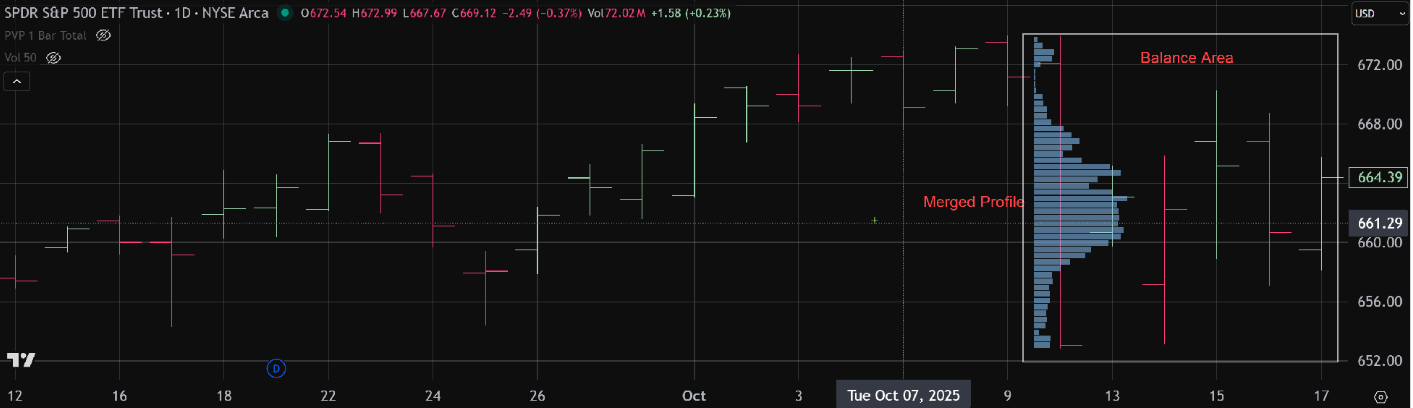
Prices stalled and over the next 6 days created a new balanced distribution. Again, signaling a new potential directional distribution.
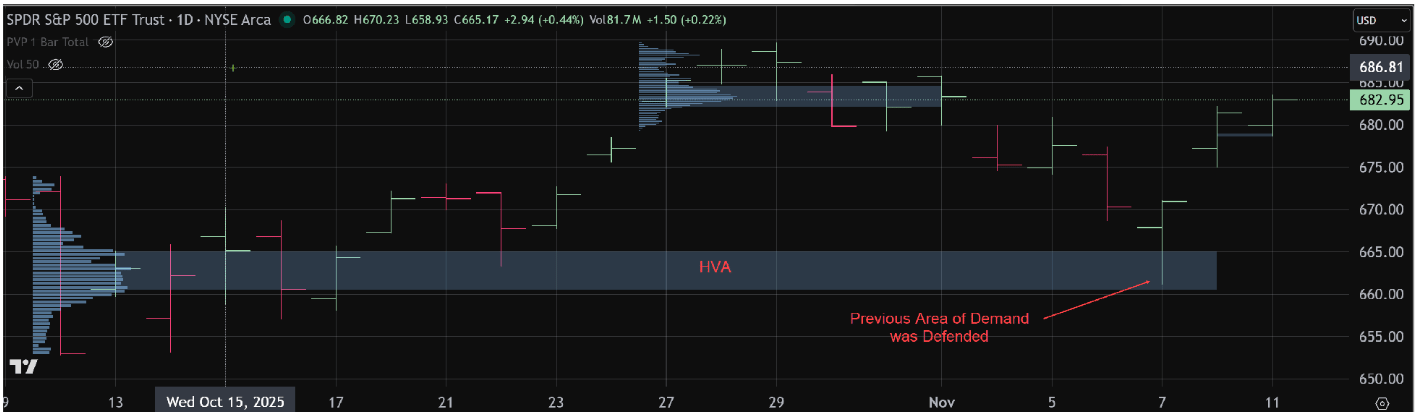
Supply eventually gained control, pushing prices lower and leading to a drift back toward a previously established High-Value Area (HVA), or zone of demand. For traders, observing prior demand areas being defended provides valuable context and often presents attractive buying opportunities. These zones highlight where institutional interest may reemerge, reinforcing the importance of monitoring how price reacts at these key levels.
By walking through this sequence—balance, breakout, and eventual return to demand—you can begin to see how the market naturally forms and transitions between distributions. Each phase tells a story about participation, conviction, and sentiment. Understanding these natural progressions allows traders to interpret the market’s true intentions rather than reacting to isolated price moves.
Ultimately, developing the ability to recognize and interpret these structural patterns offers a substantial advantage. It helps traders anticipate rather than chase and align their decisions with the underlying forces of supply and demand that truly drive price action.
Tom Incorvia began his career in financial services in 1987 and has amassed over three decades of experience navigating the complexities of the markets. His career spans both the buy-side and sell-side of the trading desks, having served as Vice President of Equity Trading and later as General Partner of a hedge fund. This dual perspective has provided him with a unique and well-rounded understanding of market behavior.
You can purchase Tom’s Course on Volume Profile here.
MiM
MOC Recap
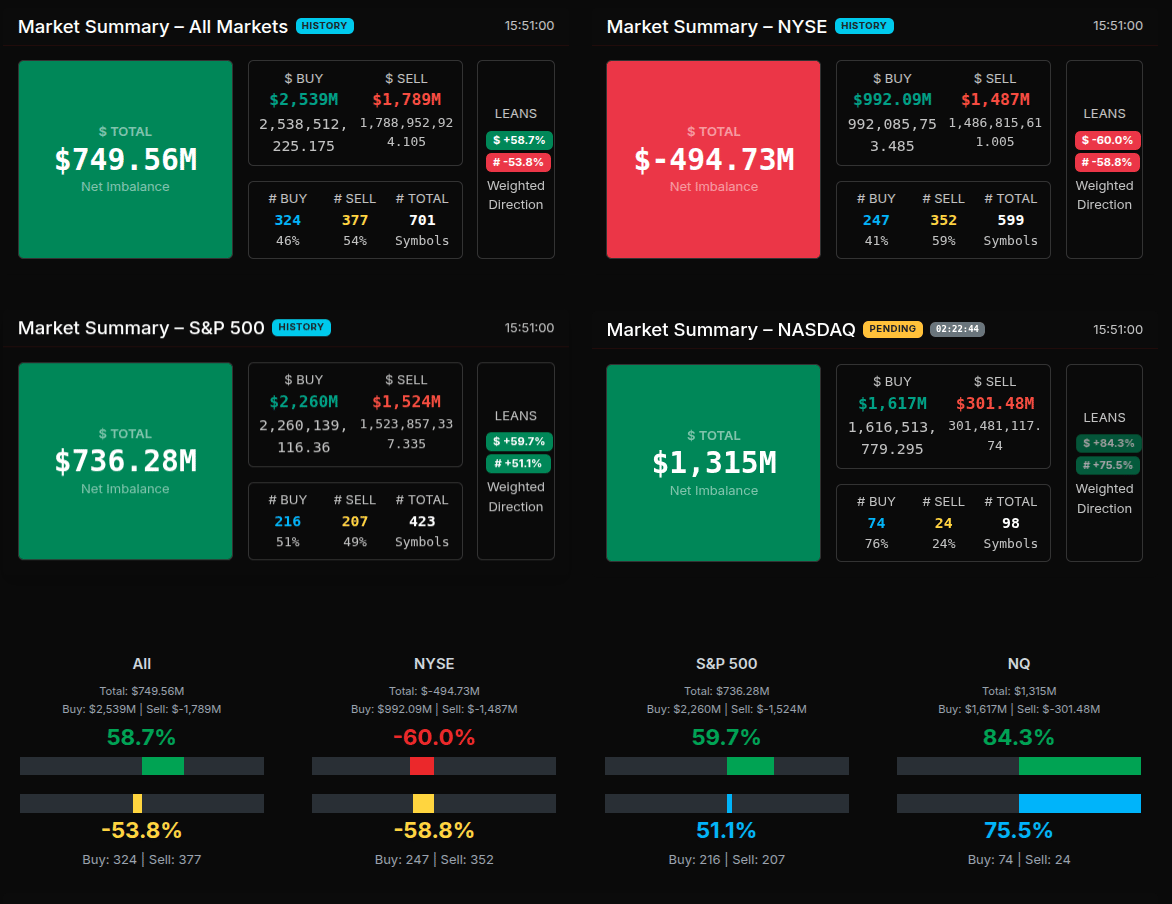
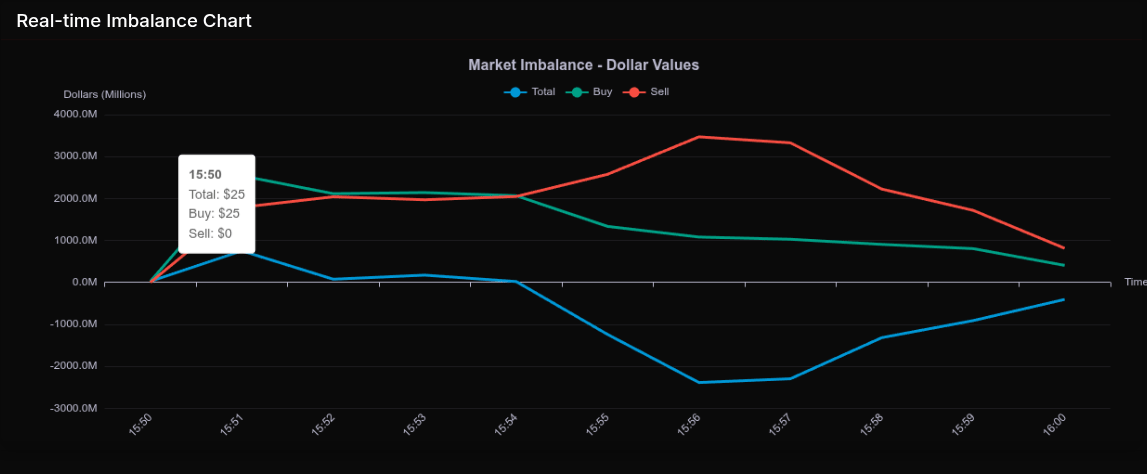
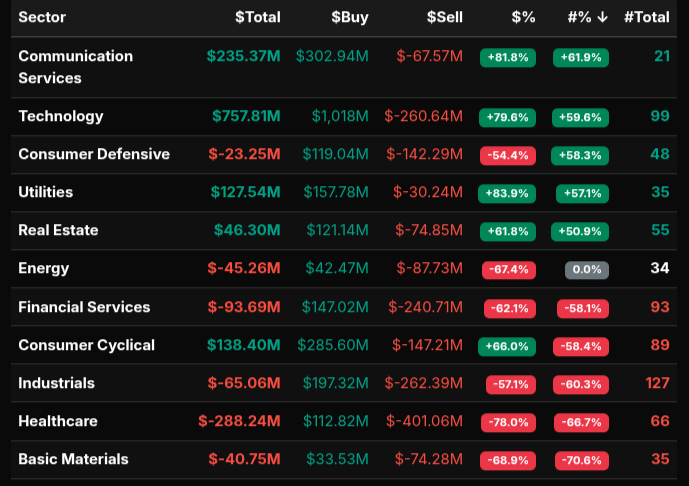
The Market-on-Close (MOC) opened with a balanced tone before resolving into a clear tech-led buy bias. Total net imbalance finished +$749 million, driven almost entirely by Nasdaq and S&P 500 strength.
The NYSE posted a –$494 million sell imbalance, showing –60% lean—its fourth consecutive session of distribution—while Nasdaq closed +$1.3 billion (+84%) and S&P 500 +$736 million (+60%). That split left the aggregate market bid but rotational underneath: strong growth/tech inflows offsetting steady redemptions in defensives and energy.
Sector breadth showed Technology (+$758 M, +79.6%) and Communication Services (+$235 M, +81.8%) dominating the buy side. Utilities (+$128 M, +84%) and Real Estate (+$46 M, +62%) also attracted capital, while Healthcare (–$288 M), Financial Services (–$94 M), and Energy (–$45 M) were offered throughout.
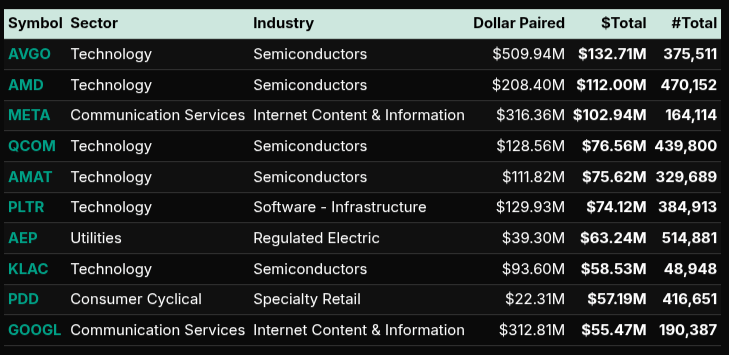
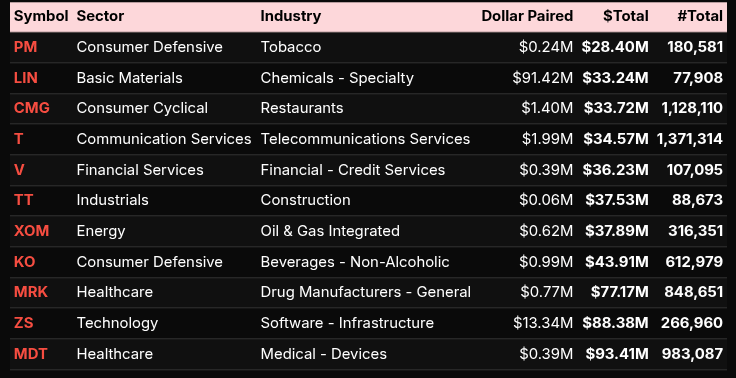
Symbol detail confirmed the rotation: AVGO, AMD, META, QCOM, and AMAT led semiconductor and AI-adjacent inflows, each posting double-digit million-dollar MOC buys. PLTR and AEP followed as secondary beneficiaries. On the sell tape, defensives and staples dominated—PM, KO, and MDT were heavily sold—joined by large-cap XOM and V, suggesting profit-taking in yield and energy names.
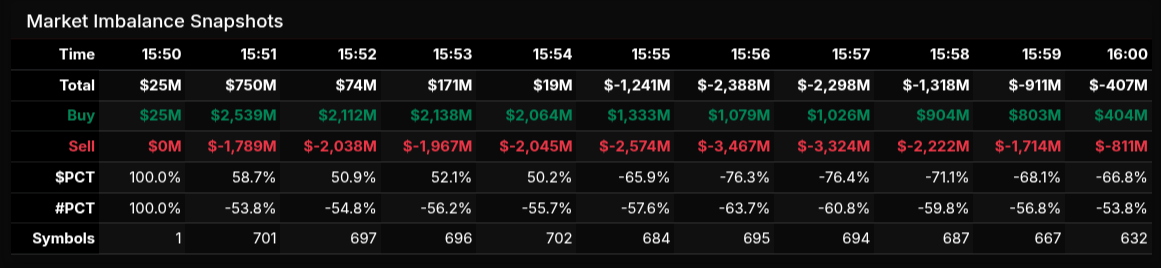
The imbalance timeline shows early equilibrium near 15:50 ($25 M net) that quickly widened to +$750 M by 15:51 as $2.5 billion in buy orders hit. Selling pressure built mid-window (15:55–15:57) with totals near –$2.3 billion before buy programs reclaimed half that into the bell, closing at –$407 M net at 16:00.
Overall, the MOC illustrated a decisive rotation back into growth and semiconductors, with Nasdaq’s +75% directional lean marking a wholesale bid. Defensive, healthcare, and energy sectors showed liquidation, confirming investors’ short-term shift toward momentum and beta exposure.
Technical Edge
Fair Values for November 12, 2025:
-
SP: 23.23
-
NQ: 101.72
-
Dow: 97.52
Daily Market Recap 📊
For Tuesday, November 11, 2025
• NYSE Breadth: 67% Upside Volume
• Nasdaq Breadth: 44% Upside Volume
• Total Breadth: 46% Upside Volume
• NYSE Advance/Decline: 65% Advance
• Nasdaq Advance/Decline: 55% Advance
• Total Advance/Decline: 59% Advance
• NYSE New Highs/New Lows: 160 / 49
• Nasdaq New Highs/New Lows: 180 / 140
• NYSE TRIN: 0.83
• Nasdaq TRIN: 1.55
Weekly Market 📈
For the week ending Friday, November 7, 2025
• NYSE Breadth: 48% Upside Volume
• Nasdaq Breadth: 47% Upside Volume
• Total Breadth: 48% Upside Volume
• NYSE Advance/Decline: 44% Advance
• Nasdaq Advance/Decline: 31% Advance
• Total Advance/Decline: 35% Advance
• NYSE New Highs/New Lows: 223 / 242
• Nasdaq New Highs/New Lows: 345 / 608
• NYSE TRIN: 0.82
• Nasdaq TRIN: 0.49
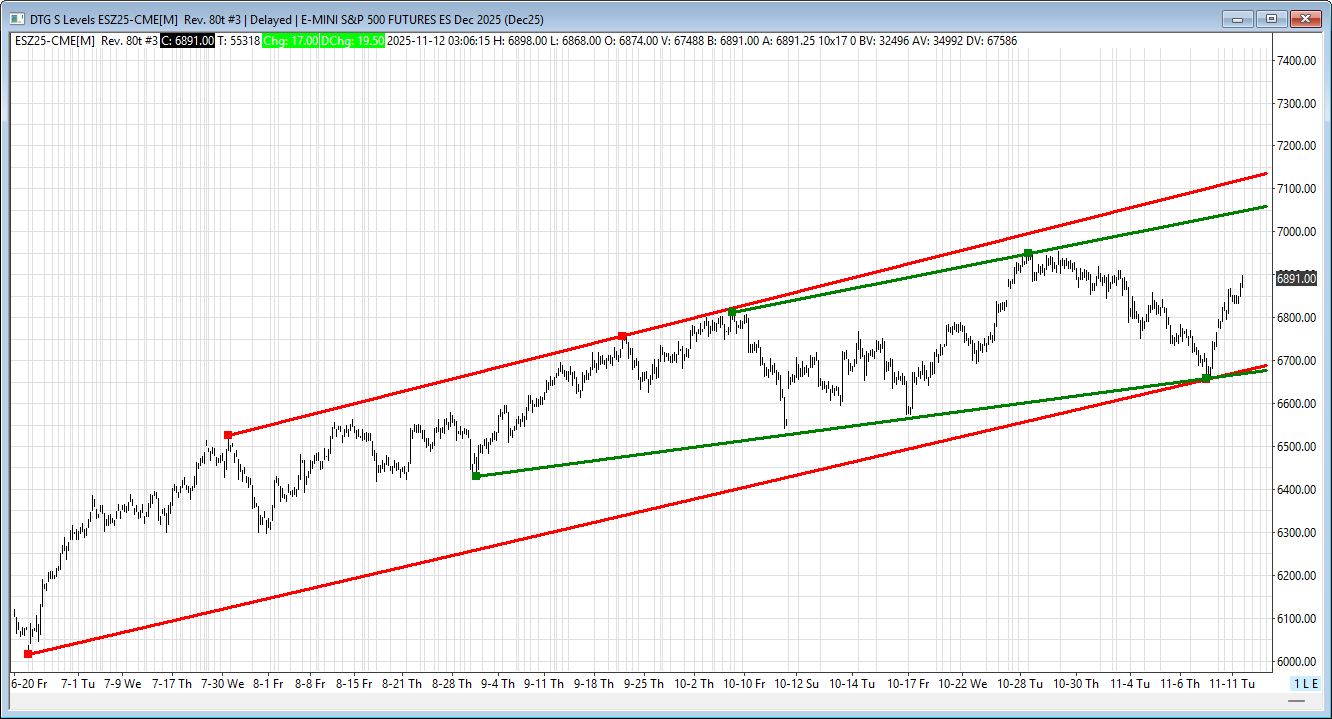
ES Levels
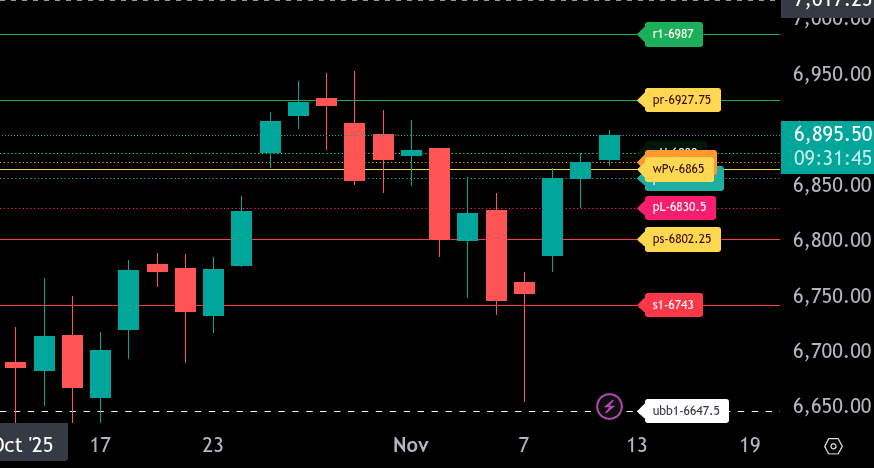
The bull/bear line for the ES is at 6865.00. Trading above this level keeps the tone bullish, while a sustained move below it would turn momentum back to the downside.
ES is currently around 6895.50 in the Globex session, showing strength above the bull/bear line. If buyers can hold above 6865.00, the next upside target is 6927.75, with further resistance near 6987.00.
If the market pulls back, initial support is at 6871.50 and then 6857.25, followed by a deeper level near 6830.50. A break under 6802.25 would likely invite a test of 6743.00.
Overall, bias remains bullish while holding above 6865.00. A sustained break back below that level would shift focus to retesting lower supports.
NQ Levels
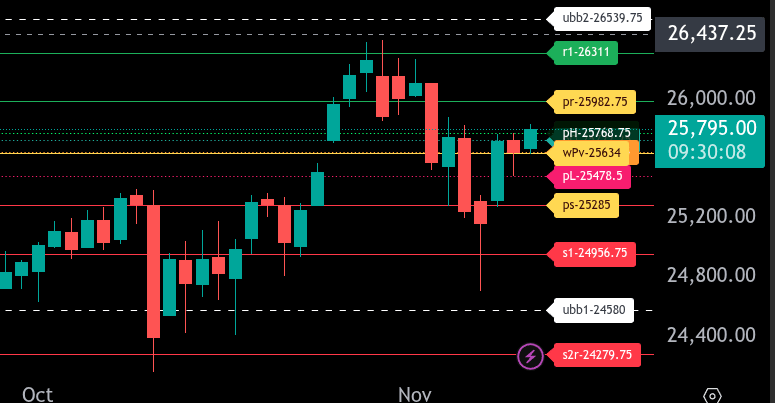
The bull/bear line for the NQ is at 25,634. This is the key level for directional bias today. Trading above favors long setups, while remaining below keeps pressure on the downside.
Currently, NQ is trading around 25,792, indicating strength above the bull/bear line. Immediate resistance is at 25,982.75, which is the upper range target. A sustained break above this could open a move toward 26,311.
If price fails to hold above 25,634, look for a retracement toward 25,478.50 and 25,285, with the lower range target at 25,285 serving as a key support zone. A deeper flush could reach 24,956.75.
Overall tone remains constructive above 25,634, with intraday bias favoring pullback buys until that level is lost. A decisive break back below 25,634 would shift momentum to sellers, targeting the lower zones.
Calendars
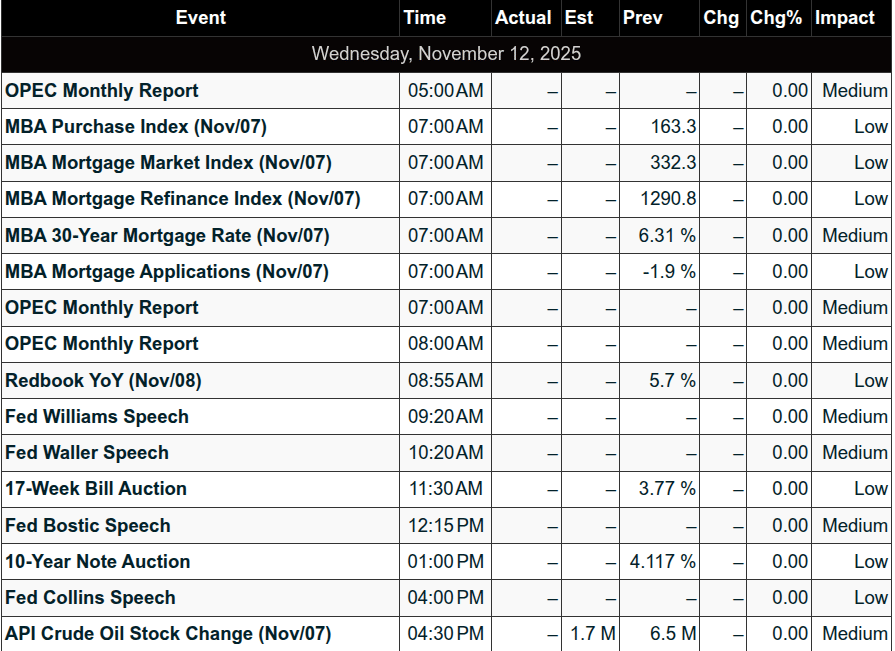
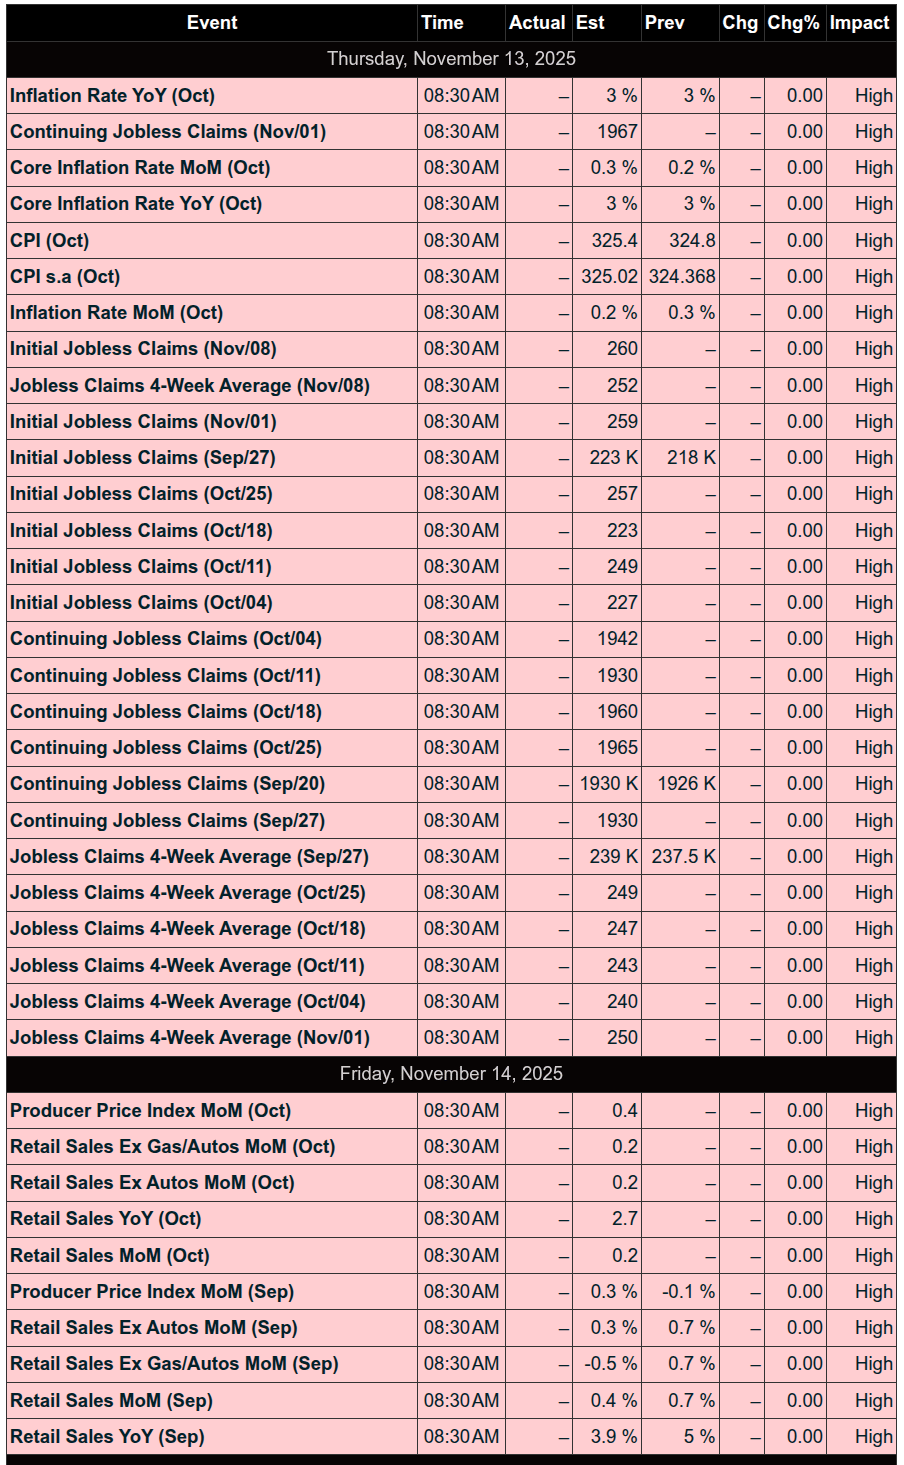
Economic
Today
Important Upcoming / Recent
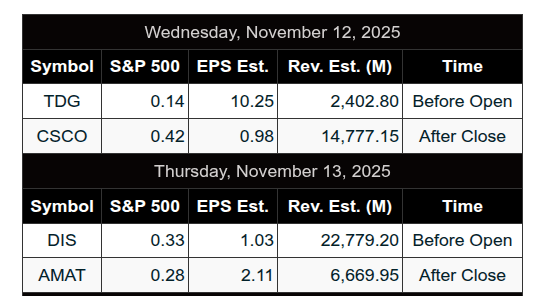
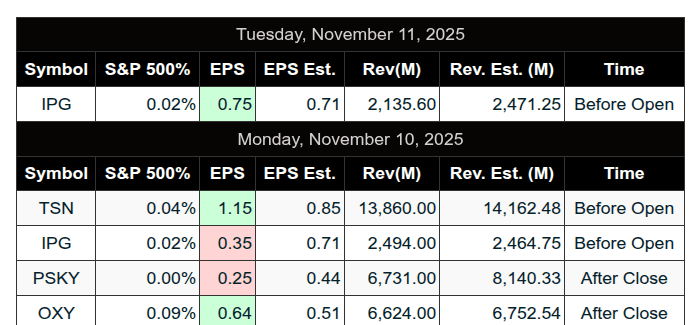
Earnings
Upcoming
Recent
Trading Room Summaries
Polaris Trading Group Summary – Tuesday, November 11, 2025
A classic Cycle Day 2 played out with rhythmic, two-sided action early, giving way to a strong afternoon rally. The room was guided through clear setups, with patience and execution emphasized.
Key Trades & Levels
-
Early Bias: ES aligned with Cycle Day 2 — expected pullbacks and consolidation zones.
-
CL: Short trigger off open range noted.
-
Manny’s Execution (ES):
-
+5 pts at 6846.50 early.
-
Later LB&F setup (6834–6838) led to +10 pts at 6847.50.
-
Clear insight shared on using delta at price for confirmation.
-
Manny emphasized planning, patience, and adapting to balance — awarded “kewpie” for the day.
-
Highlighted Levels & Outcomes
-
Key ES Zones from Trade Plan:
-
Continuation Long: 6848–6852 → Final target 6886 nearly hit.
-
LB&F Setup (6834–6838): Executed with precision → Achieved 6870+
-
-
PTG Daily Range Target: 6867 tagged perfectly.
-
DTS Briefing Target: 6875 hit “with ultra precision.”
Lessons & Insights
-
Discipline over bias: David reinforced adapting to rhythm, not forcing trades.
-
Expectancy & strategy evaluation: Brief discussion on tracking expectancy using spreadsheets.
-
Execution insight: Manny’s explanation showed the real-time complexity of delta-based entries and the difficulty of posting them in chat.
End of Day Notes
-
Afternoon Rally: Cleared and converted prior high at 6865.75 → “Train kept a rollin’.”
-
MOC Activity:
-
Initial Buy Imbalance (800M) turned to a Sell Imbalance (2B) into the close.
-
Final Level Hit: 6878.50 – another “voodoo level” completed.
-
Summary:
A day that rewarded disciplined execution and patience. Manny’s delta-driven entries offered real insight into precision tactics. ES respected key levels and delivered strong continuation upside for those who stuck to the plan.
Discovery Trading Group Room Preview – Wednesday, November 12, 2025
-
Equities:
-
Dow +550 pts on shutdown optimism
-
Nasdaq slipped on AI stock profit-taking, rotation to defensives
-
Senate funding bill through Jan 30 heads to House vote today
-
-
Policy & Regulation:
-
Rep. Luna pushing stock trading ban for lawmakers
-
86% public support per U. of Maryland survey
-
Bipartisan resistance remains in Congress
-
-
China Tax Action:
-
China targeting offshore investor profits for taxation
-
Could pressure global stocks if forced selling occurs
-
-
Supreme Court Ruling:
-
Trump admin allowed to delay SNAP payments
-
Aims to preserve GOP-Democrat shutdown deal
-
Critics accuse admin of using hunger as leverage
-
-
AMD Analyst Day:
-
Sees $1T AI data center market in 5 years
-
Forecasts 35% revenue growth, 55–58% gross margins
-
Energy supply for large-scale projects questioned
-
-
Earnings Calendar:
-
Premarket: ASND, GFS, NU, ONON, TME, TDG
-
Postmarket: CSCO, FLUT, MFC
-
Thursday AM: JD, DIS
-
-
Fed Speakers Today (ET):
-
Williams @ 9:20, Paulson @ 10:00, Waller @ 10:20
-
Bostic @ 11:30, Miran @ 12:30
-
-
Market Technicals:
-
Volatility dropped Tuesday; ES 5-day ADR at 99.50
-
Whale bias: short into U.S. open on heavy overnight flow
-
ES in mid-uptrend channel
-
50-day MA (6740.50) likely inactive unless sharp bearish turn
-
-
Key ES Levels:
-
Resistance: 7052/57, 7138/43
-
Support: 6675/80
-
Affiliate Disclosure: This newsletter may contain affiliate links, which means we may earn a commission if you click through and make a purchase. This comes at no additional cost to you and helps us continue providing valuable content. We only recommend products or services we genuinely believe in. Thank you for your support!
Disclaimer: Charts and analysis are for discussion and education purposes only. I am not a financial advisor, do not give financial advice and am not recommending the buying or selling of any security.
Remember: Not all setups will trigger. Not all setups will be profitable. Not all setups should be taken. These are simply the setups that I have put together for years on my own and what I watch as part of my own “game plan” coming into each day. Good luck!
This post goes out as an email to our subscribers every day and is posted for free here around 2 PM ET. To get your real-time copy, sign up for the free or premium version here: Opening Print Subscribe.
Comments are closed