This post goes out as an email to our subscribers every day and is posted for free here around 2 PM ET. To get your real-time copy, sign up for the free or premium version here: Opening Print Subscribe.
Mega-Cap Fireworks Light Up a FRYday Free-For-All
Follow @MrTopStep on Twitter and please share if you find our work valuable!
Our View
I said right after Trump got elected that there would be constant volatility — and so far, so good — and I think there’s a lot more to come. The other part of this? I think people have gotten their faces ripped off. Sell off hard one day, rally the next, have a big drop on Thursday and Friday, and then rally sharply the same day. Why? Because billions, if not trillions, of dollars in options are expiring.
And if you think this is nuts, just wait. If the Democrats win over the House of Representatives and start the process of impeaching President Trump, it will get even crazier. There are so many unknowns: NVDA’s earnings, economic data releases, lingering AI bubble talk, a rising VIX, and December Fed rate cut probabilities. Last week, the odds were around 45–50%, down sharply from 80% a month ago.
Everything spells volatility!!!
Our Lean
Anyone who says this trade is easy is full of it. I haven’t seen this many up-and-down false starts in a very long time. I’m long again from lower, and as I write this on Sunday night, the ES is moving higher.
I have two concerns: first, a big gap up; second, getting above the 6800–6820 level. That’s what the bulls need to restart the march to new highs. I still feel strongly that we will see an upside breakout, but so far, November hasn’t cooperated as planned.
Our lean: I’m long and trying to stay with that idea, but I have to admit — it’s not easy. You can sell the gap-up and buy the pullbacks. The last 10 Mondays have all closed higher. If the ES fails, I guess it’s back to 6700.
Market Recap
I’ve talked about this on and off for a long time. I’ve even pointed out the number of up days. It’s something that worked for 20 years — and then one day, it just stopped. It was, and still is, called Mutual Fund Monday — one of the trading rules I put into the MrTopStep Trading Rules 101 back in 2011.
There’s another rule in there that worked after last Friday’s big down open and drop — it’s called Counter Trend Friday. In fact, back when it was talked about, the idea was to buy on Friday and hold into Monday. Even the PitBull’s Thursday/Friday low is in there.
The markets have been in a state of flux, with some big dips and some big rips. Over the last 15 sessions, the largest single ES down day was -1.7% last Thursday, and the largest up day was +1.2%, with 4 of the last 6 sessions closing higher.
Yes, the ES, NQ, and YM have seen some really ugly selling — but on the other side of the coin, the ES has had two face-ripping FRYday short-covering rips.
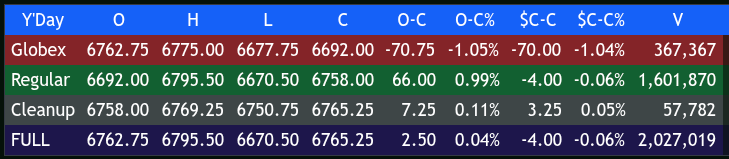
The ES sold off hard on Globex, down to 6677.75, a drop of 70.75 points or -1.05%, and opened Friday’s regular session at 6692.00. After the open, the ES traded 6692.00, and in the same minute, sold off to 6650.50 (RTH low). And that was it for the downside.
After the low, the ES rallied 116.25 points to 6766.75 at 10:45, dropped 19.25 points to 6747.00 at 11:05, then rallied to 6789.00 at 11:40. It sold off to 6770.00 at 11:45, rallied 25.25 points to 6795.25 at 12:10, dropped to 6780.75, rallied to a new high at 6785.50, dipped to 6760.75, then climbed back to 6782.50 at 1:10. It dropped 29 points to 6753.50 at 1:45, rallied to 6790.00, and then dropped 39.50 points to 6750.50 at 3:45. A new low was made at 6750.00 at 3:56 before ticking back up to 6750.50 as the 3:50 cash imbalance showed $600 million to sell. It traded 6758.00 on the 4:00 cash close.
After 4:00 (the new game in town), the ES rallied to 6769.25 and traded 6765.25 at the 5:00 session close down just 4 points (-0.06%) from the previous session close. The NQ settled at 25,147.50, down 5.25 points, or -0.02% on the 5:00 cash close.
In the End
The theme on Friday was clearly the Magnificent 7. After the initial drop off the open, the NQ started going bid — and it didn’t stop. It was one mega buy program after another, adding gunpowder to the already oversold ES.
After some big early losses:
-
Nvidia (NVDA) and Microsoft (MSFT) closed up more than +1%
-
Tesla (TSLA) closed up +0.59%
-
Amazon (AMZN) closed down more than -1%
-
Alphabet (GOOGL) closed down -0.77%
-
Apple (AAPL) closed down -0.20%
-
Meta Platforms (META) closed down -0.07%
In terms of the ES’s overall tone, it acted well, but some of the intraday moves were extreme. In terms of trade, stayed steady at 2.03 million contracts.
Looking Ahead
While the government gets back to business, so will a deluge of economic reports. The big one this week is the September jobs report, coming Thursday — over a month and a half behind schedule. But remember: the Fed already had the data, so I’m sure it will be fudged. The timing of when the other key economic indicators go back online is still undecided. These include GDP and Consumer Spending, both key data points that investors will watch for economic clues.
You can view the updated schedule on the BLS website: BLS Revised Release Dates
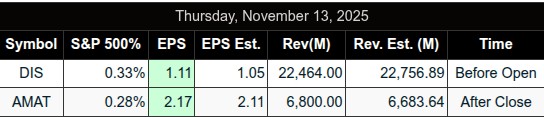
As for earnings:
According to FactSet, 92% of companies have reported Q3 earnings. Of those, 82% beat EPS estimates.
Upcoming reports:
-
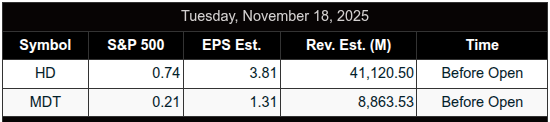
Nov 18: Home Depot (HD), Medtronic (MDT)
-
Nov 19: Nvidia (NVDA), Snowflake (SNOW), Palo Alto Networks (PANW), Lowe’s (LOW), TJX Companies (TJX)
MiM
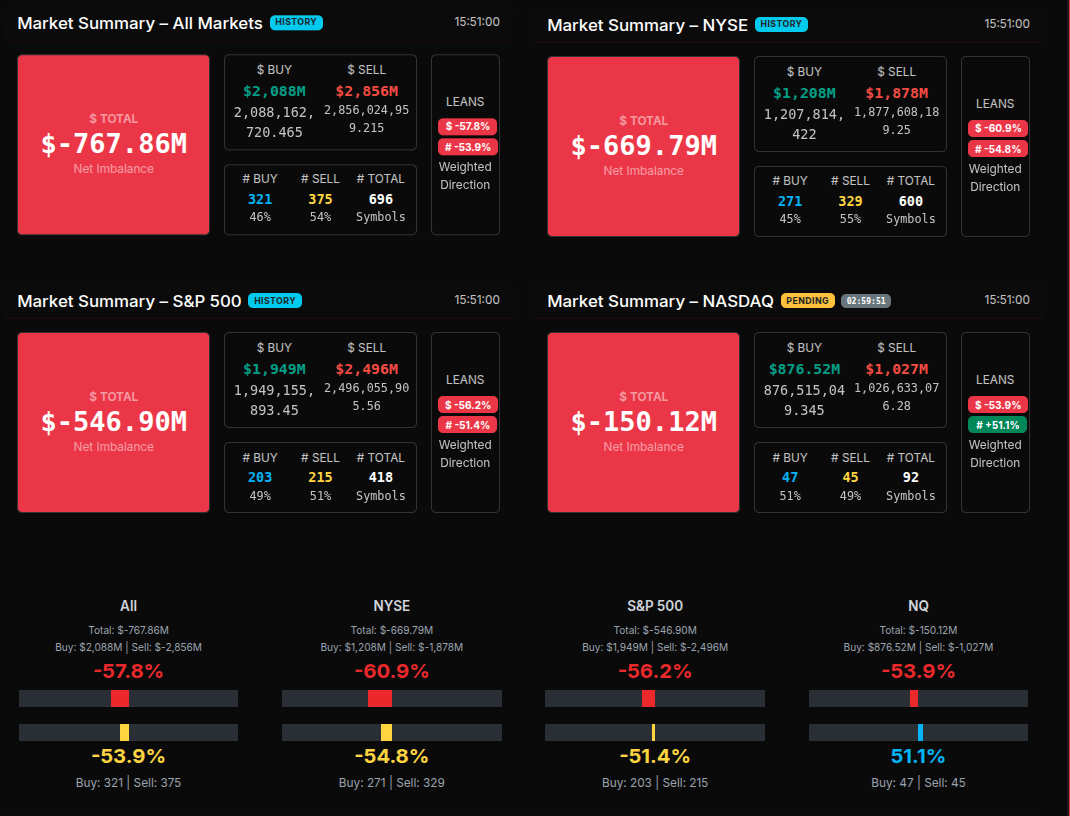
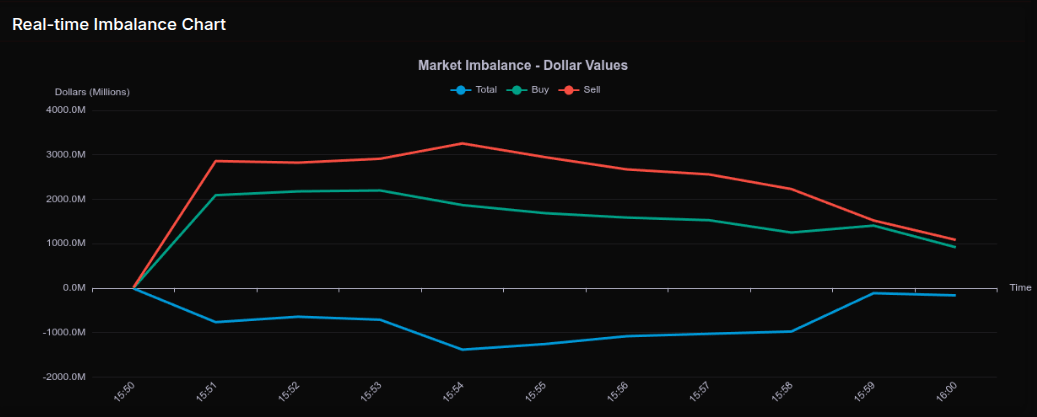
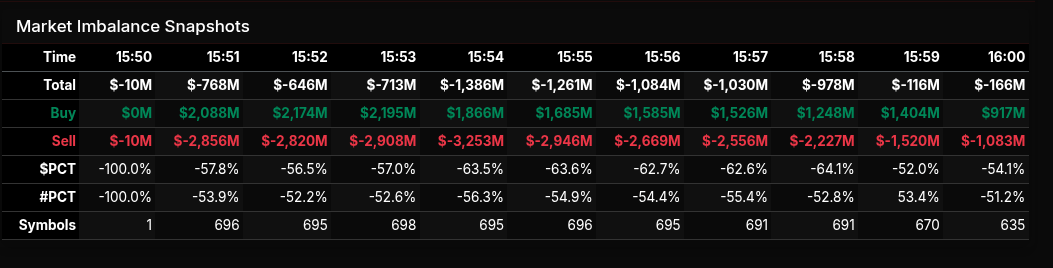
The MOC opened leaning heavily to the sell side and stayed that way into the bell. At 15:50, the market started near flat with a small –$10M imbalance, but within a minute the sell programs hit sharply, driving the total to –$768M by 15:51. From there, the sell pressure held steady between –$646M and –$1.38B through 15:54, with buy flows unable to offset the consistent wave of offers. The peak selling hit at 15:54 with –$3.25B in sell interest paired against just $1.86B of buys, a –63.5% lean. Anything beyond –66% is considered wholesale selling; while the data hovered just above that, the direction was persistently one-way.
Across exchanges, NYSE was the weakest at –$669M (–60.9%), followed by the S&P 500 at –$547M (–56.2%). NASDAQ, however, showed the only rotational tilt: while the dollar total was –$150M, symbol count leaned positive at +51.1%, showing pockets of tech buying despite dollar selling.
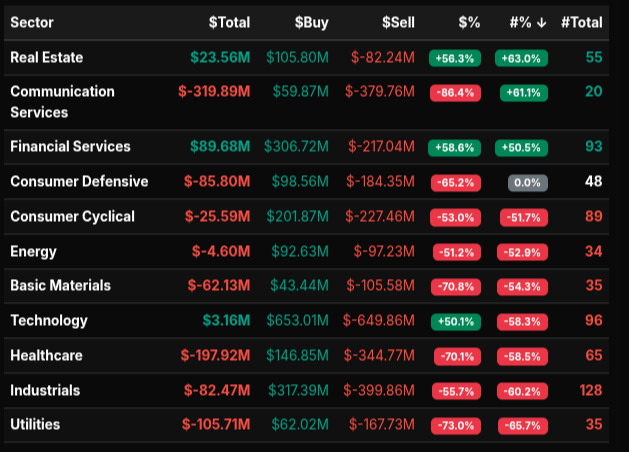
Sector flow confirmed broad liquidation. Communication Services (–86%) and Utilities (–73%) were the heaviest sells, followed by Healthcare (–70%) and Consumer Defensive (–65%). Technology was mixed: dollar imbalance was only –$3M, but the symbol % split showed net selling (–58%). Financials were the standout buyer, closing +$89.6M with a +58.6% lean.
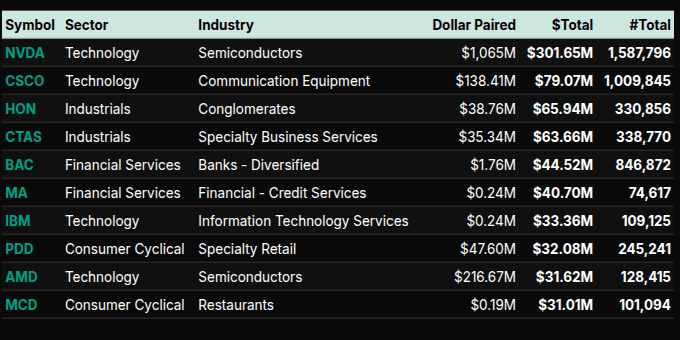
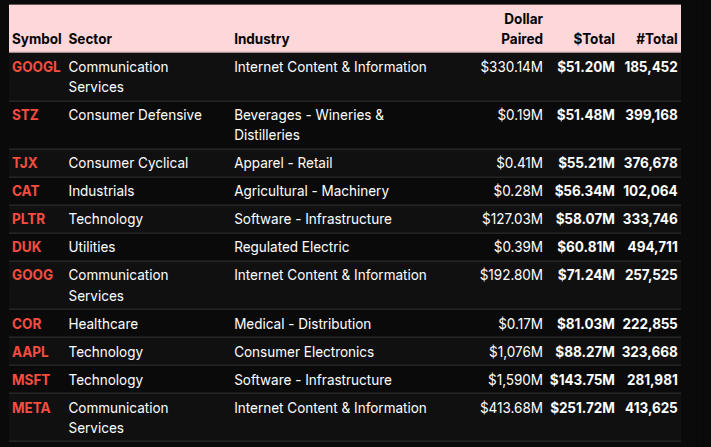
On the symbol level, the largest buy dollar flows went to NVDA ($301M), CSCO ($79M), HON, CTAS, and BAC—an interesting mix of semis and industrials. The biggest sells were dominated by large-cap tech and comms: META (–$251M), MSFT (–$143M), AAPL (–$88M), GOOGL/GOOG (–$122M combined), and PLTR (–$58M). This is consistent with ongoing institutional trimming in mega-cap tech.
Price action confirmed the fade. After holding 6,759–6,760 into 15:54, ES slipped steadily into the 15:57–15:59 window, printing 6,752.75 → 6,751.25 → 6,754.25 before a small uptick, but broadly tracking the negative flow. The tape followed the imbalances: sell-side into the close, no meaningful reversal.
Technical Edge
Fair Values for November 17, 2025:
-
SP: 19.07
-
NQ: 81.11
-
Dow: 67.5
Daily Breadth Data 📊
For Friday, November 14, 2025
• NYSE Breadth: 38% Upside Volume
• Nasdaq Breadth: 54% Upside Volume
• Total Breadth: 53% Upside Volume
• NYSE Advance/Decline: 44% Advance
• Nasdaq Advance/Decline: 43% Advance
• Total Advance/Decline: 43% Advance
• NYSE New Highs/New Lows: 43 / 122
• Nasdaq New Highs/New Lows: 73 / 359
• NYSE TRIN: 1.34
• Nasdaq TRIN: 0.62
Weekly Breadth Data 📈
For Week Ending November 14, 2025
• NYSE Breadth: 48% Upside Volume
• Nasdaq Breadth: 49% Upside Volume
• Total Breadth: 49% Upside Volume
• NYSE Advance/Decline: 45% Advance
• Nasdaq Advance/Decline: 41% Advance
• Total Advance/Decline: 43% Advance
• NYSE New Highs/New Lows: 286 / 170
• Nasdaq New Highs/New Lows: 401 / 522
• NYSE TRIN: 0.85
• Nasdaq TRIN: 0.71
Today’s BTS Levels:
ES Z
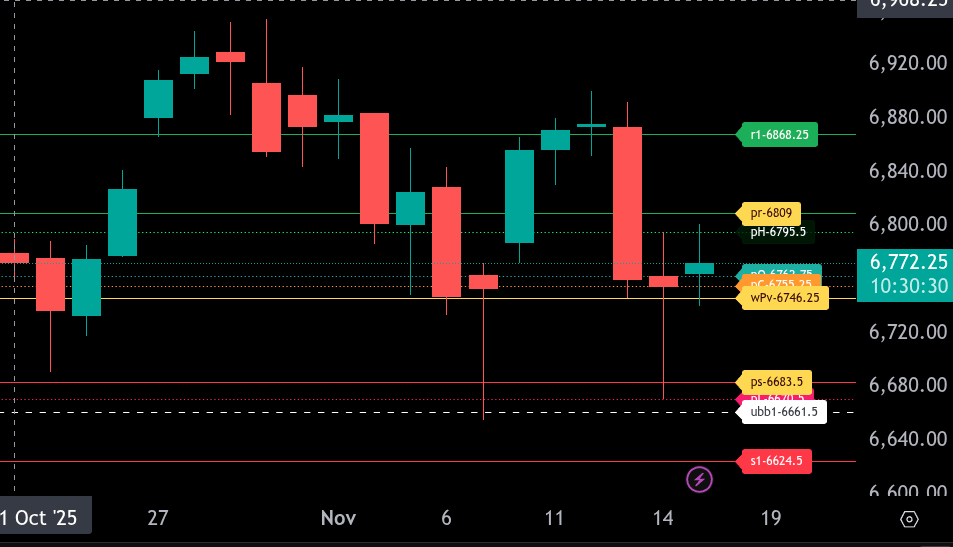
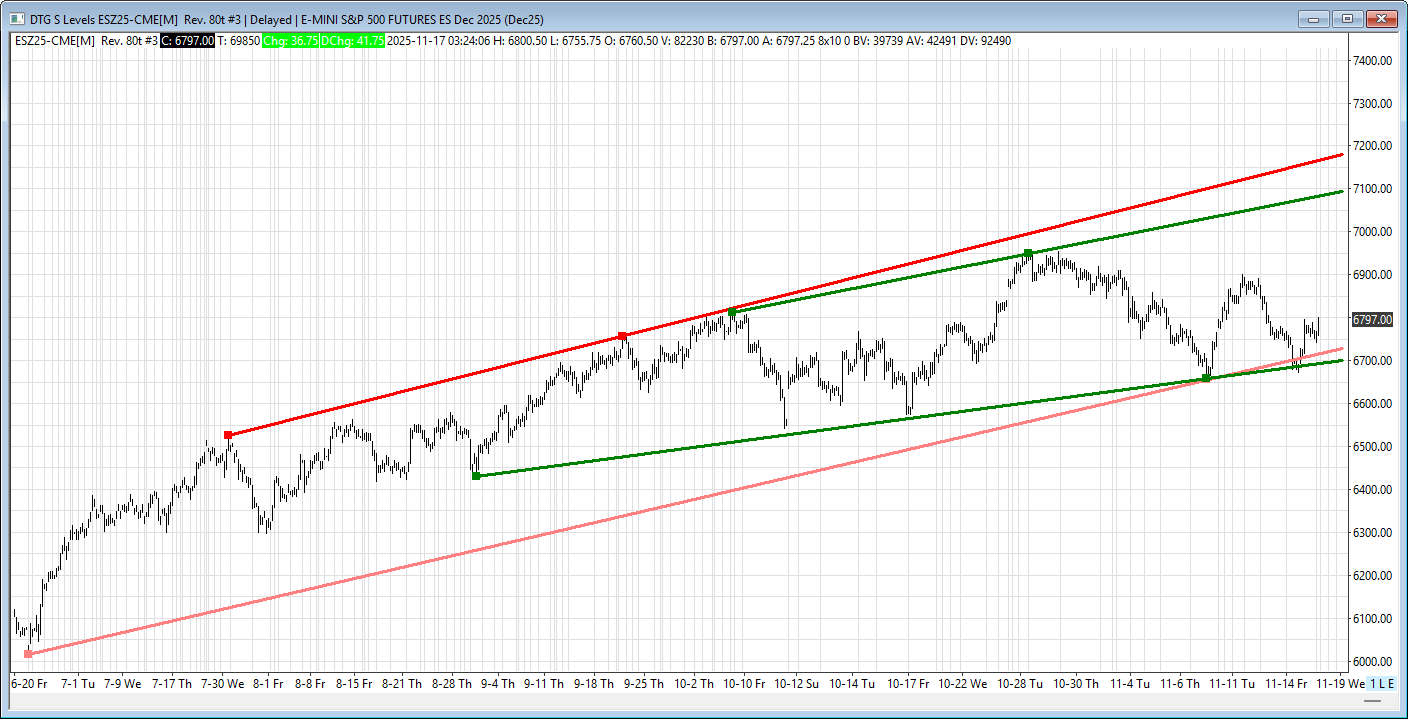
The bull/bear line for the ES is at 6746.25. With price trading near 6773.50, the market is holding above this pivot and leans bullish intraday.
Above, the first upside objective is 6809, our upper target range. A sustained move through that level opens a path toward 6868.25.
If ES pulls back, initial support sits at 6762.75. Below that, 6755.25 and the bull/bear line at 6746.25 are the key downside levels to watch. Losing 6746.25 exposes the lower range target at 6683.50.
Overall, holding above 6746.25 keeps the market geared toward testing 6809. A drop back below shifts focus to 6683.50.
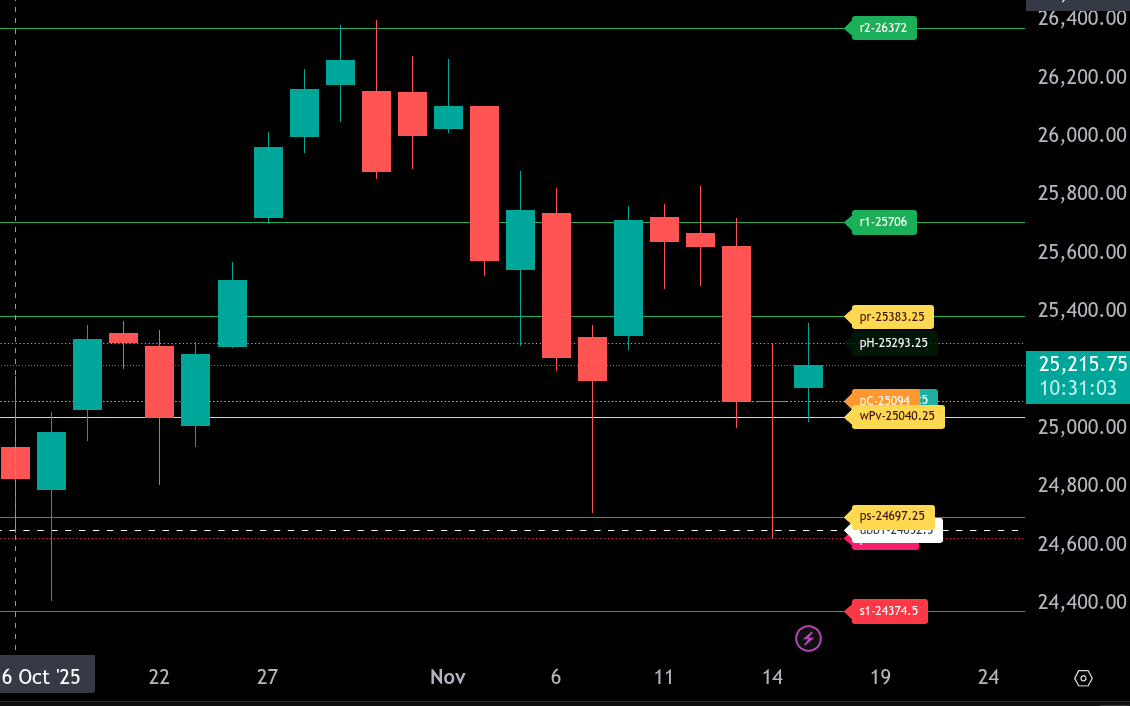
The bull/bear line for the NQ is at 25040.25. Trading below this level keeps the tone bearish, and the market will need to reclaim and hold above it to shift back toward a bullish stance.
Current price is around 25213.50, showing an attempt to firm up above the bull/bear line. If buyers can defend this area, the next upside objective is the upper range target at 25383.25. Above that, resistance sits at 25706.
If sellers take control and push price back below 25040.25, the downside opens quickly. First support is 25094.50, followed by the lower range target at 24697.25. A break under that exposes 24374.50.
Overall, holding above 25040.25 favors a push toward 25383.25, while losing that level brings 24697.25 back into focus.
NQ Z
The bull/bear line for the NQ is at 25040.25. Trading below this level keeps the tone bearish, and the market will need to reclaim and hold above it to shift back toward a bullish stance.
Current price is around 25213.50, showing an attempt to firm up above the bull/bear line. If buyers can defend this area, the next upside objective is the upper range target at 25383.25. Above that, resistance sits at 25706.
If sellers take control and push price back below 25040.25, the downside opens quickly. First support is 25094.50, followed by the lower range target at 24697.25. A break under that exposes 24374.50.
Overall, holding above 25040.25 favors a push toward 25383.25, while losing that level brings 24697.25 back into focus.
Calendars
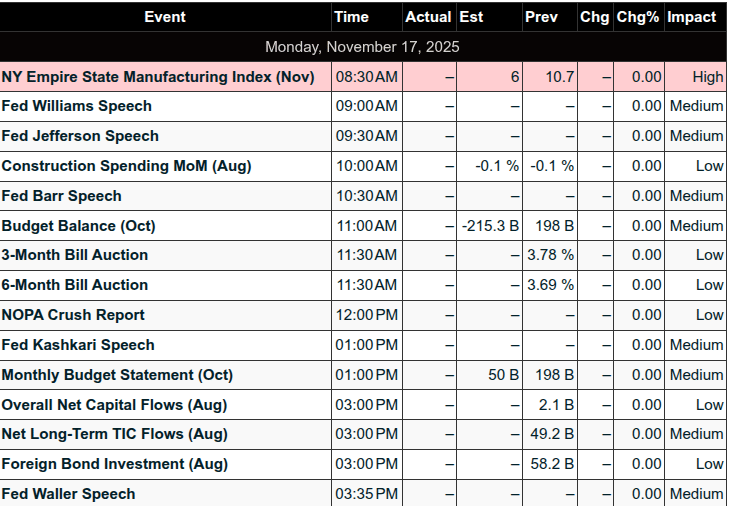
Today’s Economic Calendar
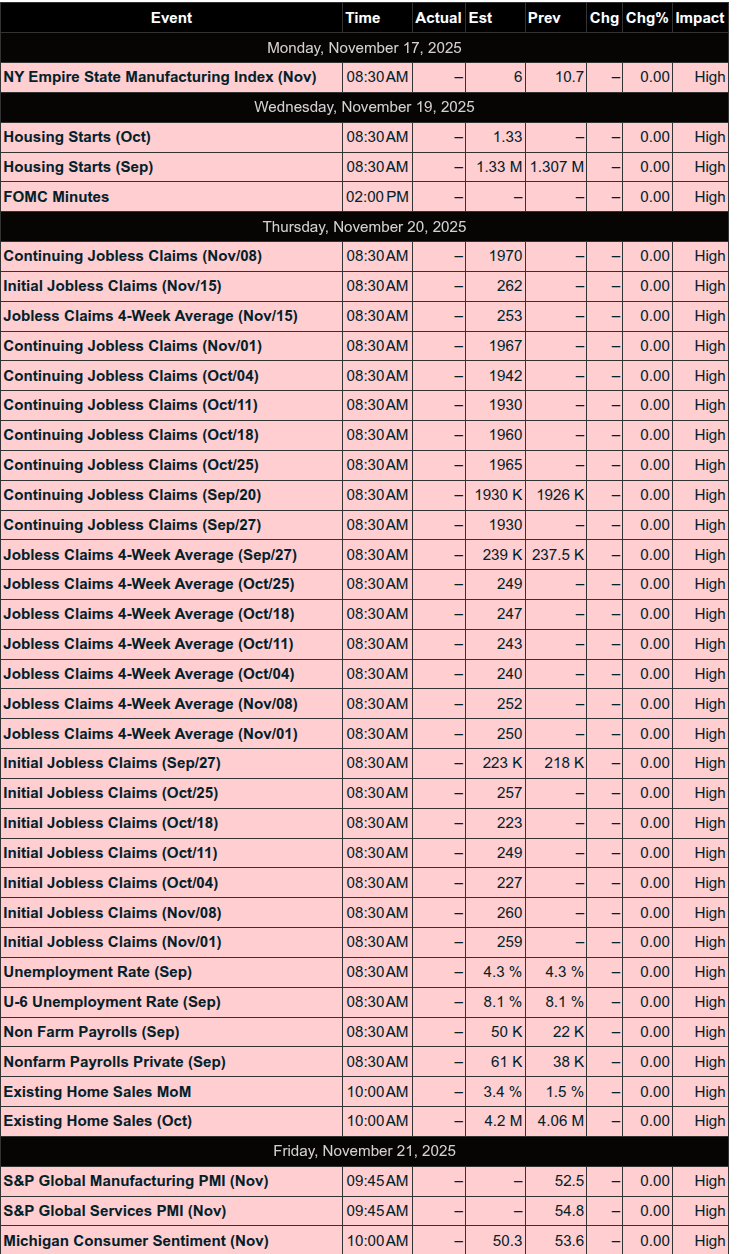
This Week’s Important Economic Events
Upcoming Earnings
Recent Earnings
Room Summaries:
Polaris Trading Group Summary – Friday, November 14, 2025
The session opened under a “Risk-Off” tone, with traders cautious after volatile prior days. The day developed into a strong upside move, culminating in a classic Friday short squeeze, with key technical levels reclaimed and targets hit.
Key Trades & Highlights:
-
Early Action:
-
Manny opened a Resistance Sell from 6750, caught a +60 tick gain — a standout trade to start the session.
-
Attempts at LB&F setups (e.g., around 6691) didn’t gain traction early, with TL support failing and no follow-through from buyers.
-
-
Support Buy Opportunities:
-
The 6670–6674 zone was highlighted by both Manny and Bosier. Though Manny didn’t take the long, John B caught the move and called it his best trade of the week.
-
Manny later treated the 6700 area as a Continuation Long, entering near VWAP (6720.75) — a textbook entry with strong continuation.
-
-
Midday Squeeze:
-
David guided the room through reclaiming key levels:
-
6746 reclaimed.
-
6762.50 (prior close) became the next target.
-
Final push hit pivot goal at 6786.25, fulfilling the D-Level Money Box setup and confirming the Friday Squeeze.
-
-
David declared this leg the “EZ Trade”, signaling the end of the high-conviction move and transition to lower probability “grind” trading.
-
End of Day:
-
The market faded late with a $630M MOC sell imbalance, pulling price back to session VWAP and neutralizing the day into the close.
Lessons & Takeaways:
-
Follow the Tape: Early shorts were solid, but tape quickly turned, and reclaiming VWAP + key TLs signaled trend change — flexibility paid off.
-
Trust the Zones: Support buys near 6670 and continuation through 6700 were highly effective — respecting plan structure delivered clean opportunities.
-
Patience Wins: Manny emphasized cadence and timing — knowing when not to trade was as important as entries.
Result:
A Fantastic Fryday — with several clean trades, key levels respected, and a strong rally that rewarded discipline and plan adherence.
DTG Room Preview – Monday, November 17, 2025
-
Morning Market Summary:
-
Macro & Fed:
-
Strong corporate earnings support markets amid high volatility.
-
AI sector faces profit-taking as portfolios rebalance.
-
Delayed economic data clouds Fed rate path; no further 2025 cuts priced in.
-
-
Jobs & Economic Data:
-
September jobs report due Thursday — delayed but key.
-
Empire State Manufacturing Index expected today; Construction Spending may drop at 10:00 AM if released.
-
-
Earnings:
-
92% of S&P 500 reported; 82% beat EPS; blended Q3 growth at 13.1%.
-
76% beat revenue expectations; 9 of 11 sectors posted YoY growth.
-
Nvidia (NVDA) reports Wednesday post-close; other key names: HD, WMT, TGT, LOW, GAP.
-
Premarket: ARMK, YMM, HTHT, XPEV. Post-close: ACM, TCOM. Tuesday AM: BHP, MDT, PDD, HD.
-
-
Crypto:
-
Bitcoin down 30% over a month, erasing gains tied to earlier crypto-friendly sentiment.
-
-
Tesla/China:
-
TSLA moving away from China-made parts amid tariff risks; full transition in 1–2 years.
-
-
Technical Levels – ES (E-mini S&P):
-
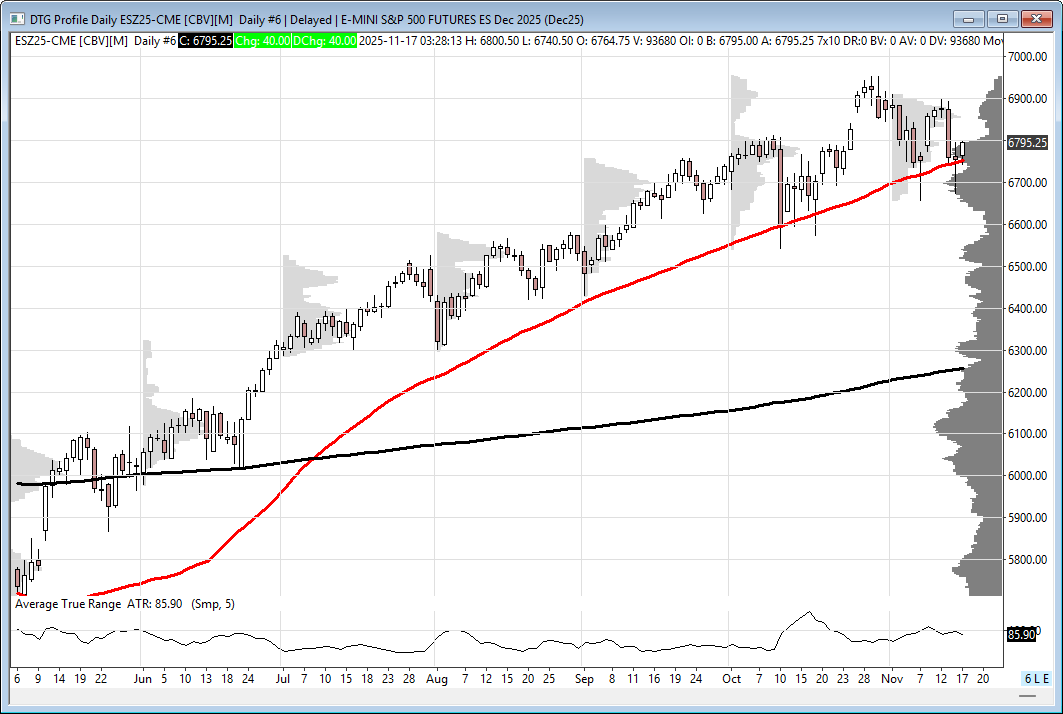
Friday’s bounce held at short-term uptrend support (6695/98) and 50-day MA (6748.25).
-
Resistance: 7094/99, 7180/85.
-
Support: 6695/98.
-
5-day avg daily range: 96.25 points — moderately high.
-
Light overnight volume shows bullish lean but no whale bias.
-
-
Affiliate Disclosure: This newsletter may contain affiliate links, which means we may earn a commission if you click through and make a purchase. This comes at no additional cost to you and helps us continue providing valuable content. We only recommend products or services we genuinely believe in. Thank you for your support!
Disclaimer: Charts and analysis are for discussion and education purposes only. I am not a financial advisor, do not give financial advice and am not recommending the buying or selling of any security.
Remember: Not all setups will trigger. Not all setups will be profitable. Not all setups should be taken. These are simply the setups that I have put together for years on my own and what I watch as part of my own “game plan” coming into each day. Good luck!
This post goes out as an email to our subscribers every day and is posted for free here around 2 PM ET. To get your real-time copy, sign up for the free or premium version here: Opening Print Subscribe.
Comments are closed