This post goes out as an email to our subscribers every day and is posted for free here around 2 PM ET. To get your real-time copy, sign up for the free or premium version here: Opening Print Subscribe.
S&P Reversal – Largest Since April 8
Follow @MrTopStep on Twitter and please share if you find our work valuable!
Our View
The reversal was by no means a positive sign for the ES and NQ. As I said in yesterday’s OP, I thought the ES could move higher, but didn’t think the decline was over.
Our Lean
After a big sell-off like that, the ES usually bounces on Globex — but if it does, I’m not sure it will hold. 6,480 is a key level, and a close below there projects lower prices.
On the other side of the trading card, today is Week 3 options expiration, and I can’t rule out a late-day bounce.

We’ve never offered a deal like this before, and it includes all our tools, including the Imbalance Meter.
Guest Posts:

Get instant access to our partners’ real-time market data and insights not available anywhere else. Here is last night’s Founder’s note getting you ready for today’s market and explaining the constraints in yesterday’s market. – MrTopStep
Founder’s Note:
Founder’s Note:
Futures are 50bps lower ahead of 9:30AM ET SPX AM expiration, with all other options expiring at 4PM ET.
TLDR: Very tricky market here, our one clear warning here is to mind risk over this weekend as these types of weekends can carry a lot of tail risk. 6,500 is interim support, with 6,350 remaining as the “wash out” level to the downside. Conversely with clear upside into the 6,700 level.
We, like many traders, were leaning long out of NVDA ER & Jobs data, and that plan went violently south starting at 10:30AM ET yesterday. Our saving grace was the strong risk off signal if SPX went <6,700, as <6,700 opened a portal of negative gamma and higher volatility (see last nights note on the huge size). This morning we still exist in this negative gamma realm, which is only to be compounded by today’s OPEX. You see this in TRACE wherein the SPX map gets more red after 9:30AM, which is when the largest trachne of SPX options roll off. There is another set expiring at 4PM, which includes the fairly large 0DTE positive gamma strikes at 6,500 & 6,475.
On this positive gamma point, its clear there are some 0DTE traders taking a stand in the 6,400’s, but sub <6,400 its more negative gamma. 6,350 remains a big downside zone to watch a “full flush” level.
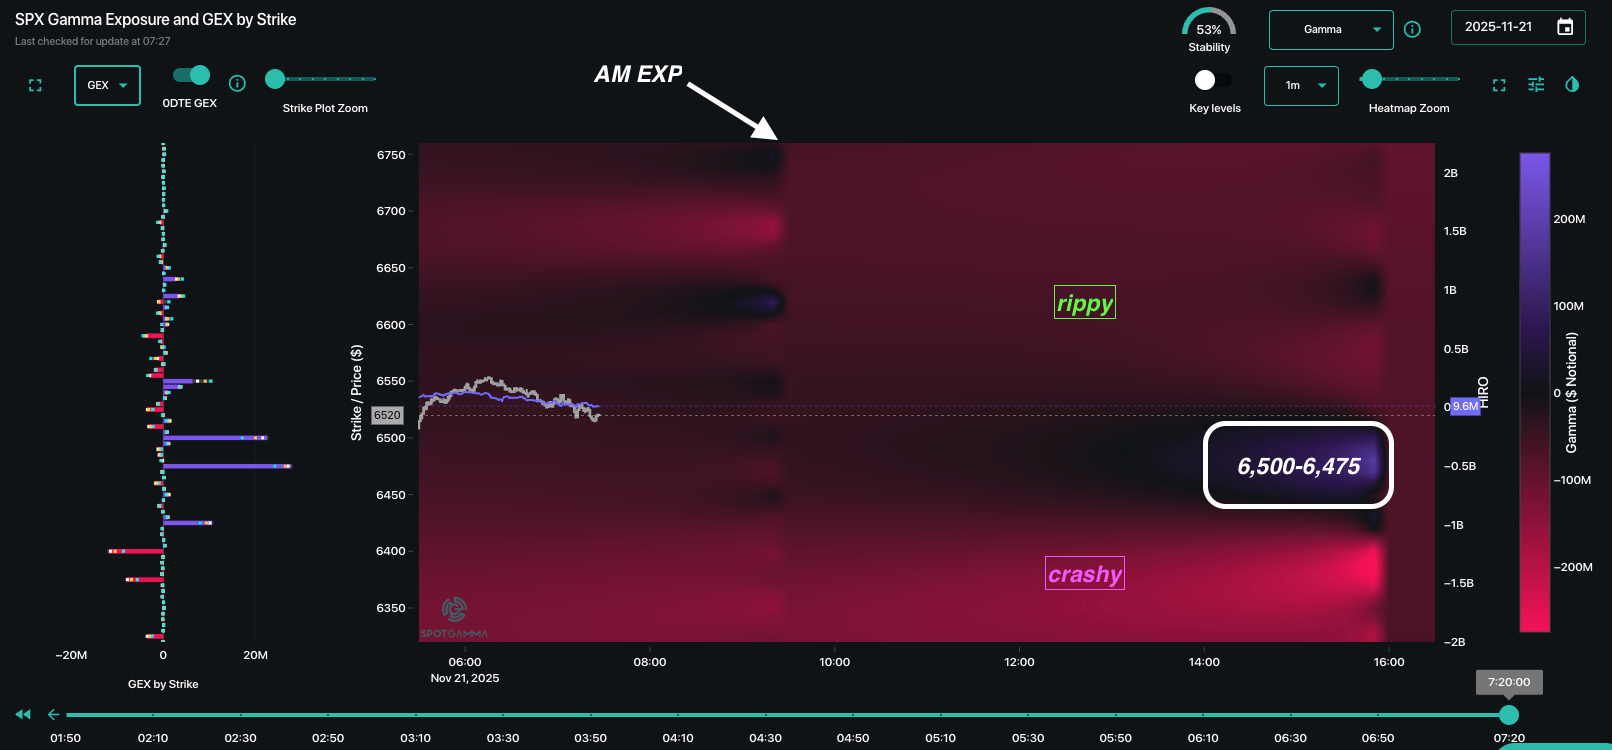
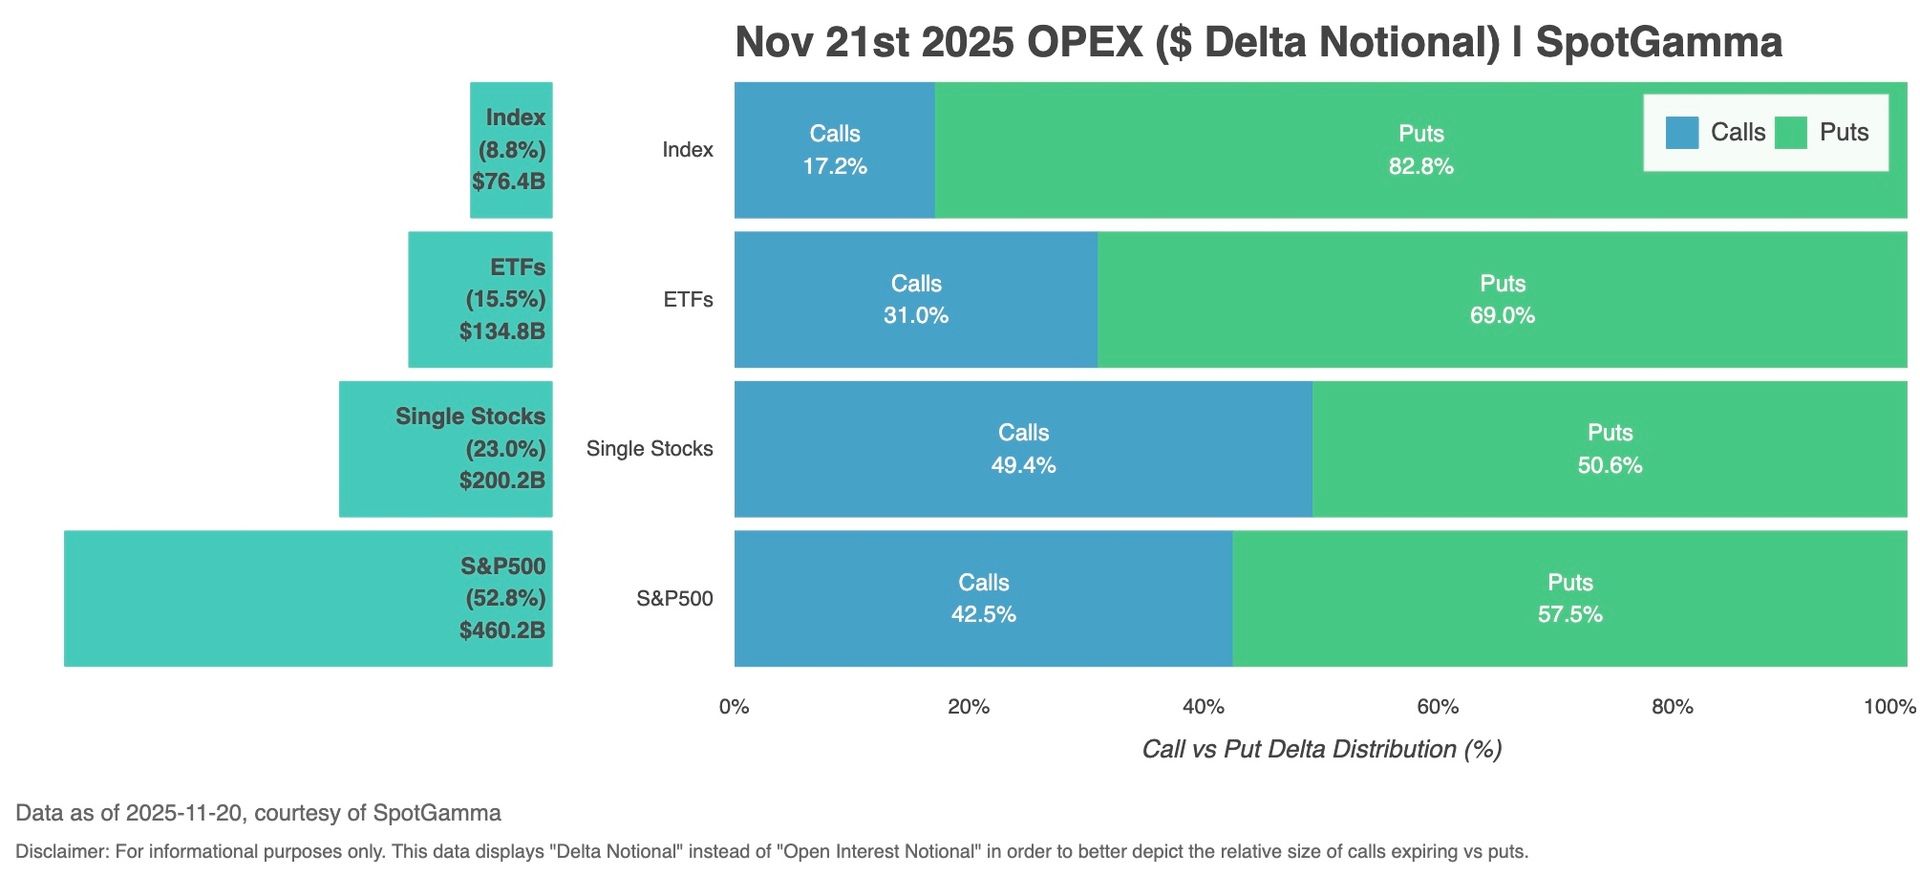
Volatility and negative gamma “work both ways”, and so we have to be weary of a very fast move back into the 6,600’s as OPEX will clear a bunch of puts, and we are about to head into a weekend. Consider our OPEX plot below which has some very bearish delta put/call ratios expiring in Index & ETF’s (these values were closer 50/50), with SPX being more 60/40 calls to puts. This is not a giant quarterly OPEX, but its enough to matter, particularly in the absence of another catalyst + big negative gamma & high VIX/IV’s.
The tricky part here is that there is no one clear catalyst for this selling (we’ve heard up to 10 different reasons), and these types of weekends carry a lot of risk in that respect. Carry/crypto/credit/margin issues love to flare up on a Sunday night, making carrying short vol over the weekend a bit perilous.
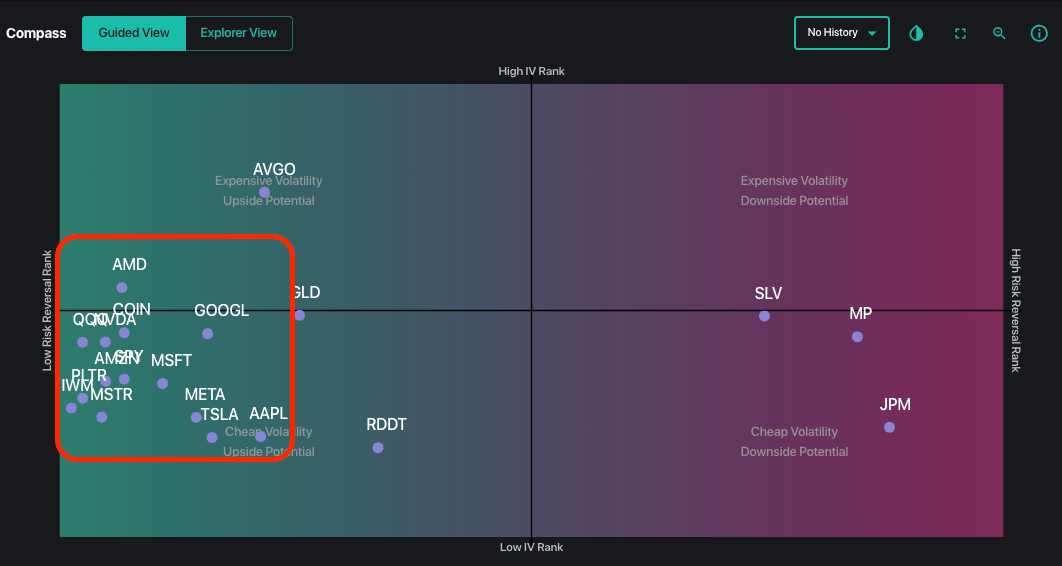
Here is the other problem for downside: puts are expensive as you can see by the clustering of stocks on the left of Compass (puts rich vs calls + IV Ranks near 50). Okay, its not April ’24 kind of expensive, but its the kind of expensive that really hurts if the market just stops going lower – particularly into a weekend backed by a holiday.
What’s the trade?
We like SPY/QQQ call 1×2 or broken wing call flies for early December, which can be structured for near even money. The idea here is that we have fixed risk downside, but if there is a stock pop due to weekend decay + OPEX, those higher stock prices should be met with a big vol crush. For this we want to be long the SPY 666 & QQQ 600 area, and we are okay have some short exposure in the SPY >675 and QQQ >610.
Flavors of short puts are more of a clear play here, but we strongly warn against naked put structures at this juncture. Weekend risks considered, broken wing flies in top tech names in Dec OPEX are some decent targets.

©2025 TenTen Capital LLC DBA SpotGamma
Get instant access to our partners real-time market data and insights not available anywhere else. Here is last night Founder’s note getting you ready for today’s market and explaining the constraints in yesterday’s market. – MrTopStep
Market Recap
Thursday’s trade delivered one of the most violent intraday reversals of the year: a classic “buy the rumor, sell the news” trap centered on Nvidia’s earnings, compounded by a barrage of hawkish Fed commentary. What began as a +1.9% morning ramp quickly unraveled into a −1.56% rout.
Key Stats
-
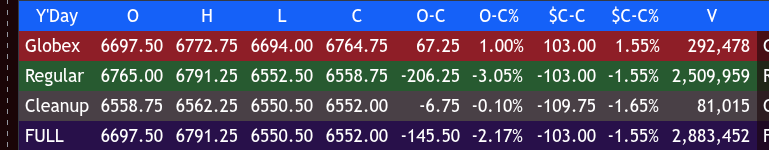
Open: ~6,765.00
-
High: 6,801.50
-
Low: 6,568.75
-
True Range: 232.75 points (top-percentile volatility day)
-
Cash S&P 500 Close: 6,538.76 (−103.75 pts / −1.56%)
-
Volume: ~1.83M contracts (elevated)
Closing Auction Detail
Into the close, the 3:50 PM EST MOC imbalance flashed $3.2 billion to buy, which triggered a late-session short-covering bounce off the 6,568.75 low. That imbalance was fully absorbed as ES printed 6,553.75 at 3:50 PM, then continued higher into the cash close, printing 6,558.75 at exactly 4:00 PM EST.
The $3.2B buy imbalance provided the mechanical fuel for a weak final dead-cat bounce, but it wasn’t nearly enough to reverse the day’s strong bearish momentum.
What Drove the Move
-
Morning euphoria: NVDA beat + raised → triggered a gap-and-go above 6,800
-
Afternoon avalanche (~1:00 PM EST):
-
Cleveland Fed’s Beth Hammack explicitly warned against further rate cuts
-
Goolsbee and Lisa Cook echoed the hawkish tone
-
December cut odds collapsed
-
Yields spiked, the dollar surged
-
-
Delayed September jobs data (+119k, unemployment 4.4%) removed any remaining “bad news = good news” tailwind
-
Momentum unwind hit hardest in AI/tech, crypto, and high-beta names (Nasdaq −2.38%, the worst-performing sector)
In the end, the day printed a massive outside bearish engulfing candle on both daily and intraday timeframes, closing on the absolute lows, despite the late $3.2B imbalance to buy. The short-term tape is damaged. Bulls must reclaim and hold 6,620–6,650 quickly, or the 6,500–6,520 zone is likely next in line.
One of the cleanest trap/reversal days of 2025. In terms of overall tone, NQ led both the rally and the reversal. In terms of overall ES trade, volume was ~1.83M contracts traded.
MiM
Market-On-Close Recap
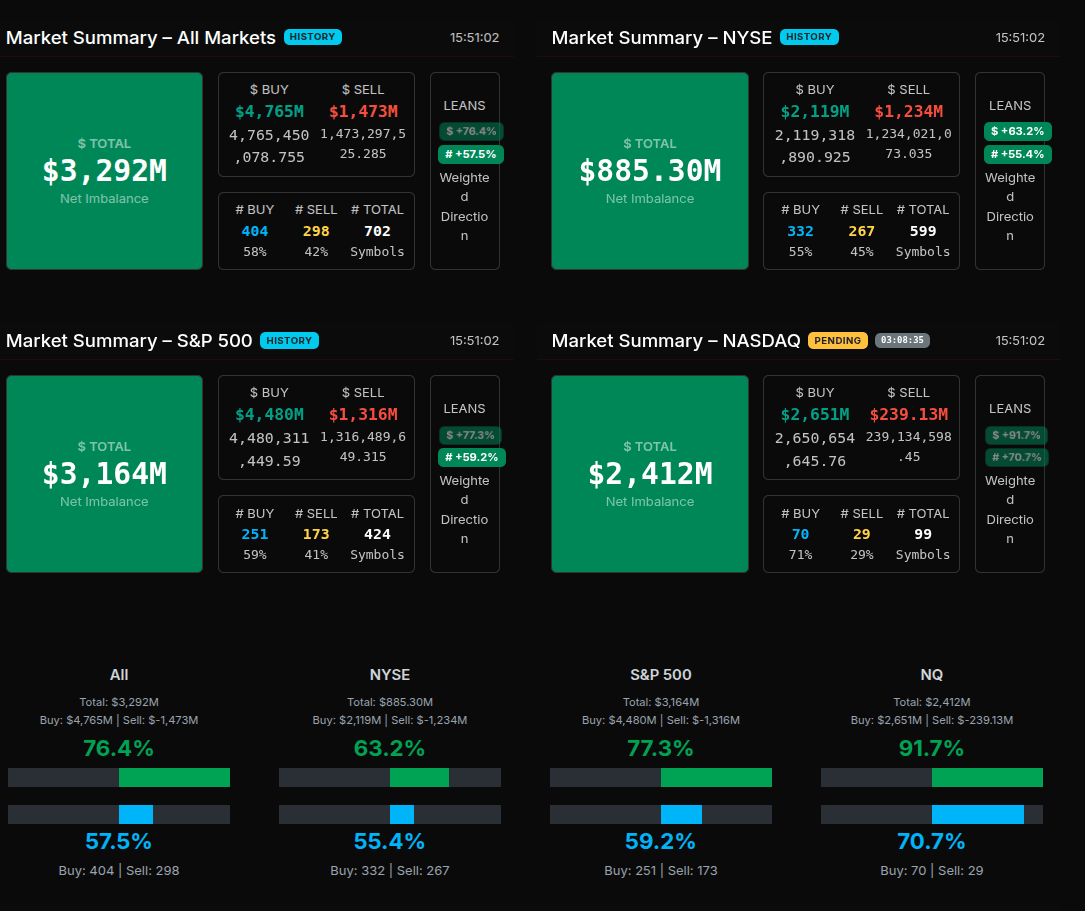
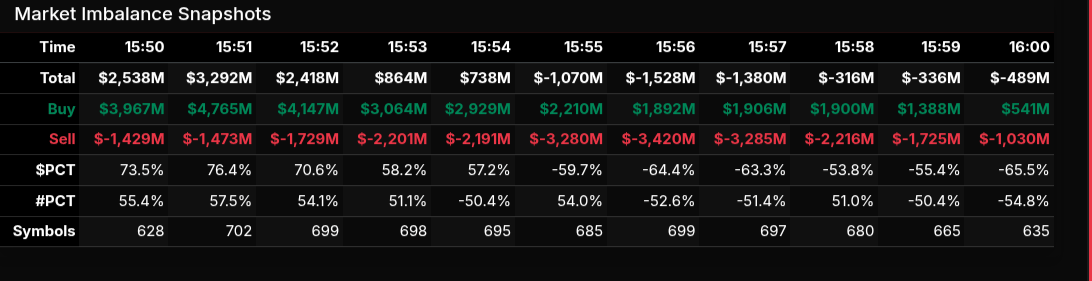
Thursday’s Market-on-Close flow opened with strong buy interest but quickly transitioned into one of the sharpest late-day reversals of the week. At 15:50, the market showed a healthy +$2.54B buy imbalance, led by nearly $4B in buy interest across all markets. By 15:52, the imbalance peaked near +$3.29B, with buy programs controlling roughly 76% of dollar flow and 55% of symbols.
The tone shifted after 15:53. Buy interest steadily faded while sell programs accelerated. By 15:55, the tape flipped to a -$1.07B sell imbalance, then deepened to -$1.53B at 15:56, and held heavy into the bell. The final print at 16:00 settled near -$489M, confirming a meaningful transition from early-session accumulation to broad-based liquidation.
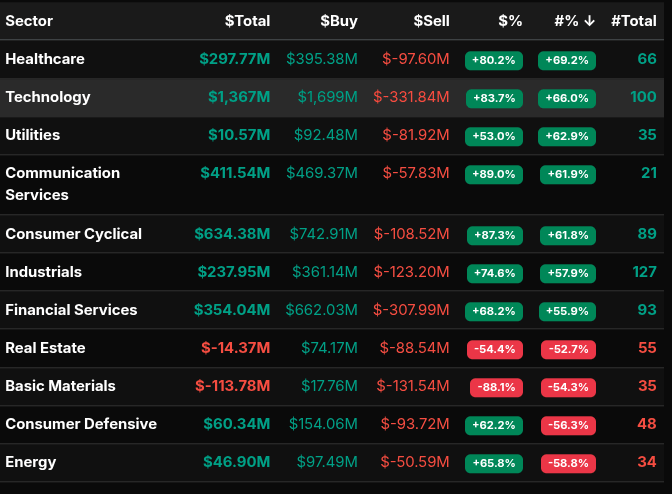
Sector flows highlighted the rotation. Technology was the largest buyer (+$1.37B) but also saw heavy paired volume from components like NVDA, MSFT, AAPL, and AVGO—evidence of two-way repositioning rather than a clean risk-on chase. Healthcare saw strong net buys (+$298M), while Communication Services posted a solid +$412M. Meanwhile, traditional cyclicals and defensives were net sold: Real Estate (-$14M), Basic Materials (-$113M), and Consumer Defensive (+$60M but with negative breadth). Energy posted a modest +$47M.
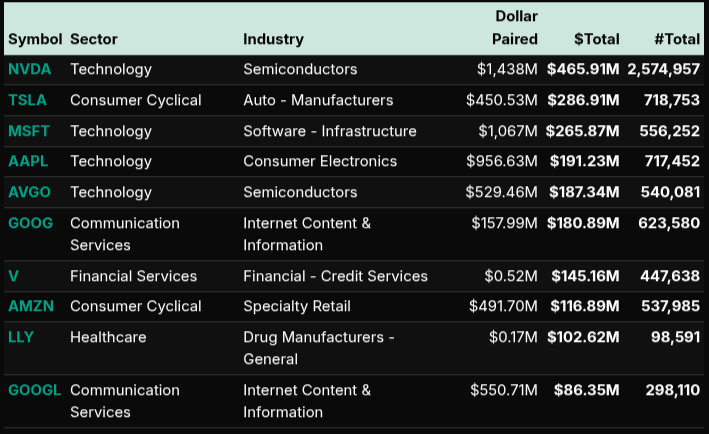
The symbol-level detail confirmed that semiconductors dominated paired volume: NVDA ($1.44B paired, +$465M net buy), AVGO ($529M paired, +$187M), QCOM ($323M paired, +$19.5M). Tesla saw +$286M net buy despite broader weakness in consumer cyclicals, suggesting targeted repositioning. On the sell side, ORCL printed the largest negative flow at -$221.9M.
Nasdaq showed the most extreme lean, with a 91.7% buy-side bias early in the window, but midway through the auction cycle turned decidedly bearish and was the largest source of the negative broad-based numbers.
Price action mirrored the MOC turn. ES held steady through 15:51–15:53, then slipped progressively into 15:56–15:58 before stabilizing near 6,560 into the close.
Overall, the session opened with strong wholesale buying (>66% leans across indices) but ended in a clear late-day unwind as sellers took control into the bell.
On the MIM:


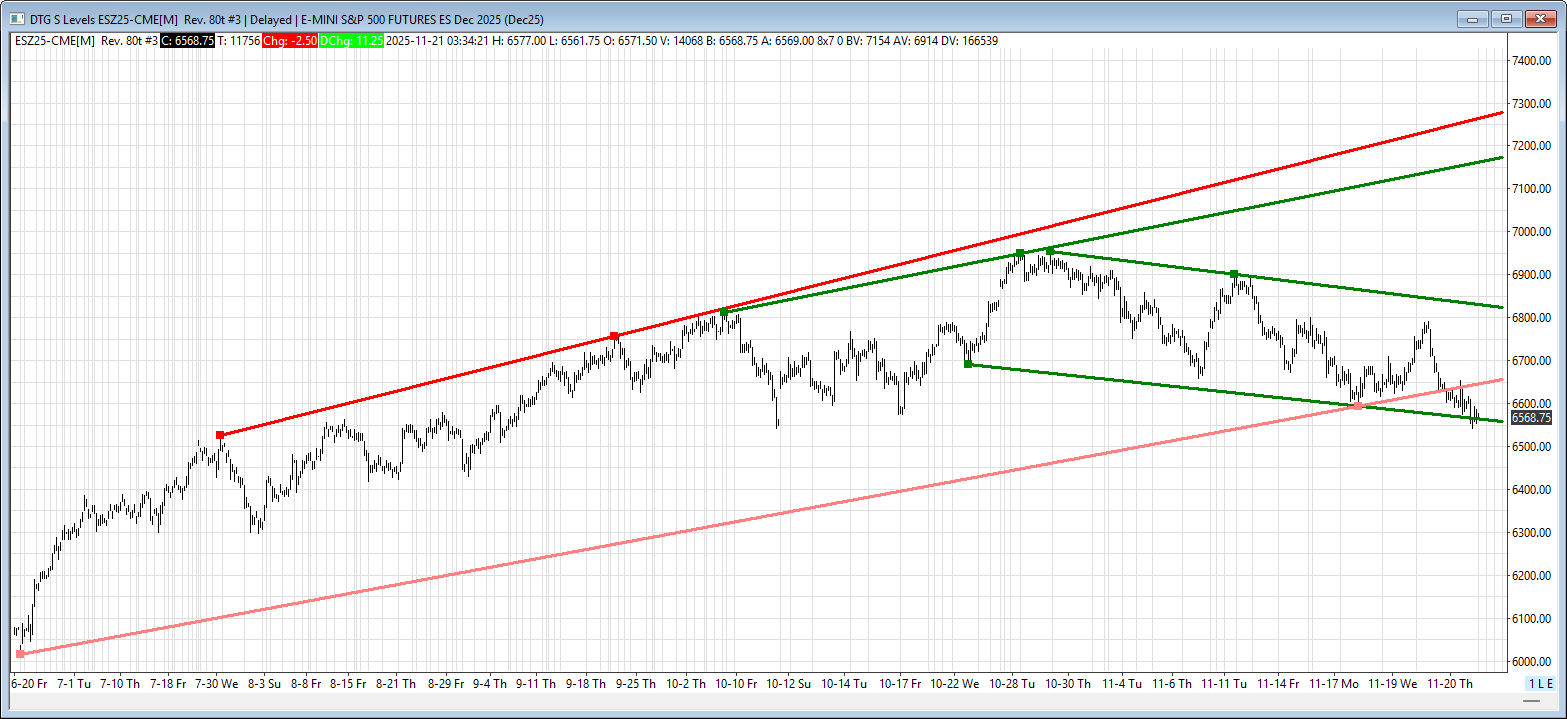
ES Levels

The bull/bear line for the ES is at 6602.75. Price is trading below this level, keeping the tone weak in the Globex session.
The upper intraday range target is 6703.75. A move back above 6602.75 and sustained strength through 6697.75 opens the door to testing this upper target.
The lower intraday range target is 6501.75. Continuation selling below 6557.5 and 6550.5 increases the probability of reaching this level.
Resistance levels sit overhead at 6674.5, 6697.75, and 6799. These levels cap upside until the bull/bear line is reclaimed.
Support levels are found at 6557.5, 6550.5, and then 6406.75. A break of 6550.5 invites a push toward the lower target at 6501.75.
Overall, the trend remains bearish while price stays below 6602.75, with sellers pressing toward 6501.75 unless buyers can regain control above the bull/bear line.
NQ Levels

The bull/bear line for the NQ is at 24,355.50. Trading below this level keeps the tone bearish unless reclaimed.
NQ is currently near 24,113.25. Staying under the bull/bear line favors downside continuation. The lower range target sits at 23,846.75, which becomes the next key objective if selling pressures persist.
On the upside, resistance is found at 24,131.50 and then 24,355.50. A break and hold back above the bull/bear line opens the door for a move toward the upper range target at 24,864.25.
Additional support sits at 24,073.25 and then 23,846.75. Resistance above includes 24,696.75 and 24,864.25.
Bias remains bearish while below 24,355.50. Reclaiming that level flips the tone and invites a push toward the higher resistance levels.
Technical Edge
Fair Values for November 21, 2025
-
SP: 17.67
-
NQ: 74.05
-
Dow: 73.66
Daily Breadth Data 📊
For Thursday, November 20, 2025
-
• NYSE Breadth: 18% Upside Volume
• Nasdaq Breadth: 28% Upside Volume
• Total Breadth: 27% Upside Volume
• NYSE Advance/Decline: 23% Advance
• Nasdaq Advance/Decline: 26% Advance
• Total Advance/Decline: 25% Advance
• NYSE New Highs/New Lows: 44 / 160
• Nasdaq New Highs/New Lows: 110 / 467
• NYSE TRIN: 1.44
• Nasdaq TRIN: 0.87
Weekly Breadth Data 📈
Week Ending Friday, November 14, 2025
-
• NYSE Breadth: 48% Upside Volume
• Nasdaq Breadth: 49% Upside Volume
• Total Breadth: 49% Upside Volume
• NYSE Advance/Decline: 45% Advance
• Nasdaq Advance/Decline: 41% Advance
• Total Advance/Decline: 43% Advance
• NYSE New Highs/New Lows: 286 / 170
• Nasdaq New Highs/New Lows: 401 / 522
• NYSE TRIN: 0.85
• Nasdaq TRIN: 0.71
Calendars
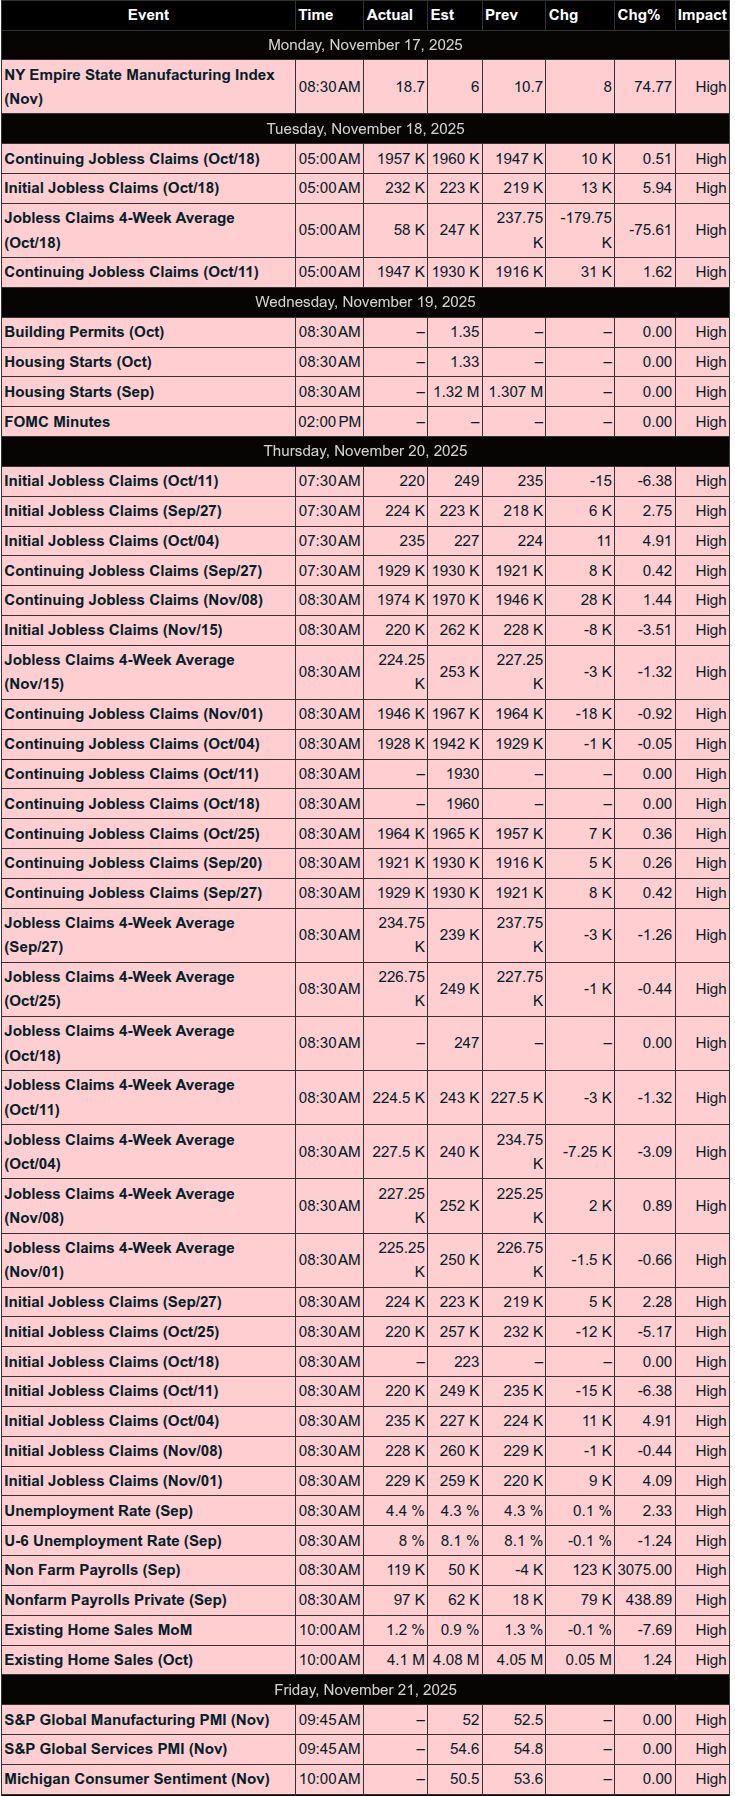
Economic Calendar Today

This Week’s High Importance
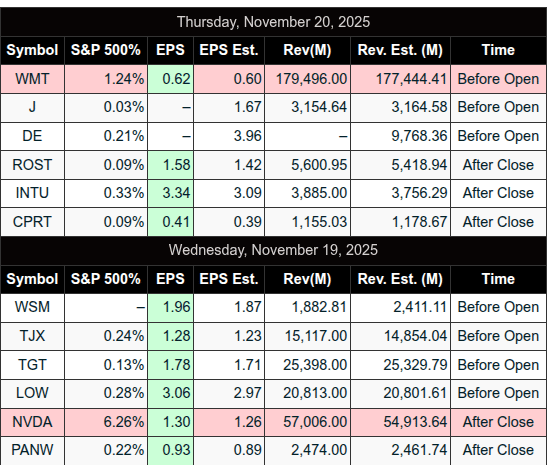
Earnings:

Trading Room News:
Polaris Trading Group Summary – Thursday, November 20, 2025
Yesterday was a high-volatility, high-drama session driven by a sharp reversal and full round-trip move—culminating in a nearly 250-handle trading range on the ES. Early long setups provided solid gains, but Fed Governor Lisa Cook’s midday comments sent the market into a liquidation spiral, triggering a fast and violent sell-off that took price from statistical highs to lows. It was a day of extreme movement, emotional discipline, and key lessons in planning, execution, and risk management.
Positive Trades & Executions:
-
Continuation Long #3 (6737–6741 ES):
Triggered shortly after NFP at 8:30 AM, leading to a strong rally up to the 6774 target zone outlined in the Daily Trade Strategy.-
Momentum was clearly in buyers’ hands early, marking a clean opportunity for those prepared with the plan.
-
Manny noted: “Great set up. Hope you guys caught some of it.”
-
-
Bosier Trade Management:
Despite taking an emotional stop earlier in the session, Bosier stuck to his plan, avoided larger losses, and caught a later push from 80 back to small green.-
A textbook example of honoring stops and preserving mental capital. David praised: “Bingo Bo… Stops preserve financial and most importantly mental capital.”
-
-
High-Volatility Awareness:
David cautioned not to “overstay your welcome” on setups, correctly noting that runners were unlikely due to range-bound price action before the breakdown.
Market Shift – The Fed Catalyst & Full Reversal:
-
Around 11:14 AM, comments from Fed Governor Lisa Cook warned of sharp market declines due to high asset valuations. Algo-driven reaction ensued, and the market tanked aggressively.
-
ES fulfilled a Cycle Day 1 Average Decline to 6718.84 and continued through key levels all the way down to yesterday’s low at 6613.25 — a full roundtrip.
-
David’s alerts came fast:
-
“Finally buyers got their fill… now the Bears turn…”
-
“Full Roundtrip down to yesterday’s Low 6613.25….holy snikers”
-
-
-
Manny shared premarket charts showing the risk of downside, later confirming: “I doubted the move and mentioned it offline.”
-
The room maintained solid situational awareness, highlighting lines in the sand (e.g., 6709, 6695) and tracking the unfolding liquidation.
Key Lessons & Mindset Takeaways:
-
Planning > Winging It:
Manny and David repeatedly emphasized the importance of a structured trade plan to handle volatile sessions:
“Draft a plan when things are quiet. Then execute win loss or draw… Tape is way too volatile to be winging it.” -
Boss Mode vs. Employee Mode:
David noted the mental shift required between planning trades (Boss) and executing trades (Employee). -
Honor Your Stops:
Reinforced through Bosier’s experience. Taking the stop minimized emotional damage and allowed reentry from a better mental state. -
Recognizing Volatility:
David described the session vividly:
“Rugby Games the market has been playing this week is nothing compared to today’s all-out Fight Club Fist Fight…”
Stats & Notables:
-
Range: Nearly 250 points — “just shy” according to Bruce.
-
Fed-Driven Drop: Catalyst from Lisa Cook’s remarks.
-
Fear & Greed Index: Dropped to 7 – Full PANIC Mode
-
MOC Flips:
-
Buy imbalance of $3.2B late in the day flipped to a $1B Sell imbalance, highlighting the instability into the close.
-
Closing Thoughts:
Thursday was not just about profits — it was a real-world stress test in emotional discipline, trade execution, and risk management. Those who respected their stops, stayed nimble, and followed their plans came out stronger.
Key Reminder from David:
“You can always get back in. Don’t overstay. Take the money and run!”
DTG Room Preview – Friday, November 21, 2025
-
U.S. Futures: Stabilizing after Thursday’s wild session; Nvidia’s earnings offered brief relief before strong jobs data reversed gains.
-
Weekly Performance:
-
S&P 600: ↓ 2%
-
Nasdaq: ↓ 3%+
-
-
Jobs Report:
-
September data (delayed by government shutdown) showed job growth and rising unemployment.
-
FedWatch: 33.1% chance of December rate cut.
-
WH economic advisor Kevin Hasset warns now is a “very bad time” to pause rate cuts.
-
-
Crypto:
-
Bitcoin dropped below $84,000, down 23% in November.
-
Worst monthly drop since the 2022 TerraUSD/FTX collapse.
-
-
Oil:
-
WTI Crude ↓ to ~$59/barrel.
-
Driven by tentative Ukraine peace talks and possible easing of Russian oil sanctions.
-
-
Earnings & Data Today:
-
Premarket: BJ’s Wholesale Club (BJ).
-
Economic:
-
Flash PMIs @ 9:45 AM ET
-
UoM Consumer Sentiment & Inflation Expectations @ 10:00 AM ET
-
-
-
Fed Speakers (ET):
-
John Williams (7:30 AM),
-
Michael Barr (8:30 AM),
-
Philip Jefferson (8:45 AM),
-
Lorie Logan (9:00 AM)
-
-
Volatility:
-
Thursday’s ES swing: 238 points
-
5-day average range: 144 points
-
-
Technical Levels (ES):
-
Resistance: 6647/52, 6824/19, 7173/78, 7285/90
-
Support: 6565/62; break below could target 6300s
-
ES broke below intermediate uptrend (now resistance); 50-day MA at 6750 rejected.
-
-
Flow: Whale bias leaning bullish, though overnight large trader volume was lighter than recent days.

Affiliate Disclosure: This newsletter may contain affiliate links, which means we may earn a commission if you click through and make a purchase. This comes at no additional cost to you and helps us continue providing valuable content. We only recommend products or services we genuinely believe in. Thank you for your support!
Disclaimer: Charts and analysis are for discussion and education purposes only. I am not a financial advisor, do not give financial advice and am not recommending the buying or selling of any security.
Remember: Not all setups will trigger. Not all setups will be profitable. Not all setups should be taken. These are simply the setups that I have put together for years on my own and what I watch as part of my own “game plan” coming into each day. Good luck!!
Follow @MrTopStep on Twitter and please share if you find our work valuable!
This post goes out as an email to our subscribers every day and is posted for free here around 2 PM ET. To get your real-time copy, sign up for the free or premium version here: Opening Print Subscribe.
Comments are closed