This post goes out as an email to our subscribers every day and is posted for free here around 2 PM ET. To get your real-time copy, sign up for the free or premium version here: Opening Print Subscribe.
Trump: Very Good Call With China’s Xi; Nasdaq Up 2.7%
Follow @MrTopStep on Twitter and please share if you find our work valuable!
Our View
I have always said if someone tells you they make money on every trade, they are lying. But unlike many people or companies that write newsletters, I actually made up a lot of the patterns I see—and Monday’s rally was definitely part of what I was talking about: how down Friday opens can lead to big rallies and how Mutual Fund Monday ties into the trade when you get long on Friday and hold into Monday, that and the ES had been up 10 of the last 11 Mondays.
I think the tip-off to the ES being up on Sunday night was when I posted on Twitter that Bitcoin was up—and so would be the ES and NQ. I’m going to make this simple: I have seen what’s happening so many times I can’t count. Everyone is short, going into the end of the month during a shortened holiday trading week. What would normally be a 5-session trade is reduced to 3⅓ days and the November month-end.
What happens at the end of the month?
The mutual funds marked up the beaten-down AI and tech stocks. Advanced Micro Devices closed up 5.53%, Broadcom surged 11.10%, Micron climbed 7.99%, and both Google and Tesla added over 6% in yesterday’s AI-fueled rally. The Magnificent 7 increased nearly $300 billion in market capitalization. And it’s not over!!
Our View
As the ES, NQ, and YM squeeze higher, the CME clearing firms get what is called a SPAM notice of increased margin calls tied to the firm’s customers’ options positions. It used to be that margin calls went out at 10:30 AM and 2:30 PM, but as the CME continues to lock down the exchange’s risk, the margin calls now go out 24 hours a day.
Friday and Monday saw continuous margin calls and liquidation—and that’s what we saw the last few days—and I do not think it’s over.
81.8 million Americans are projected to travel at least 50 miles from home for Thanksgiving, from November 25 to December 1. This is a record high, up 1.6 million (2%) from 2024, according to AAA’s forecast based on data from S&P Global Mobility. It’s the busiest U.S. holiday for travel, with nearly 90% (about 73.2 million) driving, 6.1 million flying domestically (up 2% from last year), and 2.5 million using buses, trains, or cruises (up 8.5%). The forecast accounts for economic factors, bookings, and trends, and could rise if more people drive due to flight issues.
My own opinion is that the schools let out last Friday, and with the way the week is set up, most people will take the entire week off. As more and more people walk away from trading, the lower volumes will continue to favor the upside.
Our Lean
If I am correct, the ES and NQ should not see any major downside reversals. I do not see a retest of last Friday’s lows coming this week, and if it holds, it could be the beginning of a push back to the 6900 level for the ES.
This morning, Nvidia shares were down 3% after The Information reported that Meta Platforms was considering spending billions of dollars on Alphabet’s AI chips. Alphabet shares were up 4% on the back of the report.
Our lean: One of MrTopStep’s trading rules is that the ES and NQ tend to go sideways to lower after a big up day. I can’t rule out some price action like that, but I’m looking to buy the 30 to 60-point pullbacks—no way is this squeeze over yet!
Guest Post: Tom Incorvia – Blue Tree Strategies
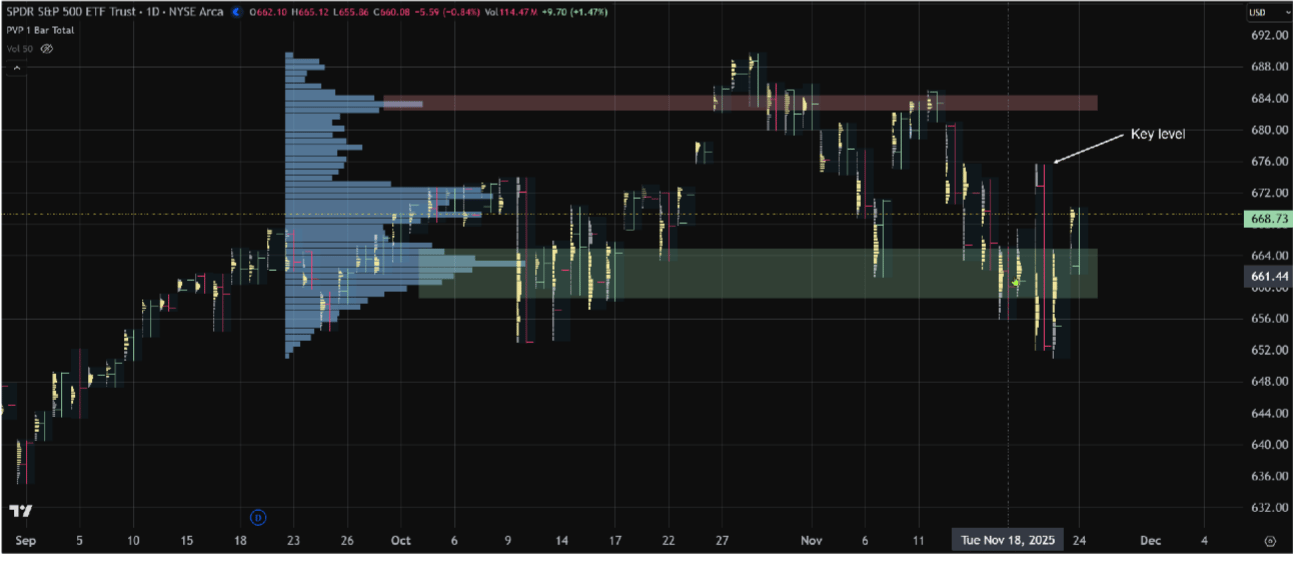
On Monday, the SPY advanced 1.47%, building on roughly a 1% gain from Friday. What makes the recent strength notable is that it comes directly on the heels of Thursday’s sharp intraday reversal—a move widely flagged by technicians as a potential inflection point that could have ushered in additional downside pressure. Instead, buyers stepped back in, and over the past two sessions demand has steadily driven prices higher.
The SPY chart highlights two key zones of interest. The first is the overhead supply region, marked by the red rectangle—an area where sellers previously asserted control. On Thursday, prices pulled back into a well-defined demand zone, in green, between 658 and 666, a level that has been recognized repeatedly as a critical support area. Friday’s session confirmed that buyers were willing to defend the 660 handle, and Monday’s action further reinforced that view. Price opened within Friday’s range and rallied consistently throughout the session on sustained buying interest. The upward shift in Monday’s Value Area relative to Friday’s provides additional confirmation, as Value Area relationships offer a straightforward and reliable way to validate directional conviction.
Looking ahead to Tuesday, one consideration is whether the strength seen on Friday and Monday reflects genuine accumulation or simply short covering after a short-term oversold condition. A meaningful tell will be whether price can take out last Thursday’s swing high—doing so would increase the probability of a full retest of the broader highs.
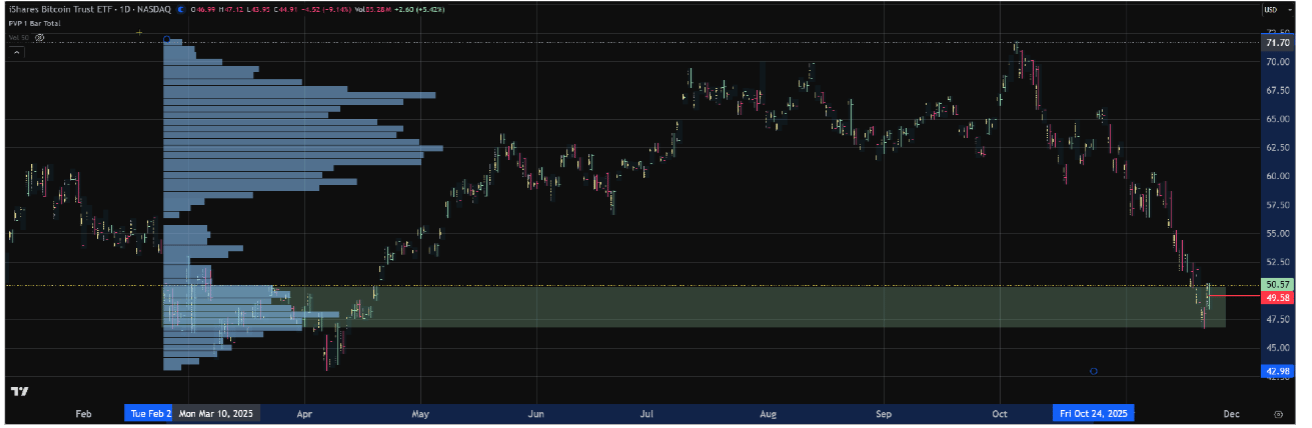
I also wanted to highlight the recent sell-off in Bitcoin. The chart below shows the iShares Bitcoin Trust (IBIT), an ETF that tracks Bitcoin closely. Since early October, Bitcoin has sold off roughly 35%. Late last week, prices drifted into a previously established demand zone dating back to March. When price revisits a historical demand area, technicians typically wait for confirmation that buyers are willing to defend the level.
Today’s session provided that confirmation. IBIT opened within Friday’s range and immediately attracted steady buying interest throughout the day. Monday’s Value Area shifted higher relative to Friday’s—another constructive signal. With Bitcoin deeply oversold and pressing into a known demand zone, the conditions are in place for a potential bounce from this area.
Tom Incorvia began his career in financial services in 1987 and has amassed over three decades of experience navigating the complexities of the markets. His career spans both the buy-side and sell-side of the trading desks, having served as Vice President of Equity Trading and later as General Partner of a hedge fund. This dual perspective has provided him with a unique and well-rounded understanding of market behavior.
You can purchase Tom’s Course on Volume Profile here.
Market Recap
There are patterns that exist in the markets, and if you catch them—
Yesterday’s short squeeze is part of a larger pattern that has existed in the SPU, now $ES, that I have seen hundreds of times both at my S&P desk and off the floor.
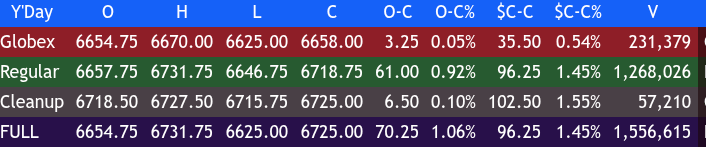
The ES traded up to 6670.00 and opened Monday’s regular session at 6657.75, up 35.25 points or +0.53%. After the open, the ES traded 6654.75 and rallied 32 points up to 6686.75 at 9:35 AM in the first five minutes, then sold off 40 points down to 6646.75 at 9:50.
After the low, the ES rallied 67.75 points up to a 6715.50 double top, sold off down to 6705.25 at 11:30, rallied up to a new high 6716.50 at 11:45, and then rallied up to 6729.00 at 1:15. After the high, the ES pulled back to 6719.00 at 1:30, then rallied to another new high at 6729.50 at 2:05, pulled back to the 6710.00 level at 2:50, rallied up to a new high at 6730.50, and traded 6720.00 as the 3:50 cash imbalance showed $4 billion to buy.
It then traded up to a new high at 6731.75 at 3:55, sold off down to 6716.25, and traded 6718.75 on the 4:00 cash close. It settled at 6725.00, up 67.75 points or +1.01%, and the NQ settled at 24,962, up 642.75 points or +1.53% on the 5:00 futures close.
I put this in the chat at 10:00:
IMPRO : Dboy : (10:00:25 AM): nq going back to 25k
At the time, it was trading 24,650.00. It rallied 336 points after that post up to 24,986.50, only 13.5 points off from my 25,000 call.
In the end, everything worked in favor of the bulls—up FRYday, rally on Globex, open and blast higher, pullback, and just rip higher with the NQ and tech #NVDA +2.05% and $GOOG +6.28% leading the way.
In terms of the ES’s overall tone, I think the day’s trade was telegraphed after the opening rip. In terms of the ES’s overall trade, volume was much lower, with only 1.5 million contracts traded.
MiM
Market-on-Close Recap – Monday, November 17, 2025
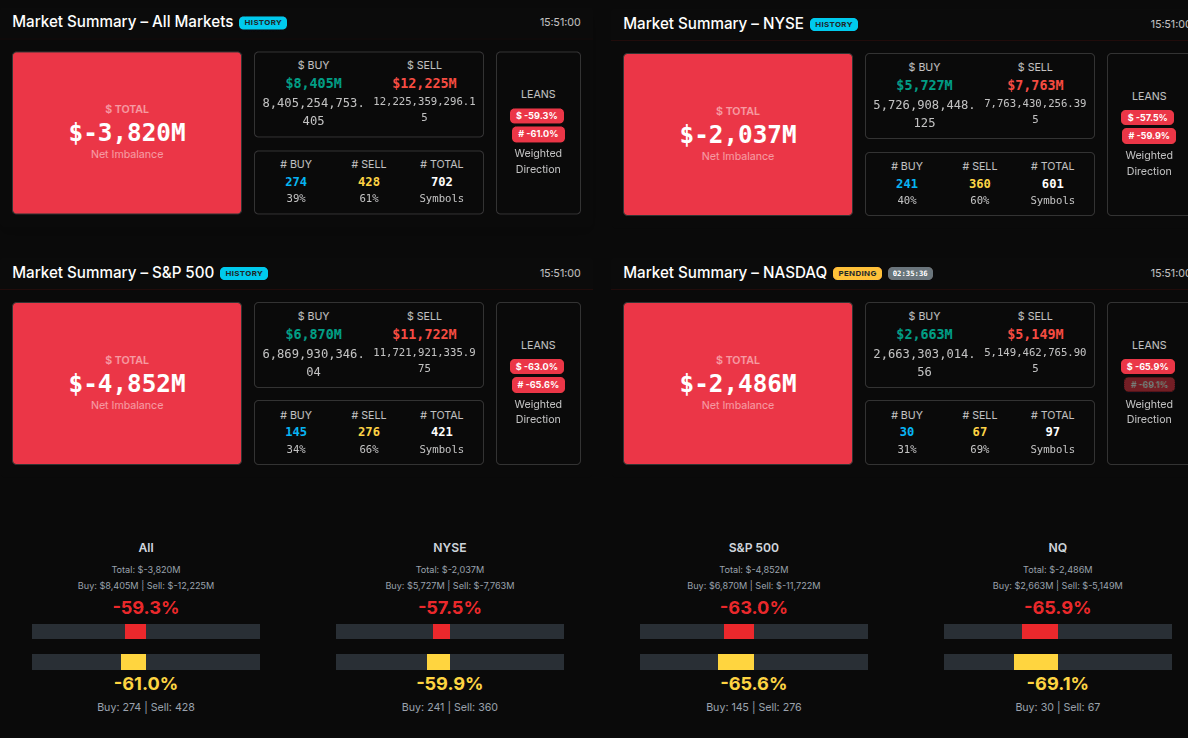
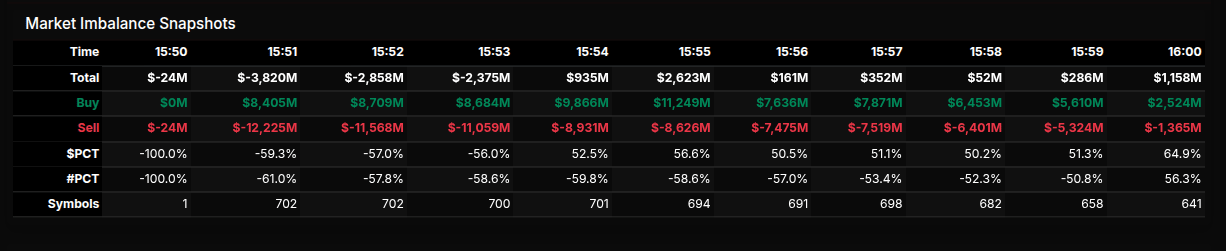
The market-on-close auction opened with a sharp sell bias, and despite a brief midday stabilizing attempt, selling pressure remained with an initial opening imbalance of –$3.82B, driven by a surge of sell interest across NYSE, S&P, and NASDAQ constituents. The sell side peaked at more than –$12B shortly after, while buy interest held near $8.4B, keeping the market skewed heavily negative. Only in the final minutes did the total imbalance moderate, finishing near –$1.16B at 16:00.
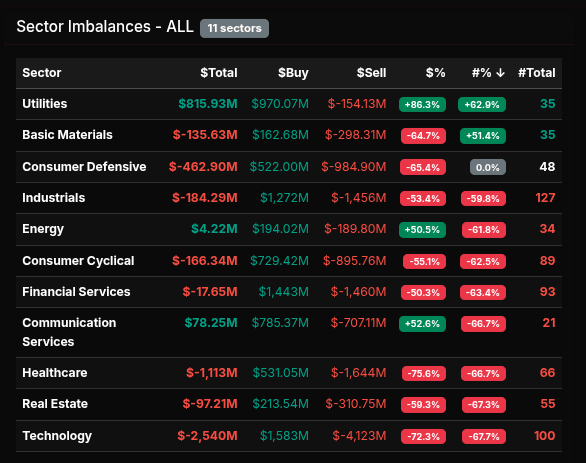
Sector flows showed clear defensive rotation mixed with targeted liquidation. Utilities posted the only meaningful net buy program at +$815.9M, with 86.3% net buy skew—classic wholesale buying, indicating institutions stepping into defensive yield. Communication Services also showed a notable +$78.25M tilt. Energy finished slightly positive at +$4.22M but leaned negative in percent terms, suggesting rotation rather than accumulation.
On the sell side, Technology was the standout liquidation target, closing at a massive –$2.54B with a –72.3% lean, strong evidence of systematic sell programs. Healthcare (–$1.11B), Consumer Defensive (–$462.9M), Industrials (–$184.29M), and Real Estate (–$97.21M) all showed heavy outflows with sell leans beyond –50%.
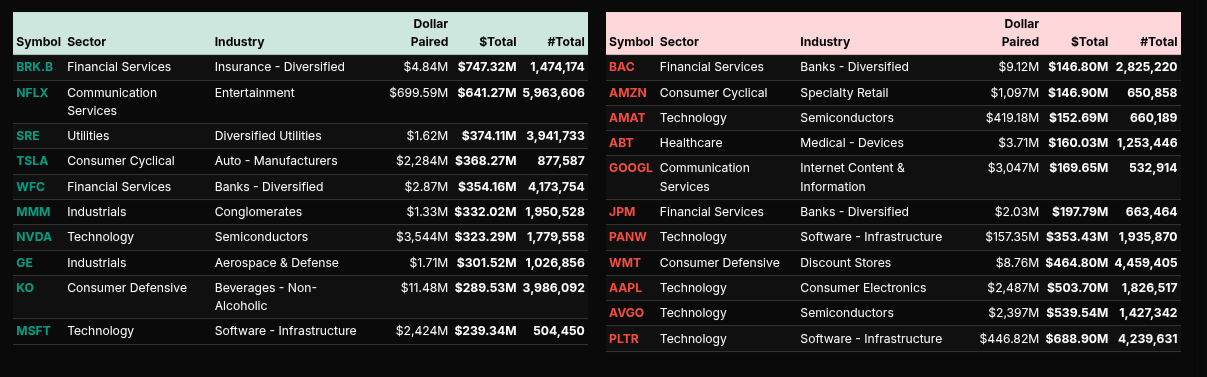
Symbol-level pressure confirmed this theme. On the buy list, BRK.B, NFLX, SRE, and TSLA drew consistent inflows, while NVDA and MSFT had moderate buy interest that failed to offset the broader tech liquidation. On the sell list, BAC, AMZN, AMAT, GOOG, WMT, and PLTR all posted significant sell totals, with tech again the center of pressure.
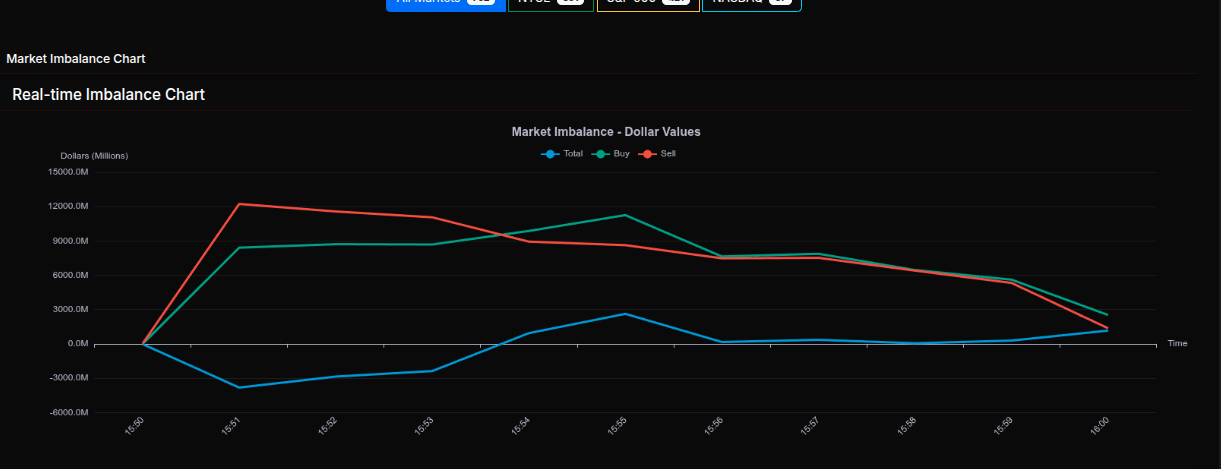
The imbalance curve showed the market starting deeply negative, climbing toward neutral by 15:54 as buys built, then flipping to a buy‑side dominant posture at 15:55 before slipping again into the final 16:00 reduction.
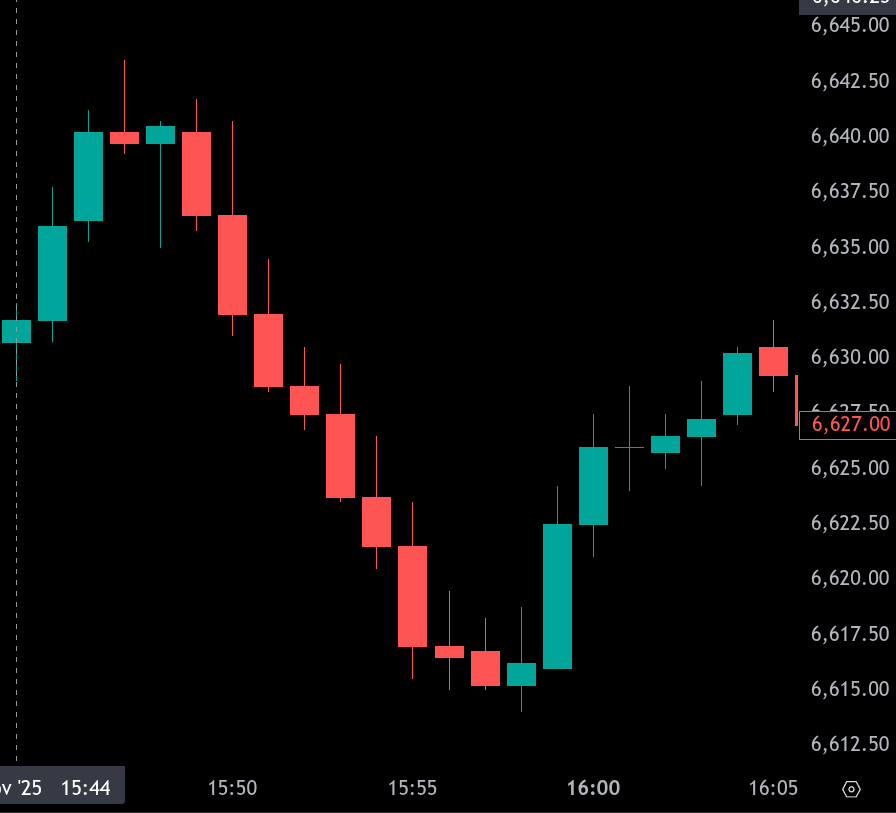
Price action confirmed the imbalance flow: ES sold steadily from 15:44 through 15:55, making successive lower lows into 6,615 before reversing sharply. The 15:55 buy‑side flip aligned with a strong rotation candle that carried prices back toward 6,630 into 16:05.
Overall, this was a classically negative MOC session driven by program selling in Technology and Healthcare, modest rotation into Utilities, and broad-based liquidation across major indices. Institutions clearly leaned risk-off into the close.
Technical Edge
Fair Values for November 25, 2025:
-
SP: 16.07
-
NQ: 67.31
-
Dow: 65.32
Daily Market Recap 📊
For Monday, November 24, 2025
-
NYSE Breadth: 57.93% Upside Volume
-
Nasdaq Breadth: 76.20% Upside Volume
-
Total Breadth: 72.91% Upside Volume
-
NYSE Advance/Decline: 62.99% Advance
-
Nasdaq Advance/Decline: 68.37% Advance
-
Total Advance/Decline: 66.38% Advance
-
NYSE New Highs/New Lows: 48 / 40
-
Nasdaq New Highs/New Lows: 151 / 152
-
NYSE TRIN: 1.19
-
Nasdaq TRIN: 0.65
Weekly Breadth Data 📈
For Week Ending Friday, November 21, 2025
-
NYSE Breadth: 42.97% Upside Volume
-
Nasdaq Breadth: 45.65% Upside Volume
-
Total Breadth: 44.68% Upside Volume
-
NYSE Advance/Decline: 32.53% Advance
-
Nasdaq Advance/Decline: 34.08% Advance
-
Total Advance/Decline: 33.51% Advance
-
NYSE New Highs/New Lows: 115 / 282
-
Nasdaq New Highs/New Lows: 236 / 787
-
NYSE TRIN: 0.63
-
Nasdaq TRIN: 0.60
ES & NQ Levels (Premium only)

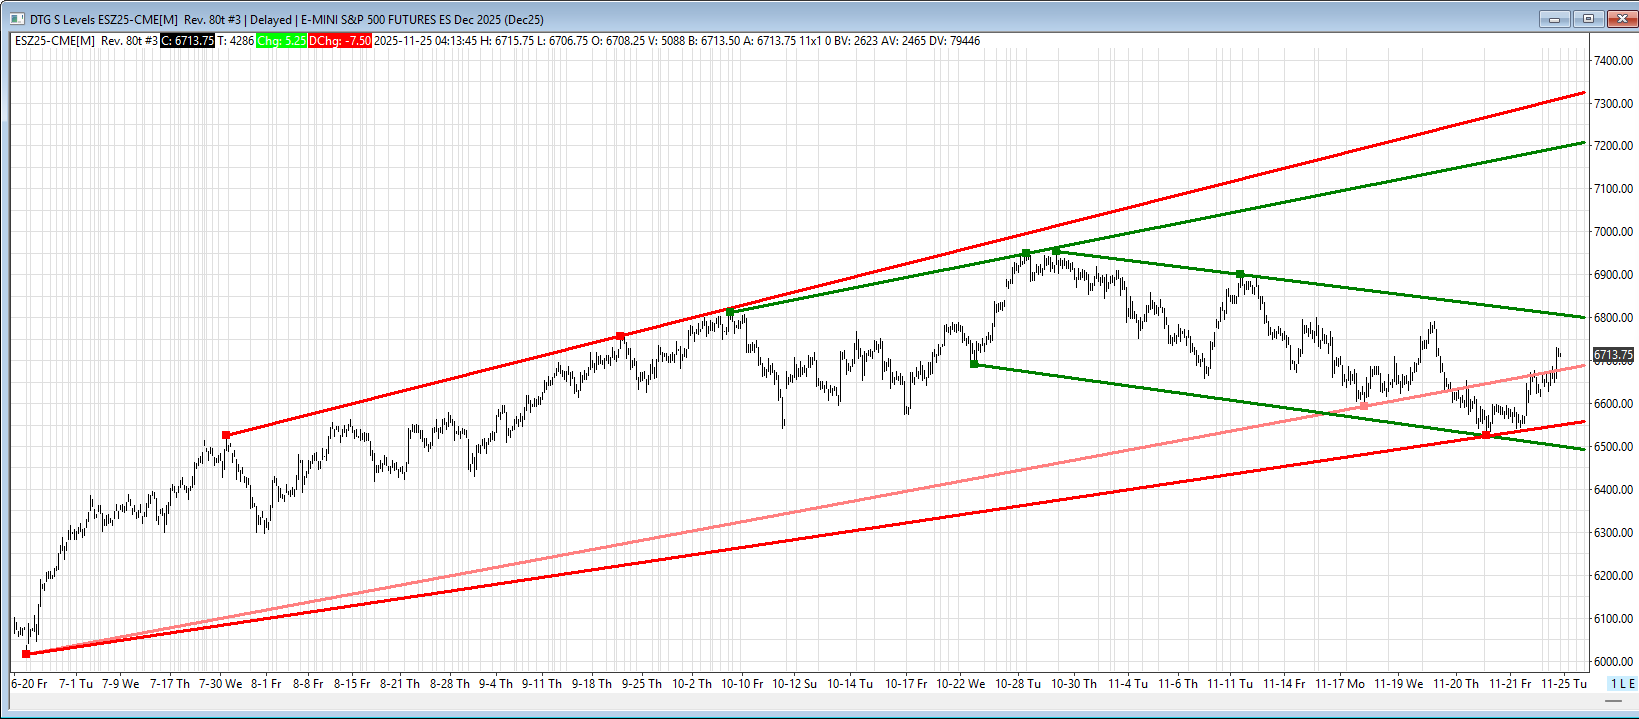
ES – Z Levels
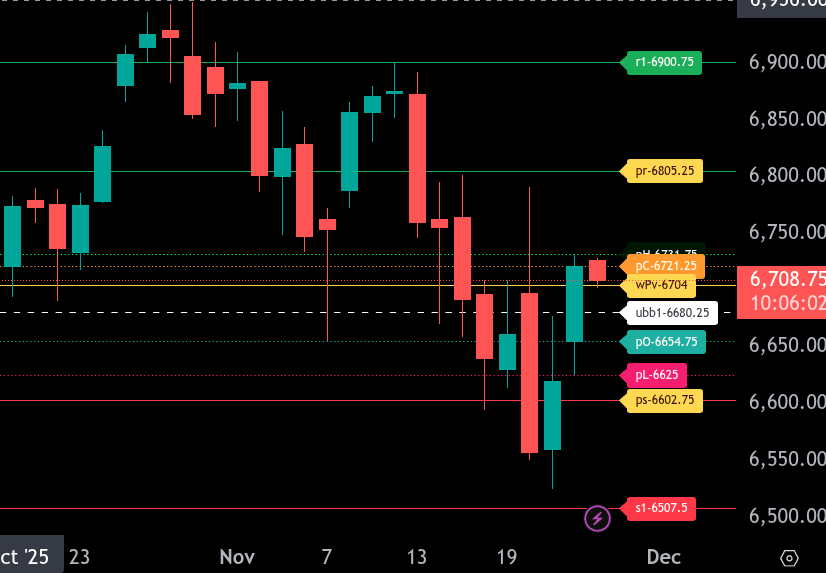
ES is currently trading near 6708.25 in Globex.
The bull/bear line is at 6704. Above this level, buyers have short-term control; below it, momentum shifts back to sellers.
Upside, the upper range target sits at 6805.25. If ES can hold above 6704 and push through 6731.75 resistance, continuation toward 6805.25 is likely. Beyond that, next resistance stands at 6900.75.
Downside, the lower range target is at 6602.75. A break back under 6680.00 opens the door for a move toward 6654.75, and sustained selling could push price into the 6625.00 and 6602.75 supports. The next major support below is 6507.50.
Intraday tone stays constructive while holding above 6704. A rejection below shifts bias back to testing the lower supports for the session.
NQ – Z – Levels
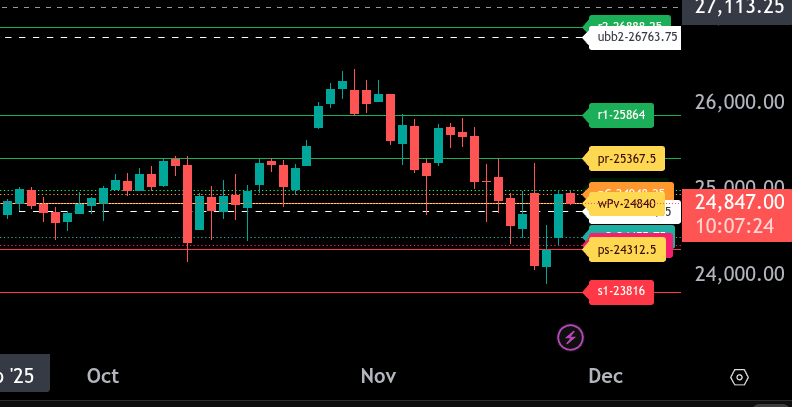
The bull/bear line for the NQ is at 24,840. Price is currently trading around 24849.25, sitting just above this key level. Holding above keeps the short-term bullish tone; slipping back below shifts control to sellers.
Upside, resistance sits at 24,993.5 and then 25,367.5, which serves as today’s upper range target. A move above 24,993.5 opens a path toward the upper range target if momentum expands.
Downside, support comes in at 24,749.5 and then 24,455.75. Below that, 24,312.5 is today’s lower range target. Loss of 24,749.5 increases the likelihood of probing deeper into support.
Overall, the session pivots around 24,840. Above it, buyers can press toward 24993.5 and 25,367.5. Below it, price risks rotating down toward 24,749.5 and the lower range target at 24,312.5.
Calendars
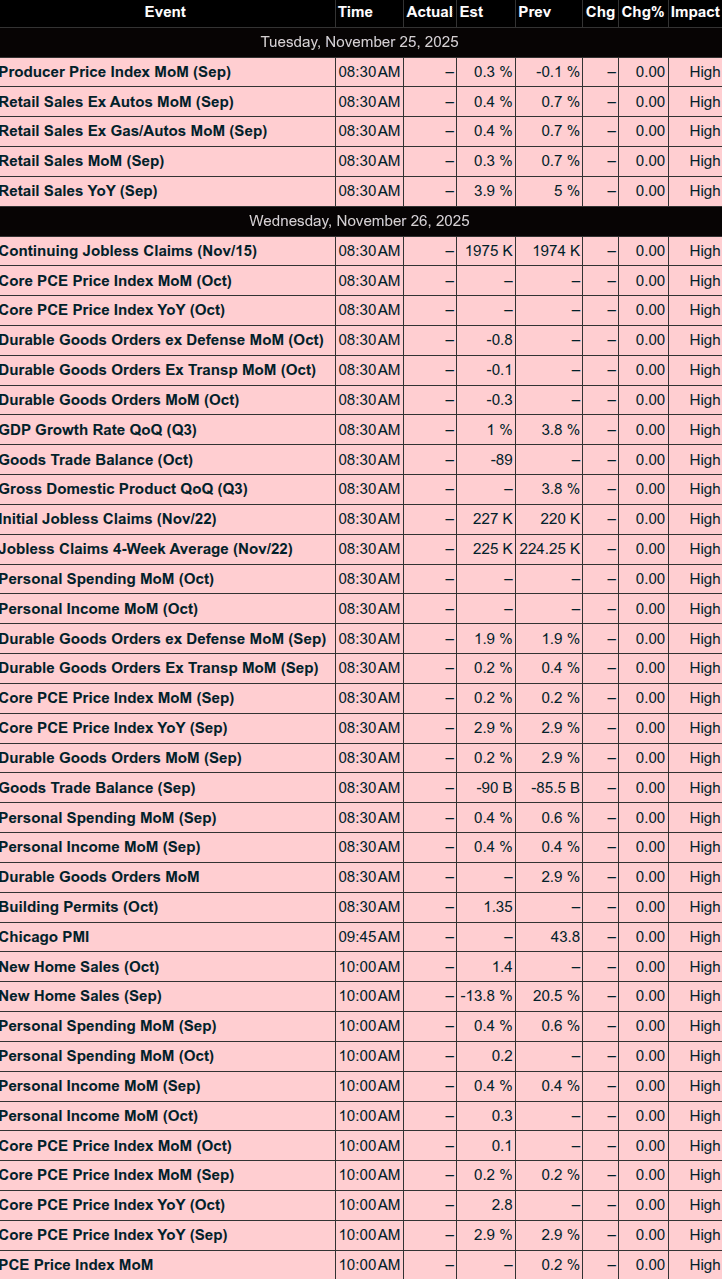
Economic Calendar
Today
Important Upcoming
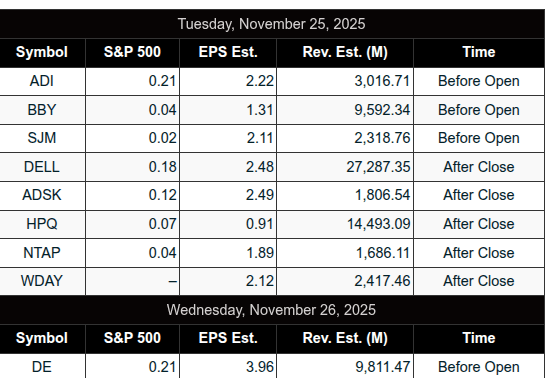
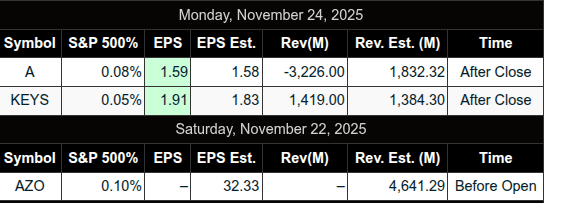
Earnings
Trading Room Summaries
Polaris Trading Group Summary – Monday, November 24, 2025
Monday kicked off strong with a bullish tone and well-defined trade levels outlined early in the session. The theme of the day centered around bulls maintaining control, with multiple profitable opportunities for longs, especially during the morning and early afternoon sessions. The market responded well to planned levels and cycle expectations, aligning with a Cycle Day 2 rhythm. Although ES faltered at the open, CL and NQ delivered clean wins, and the day ultimately leaned positive.
Highlighted Trades & Setups:
-
Manny’s Early Long:
-
Took a long in the 6643s after recognizing a structural shift and holding above previous highs.
-
This trade aligned with Support Buy #2, though executed slightly late as a breakout instead of a zone catch.
-
Solid execution and a green Monday—a key personal performance milestone for Manny.
-
-
PTGDavid’s Trade Calls:
-
Initial upside target 6665 (from the Daily Trade Strategy) was fulfilled early, confirming the bullish scenario.
-
@CL Open Range short hit all targets—a clean, precise setup.
-
Shifted to long lean mid-morning, looking to buy pullbacks, which proved effective as bulls reclaimed control around the 6690s and pushed higher.
-
-
Continuation Long Added by Manny:
-
A new Continuation Long setup at 6663–6667 was identified and shared mid-morning, helping traders look to press longs as momentum held.
-
-
A4 & A10 Runner Management:
-
These positions were managed actively by David, with trailing stops lifted and eventually elected, locking in profits before a market shift.
-
Market Flow & Lessons Learned:
-
Cycle Day 2 Behavior:
The market showed typical flip-flop behavior early on, with dominance only becoming clear mid-session. Understanding cycle days continues to provide an edge, especially when entries align. -
Key Support/Resistance Zones:
The 6630 level served as the “line in the sand” and held beautifully. Later, 6715–6720 acted as key support until the afternoon shift handed momentum to the bears. -
“Turkey Trot” Commentary:
-
David humorously framed the bull run as the “Turkey Trot” with bears “on the menu.” The market fulfilled its upper Money Box target zone before reversing—a common pattern to note.
-
-
2 PM “Shake n Bake”:
-
The afternoon shift was textbook: once price hit the Money Box target, a bearish reversal unfolded. David flagged it early, suggesting bounces were now actionable on the short side.
-
End-of-Day Notes:
-
Closing Hour Volatility:
-
The MSCI rebalancing and MOC imbalances introduced late-day volatility.
-
MOC flipped from a $4B sell to a $3B buy—a “crapshoot” environment that PTG advised against trading.
-
Despite this, bulls retained control overall, fulfilling the positive cycle expectation.
-
Takeaways:
-
Discipline Pays: Manny emphasized how starting Monday green improves weekly outcomes—a useful mindset and motivational metric.
-
Structure Awareness: Watching for structural shifts and respecting levels like 6630 and 6715 helped guide successful entries and exits.
-
Cycle Day Awareness: CD2 behavior played out cleanly, and David’s real-time commentary helped traders adapt.
Result:
Bullish day overall, with strong setups in the morning, clean reads on momentum shifts, and an effective alignment with the cycle playbook. Traders who stayed focused and followed the evolving structure were rewarded with multiple solid trade opportunities.
Discovery Trading Group Room Preview – Tuesday, November 25, 2025
-
Macro & Market Overview:
-
Tech Surge: Big Tech lifted markets Monday, with the Nasdaq jumping 2.7%, though it’s still negative for the month. Nvidia (NVDA) is under pressure after reports that Meta (META) may buy AI chips from Alphabet (GOOG), pulling NVDA down 2% premarket and weighing on S&P 500 futures.
-
Apple (AAPL) Cuts Jobs: In a surprise move, Apple laid off dozens in sales amid a business-focused reorganization, despite strong growth and expectations for near-record $144B in next-quarter revenue.
-
Fed Rate Cut Odds Rise: December rate cut expectations climbed to 80.9% (from 50%) after dovish comments from Fed Governor Waller.
-
Geopolitics: Trump and Xi spoke for the first time since their trade truce. Soybean trade continues to expand, with China boosting exports to India. Tensions remain high between the US and EU over tariffs and tech rules.
Earnings Watch:
-
Premarket: BABA, ADI, BBY, BHP, BURL, DKS, KEP, NIO, SJM
-
After the Bell: ADSK, DELL, HPQ, NTNX, WDAY, ZS
-
Wednesday AM: DE, LI
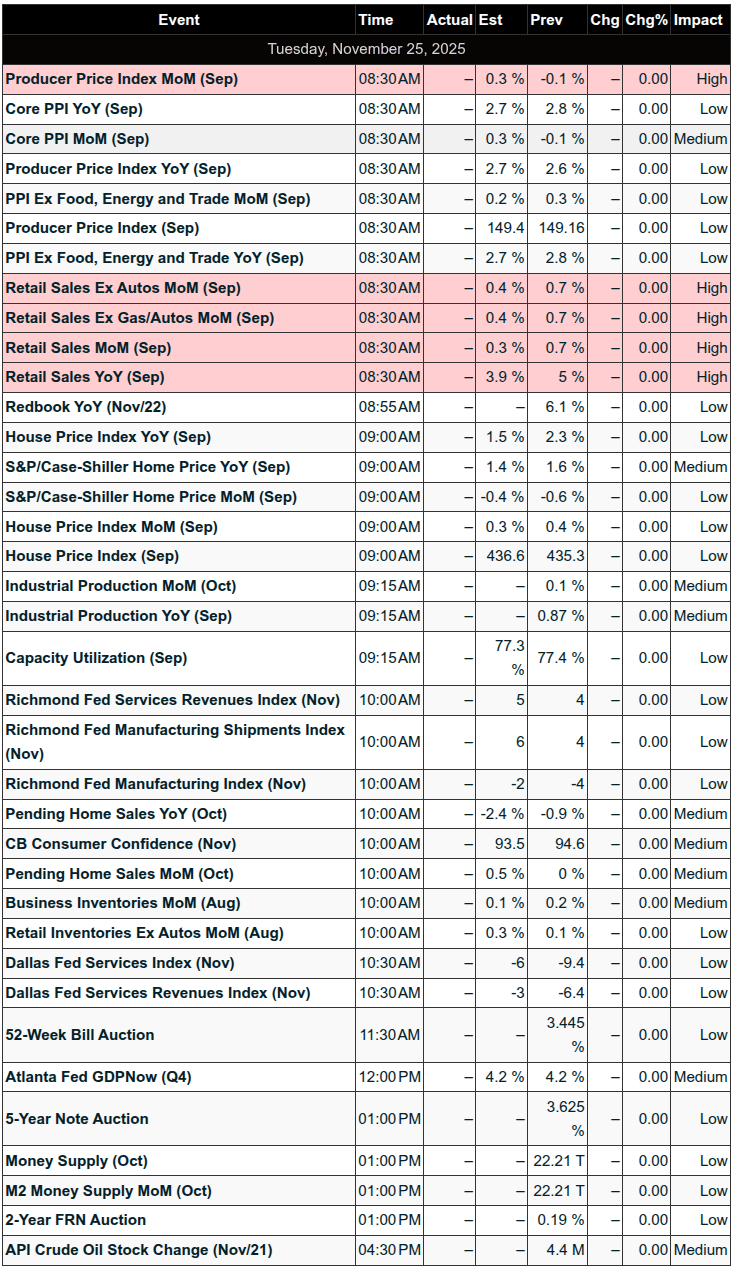
Economic Data Today (All ET):
-
8:30am: PPI, Retail Sales
-
9:00am: HPI, S&P/CS-20
-
10:00am: Pending Home Sales, Richmond Fed, Business Inventories
-
2:00pm (tentative): Federal Budget Balance
Market Internals:
-
Volatility eased slightly on light volume; ES 5-day ADR dipped to 143 points.
-
No significant large trader bias overnight.
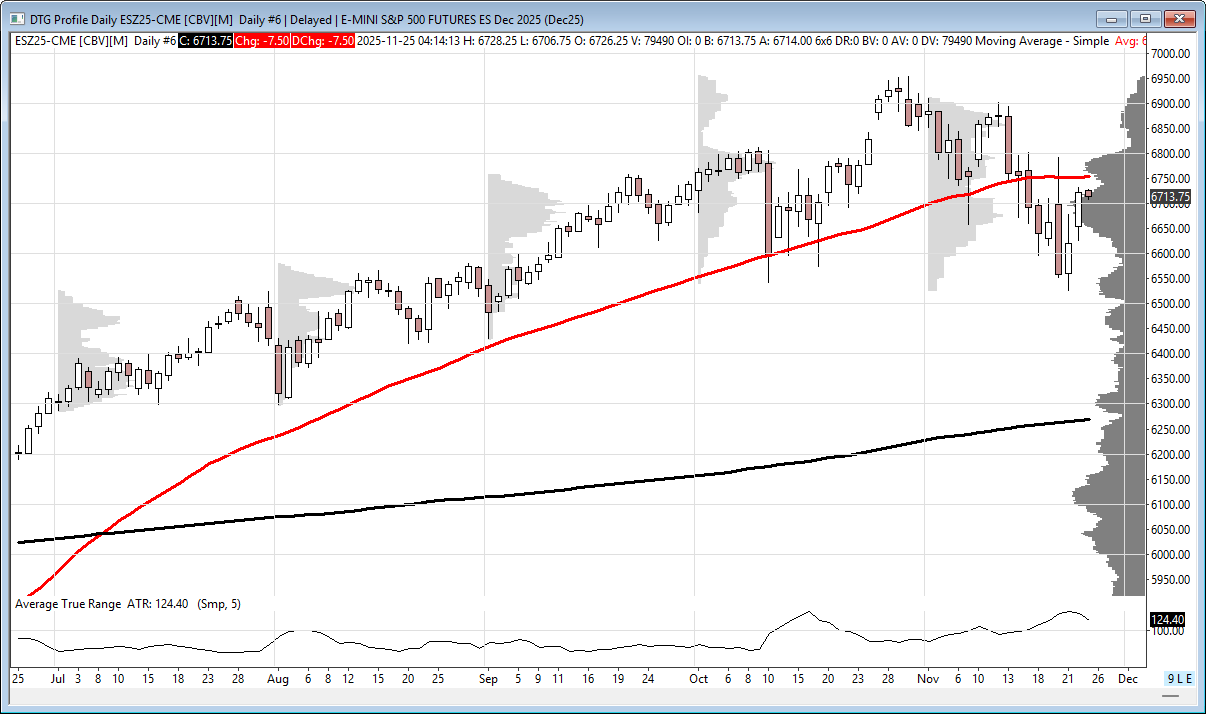
Technical Outlook (ES):
-
Mixed trend: ES re-entered intermediate uptrend, remains in a short-term downtrend.
-
Resistance: 6752.75 (50-day MA), 6800/05 (channel top), 7205/10, 7330/35
-
Support: 6553/58, 6493/88
Both bulls and bears have near-term opportunities as price tests key trend levels.
-
Affiliate Disclosure: This newsletter may contain affiliate links, which means we may earn a commission if you click through and make a purchase. This comes at no additional cost to you and helps us continue providing valuable content. We only recommend products or services we genuinely believe in. Thank you for your support!
Disclaimer: Charts and analysis are for discussion and education purposes only. I am not a financial advisor, do not give financial advice and am not recommending the buying or selling of any security.
Remember: Not all setups will trigger. Not all setups will be profitable. Not all setups should be taken. These are simply the setups that I have put together for years on my own and what I watch as part of my own “game plan” coming into each day. Good luck!
This post goes out as an email to our subscribers every day and is posted for free here around 2 PM ET. To get your real-time copy, sign up for the free or premium version here: Opening Print Subscribe.
Comments are closed