This post goes out as an email to our subscribers every day and is posted for free here around 2 PM ET. To get your real-time copy, sign up for the free or premium version here: Opening Print Subscribe.
If the Econ Data Behaves, December’s First Licks Could Be Straight-Up
Follow @MrTopStep on Twitter and please share if you find our work valuable!
Our View
I don’t need the Wall Street Journal to tell me why the S&P and Nasdaq rallied. I’ve learned over the years not to pat myself on the back, but after all the hoopla and AI bubble scare tactics, the ES is back where it was when the sell-off started.
I never fell for any of the “AI Bubble” BS, and after the 6525.00 low on 11/20, the ES has rallied 338.55 points. Over the last five sessions, it has rallied +239.25 points or +3.62%, and is 91 points off its all-time contract high of 8954.75.

ESz
NQz
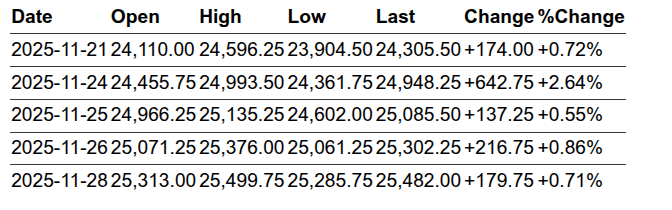
The NQ made its low on 11/20 at 24,073.27 and made a high on Friday at 25,499.75 — that’s a gain of 1,426.50 points or +5.93%. Over the last five sessions, the NQ has gained 1,176.50 points or +4.84%, and is now 899.25 points off its 26,399.00 all-time contract high.
JPMorgan and Goldman Sachs Rate Cut Reversal
J.P. Morgan and Goldman Sachs now forecast a 0.25% bps Federal Reserve rate cut during the December 9–10 FOMC meeting, which would lower the federal funds target range from the current 3.75–4.00% to 3.50–3.75%.
J.P. Morgan reversed its earlier January call after recent Fedspeak—notably from New York Fed President John Williams—tilted the balance, while Goldman Sachs says the soft September jobs report effectively “sealed” the move, especially with no major data releases left before the meeting.
Both banks cite cooling labor-market trends and moderating inflation (near the 2% target, excluding tariff effects) as justification, following the Fed’s back-to-back 0.25% bps cuts in September and October.
Market pricing on the CME FedWatch Tool has jumped to roughly 85% odds of a December cut (up from 30% in mid-November), even as Chair Powell insists there is “no preset course,” and some officials remain wary of inflation risks. With the Fed also ending balance-sheet runoff on December 1, attention is squarely on this potential final cut of 2025.
The Week Ahead
Fed Blackout, Economic Reports, and Earnings Key Events
The Fed’s Blackout period started Saturday, November 29, and ends on December 11. To learn more about the Fed Blackout Period, you can find the official blackout calendar on the Federal Reserve Board website.
Day
Date
Highlight Event (Time ET)
Notable Earnings (Time ET)
Monday
December 1
ISM Manufacturing PMI (10:00 AM)
CrowdStrike (CRWD) (~7:00 AM)
Tuesday
December 2
Construction Spending MoM (10:00 AM)
Salesforce (CRM) (~4:30 PM)
Wednesday
December 3
ISM Non-Manufacturing PMI (10:00 AM)
– (no major large-cap earnings confirmed)
Thursday
December 4
International Trade Balance (8:30 AM)
– (no major large-cap earnings confirmed)
Friday
December 5
Personal Income & PCE Price Index (8:30 AM)
– (no major large-cap earnings confirmed)
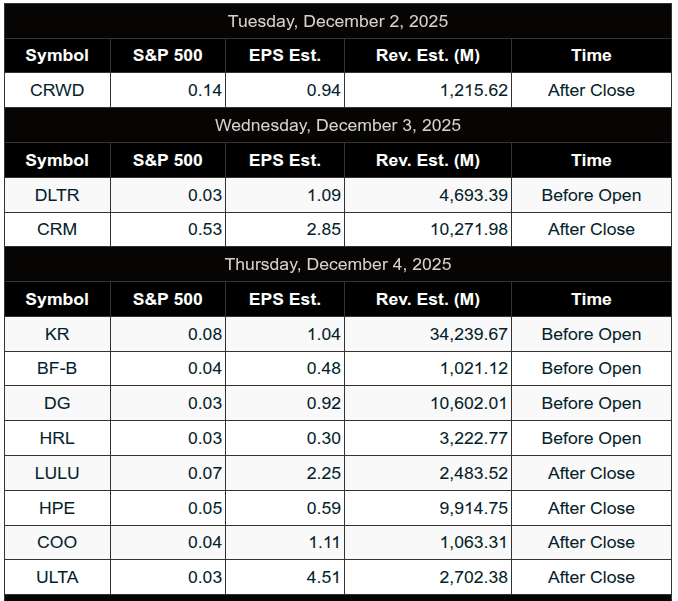
After Salesforce on Tuesday, the rest of the week is very quiet for big-cap earnings reports.
Our View
Despite the 5-day rally, the ES still closed down 2.82% and the NQ closed down 1.92%. That said, the end-of-month rotation favored buying, and I think that’s what we’ll see in the first trading days of December, barring some past-due, negative economic reports, which could cause some type of temporary sell-off.
As of last Friday’s close, 95% of the S&P have reported their third-quarter earnings, with 83% of the companies beating analysts’ earnings per share (EPS) estimates—higher than the long-term average—and marking one of the strongest quarters since 2021.
Our Lean
Higher Prices Ahead
I know @HandelStats is bullish out of his mind and has a few studies for December and next year, but I gotta go back to my old steady: the Stock Trader’s Almanac. I understand that there are occasions when the stats don’t work, but I think what we saw last week was a very oversold ES and NQ having a come-to-Jesus moment. The end of the month and the December rate cut being back on is another great example of all the disinformation the public gets sold, and was probably on the entire time.
According to the Stock Trader’s Almanac (I used AI to summarize), but this shouldn’t be a big surprise:
December Stock Market Stats from the Stock Trader’s Almanac
The Stock Trader’s Almanac, a go-to reference since 1968 for seasonal patterns and cycles, highlights December as one of the strongest months for U.S. stocks, particularly due to the year-end rally. Based on the 2025 edition (covering data through 2023–2024), here’s a summary of key historical statistics for the S&P 500 and Dow Jones Industrial Average (DJIA) in December. These are drawn from long-term averages (e.g., 1950 onward, where noted) and emphasize recurring trends like the “Santa Claus Rally.”
Note: Past performance isn’t indicative of future results. The Almanac uses BULL/BEAR icons for days with >60% up/down probability over 21-year periods.
Key December Performance Stats
Metric
S&P 500
DJIA
Notes
Avg. Monthly Gain
+1.5%
+1.3%
Strongest month of the year; positive 74% of the time since 1950.
Median Gain
+1.7%
+1.4%
Less skewed by outliers; outperforms November and January.
Best Case (Top 10%)
+8.2%
+7.5%
Driven by holiday optimism and portfolio rebalancing.
Worst Case (Bottom 10%)
-4.1%
-3.8%
Rare, often tied to broader bear markets.
Win Rate (Up Months)
74%
72%
Consistent bullish bias; fails ~1 in 4 years.
Santa Claus Rally
-
Average Gain: +1.3% (S&P 500 since 1950 and 1969).
-
Frequency: Rises 76% of the time over the 7-day span (last 5 trading days of Dec + first 2 of Jan) — far above random (~52% for any 7-day window).
-
DJIA Equivalent: +1.1% average, 73% positive.
-
Why It Happens: Lighter holiday trading volume, year-end buying, and January effect spillover (as tax-loss harvesting reverses early in Jan).
Other Notable December Patterns
-
January Effect Overlap: ~60% of the “January Effect” (small-cap outperformance) occurs in late December, with mid-December now the new trigger point.
-
Pre-Holiday Bias: Markets rise ~65% of the time 3 days before/after major holidays (e.g., Christmas Eve close).
-
Quad Witching: December’s options/futures expiration (3rd Friday) often amplifies volatility but tilts bullish in Q4 (up ~68% post-event).
-
Post-Election Years: In year 1 of presidential cycles (like 2025), December gains average +2.1% for the S&P, boosted by policy optimism.
Trading Implications
The Almanac recommends going long into December—especially the final week—as part of the “Best Six Months” strategy (Nov–Apr). For 2025, with Fed rate cuts expected and election-year momentum in play, it flags heightened upside potential but warns that “Santa Claus failures” (no rally) often lead to stronger January–February rebounds.
For the full calendar with daily BULL/BEAR icons, check the 2025 edition.
Our lean: The institutions marked the Dow, S&P and Nasdaq at month end and they are going to mark up the first week of December and the month. The pattern remains the same, sell the early rallies / higher open or just buy the pull backs. That’s the good side, the bad side is how much the ES and NQ have rallied over the last 3 or 4 day. Nothing goes up forever without a pull back. As for levels, any 40 to 60 point drops should be a good entry point
Goldman Sachs: The M&A Outlook for 2026

Stephan Feldgoise on Goldman Sachs Exchanges
Mergers and acquisitions (M&A) activity has picked up sharply in the second half of the year despite geopolitical uncertainty, elevated tariffs, and slowing growth.
That’s partly due to the availability of capital in both public and private credit markets, as well as a more robust IPO market, says Stephan Feldgoise, head of the global M&A business in Goldman Sachs Global Banking & Markets, on Goldman Sachs Exchanges.
CEOs and boards, prompted by their shareholders, are strategically repositioning their businesses for the long term, evaluating plans for the next two to three decades, Feldgoise says. Artificial intelligence (AI) has emerged as an increasingly important factor influencing boardroom decisions and driving dealmaking, he says. “There’s not an M&A situation or an M&A decision that’s being made without extraordinary consideration about the AI impact—not only to our company, but to the target company or the company that we’re merging with.”
These factors are propelling dealmaking to a pace that is likely to continue into 2026, Feldgoise adds. The rate of deals over the last three months has rivaled that of 2021—one of the busiest years for M&A. “It’s not just become an active year,” he says, “it’s become one of the most active years in history.”
Market Recap
In true fashion, the ES traded up to 6810.75 on Globex and opened Wednesday’s regular session at 6805.00, up 24.75 points or +0.36%. What did the ES do next? It rallied 18.75 points up to 6823.75 at 9:50, sold off down to the RTH low at 6795.75, rallied 50.75 points up to 6846.50 at 11:40, traded down to 6833.50, rallied up to a lower high at 6844.50 at 1:25, sold off down to 6824.75 at 1:45, rallied up to 6843.25 at 2:30, and then rallied up to 6845.25 at 3:15.
After the high, the ES and NQ both started going offered, the ES traded down to 6835.50 as the 3:50 imbalance showed $1.7 billion to sell, then sold off down to 6825.25 at 3:55.
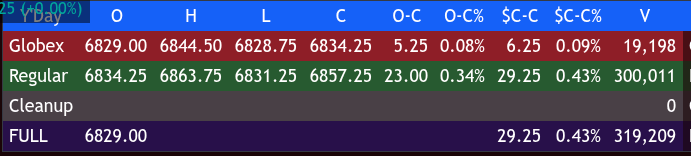
On Wednesday night’s Globex session into Thursday’s Globex session, the ES traded up to 6846.67 and settled at 6828.00, up 46.50 points or +0.69% on a total volume of 1.459 million contracts traded. On Friday, the ES traded up to 6863.75 and settled at 6857.25, up 29.25 points or +0.43%. The NQ settled at 25,085.50, up 131,590 points or +0.55% on the day.
In the end, the market powered higher. In terms of the ES and NQ’s overall tone, they did exactly what they did Monday and Tuesday: they gapped higher, rallied, sold off, and then rallied again.
During Friday’s holiday extended Globex trade, the CME experienced an outage from a CyrusOne data center cooling failure that halted trading until 8:30 a.m. Friday and thinned post-Thanksgiving volume. Stocks closed at two-week highs and up five sessions in a row. The semiconductors and energy stocks rallied, with WTI crude up over 1%. The big November month-end rebalance, plus the index markets pricing in an 83% probability of a 25 bps Fed rate cut at the December 9–10 FOMC meeting, came even as October jobs and CPI data were scrapped and folded into delayed November reports due December 16 and 18.
It takes days and weeks to knock the S&P down—and only one to bring it back.
MiM
The market-on-close flow opened the 12:50 early-close window with an end-of-month buy imbalance at +$1.695B, with $3.145B buy vs. $1.450B sell. From there, the auction held a steady buy-side tone, though it gradually decayed into the close.
Across the major groups, the S&P 500 showed the strongest and most persistent appetite, opening at $2.913B buy vs. $1.018B sell, a 74% lean — a decisive wholesale-level skew (66%+). NASDAQ was even more one-sided, posting a +91.6% buy lean, supported by mega-cap tech inflows. NYSE, in contrast, stayed negative all the way through with a –$9.41M net and a –50% lean, signaling rotation out of older-economy names while the index-heavy tech and growth complex carried the bid.
From 12:50 to 13:00, the time-series shows buy pressure peaking at 12:51 ($3.1B), then steadily fading toward $308M by 13:00. Total imbalance fell from $1.695B to just $88M, confirming that the early burst of demand was met with paired liquidity into the final prints. The lean percentages stayed tight, with most slices registering between +62% and +68%, reflecting directional buying but increasingly rotational behavior as paired sellers stepped in.
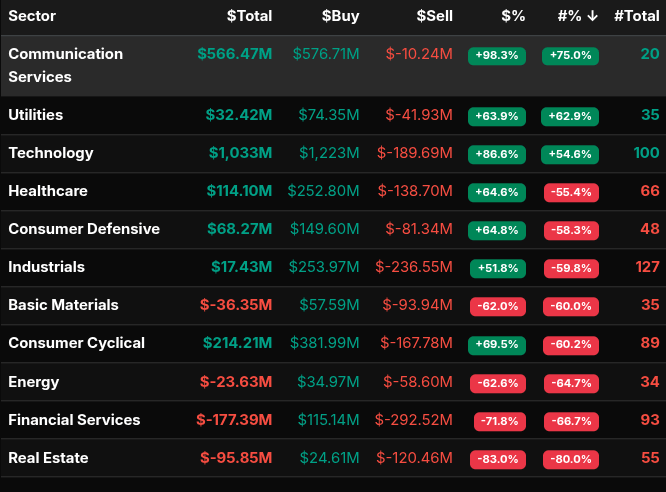
Sector flow was dominated by Technology ($1.033B total) and Communication Services ($566M) — both posting strong buy skews of +86.6% and +98.3%, respectively. Heavyweights led the tape: NVDA ($306M), GOOG/GOOGL ($224M / $128M), AAPL ($180M), MSFT ($112M), and META ($118M).
On the sell side, Financial Services (–$177M), Real Estate (–$95M), and Energy (–$23M) showed deep negative leans, with Financials the standout at –71.8%, indicating broad liquidation.
Overall, the MOC opened with a sharp buy imbalance, held a directional tech-led bid, then transitioned into moderation as liquidity paired off into the close.


Technical Edge
Fair Values for December 1, 2025:
-
SP: 10.77
-
NQ: 45.84
-
Dow: 38.16
Daily Breadth Data 📊
For Friday, November 28, 2025
-
NYSE Breadth: 71.7% Upside Volume
-
Nasdaq Breadth: 68.9% Upside Volume
-
Total Breadth: 70.2% Upside Volume
-
NYSE Advance/Decline: 65.0% Advance
-
Nasdaq Advance/Decline: 64.9% Advance
-
Total Advance/Decline: 65.0% Advance
-
NYSE New Highs/New Lows: 106 / 5
-
Nasdaq New Highs/New Lows: 178 / 47
-
NYSE TRIN: 0.52
-
Nasdaq TRIN: 0.80
Weekly Breadth Data 📈
For Week Ending November 28, 2025
• NYSE Breadth: 43% Upside Volume
• Nasdaq Breadth: 46% Upside Volume
• Total Breadth: 45% Upside Volume
• NYSE Advance/Decline: 33% Advance
• Nasdaq Advance/Decline: 34% Advance
• Total Advance/Decline: 33% Advance
• NYSE New Highs/New Lows: 115 / 282
• Nasdaq New Highs/New Lows: 236 / 787
• NYSE TRIN: 0.63
• Nasdaq TRIN: 0.60
Today’s BTS Levels:
ES Z
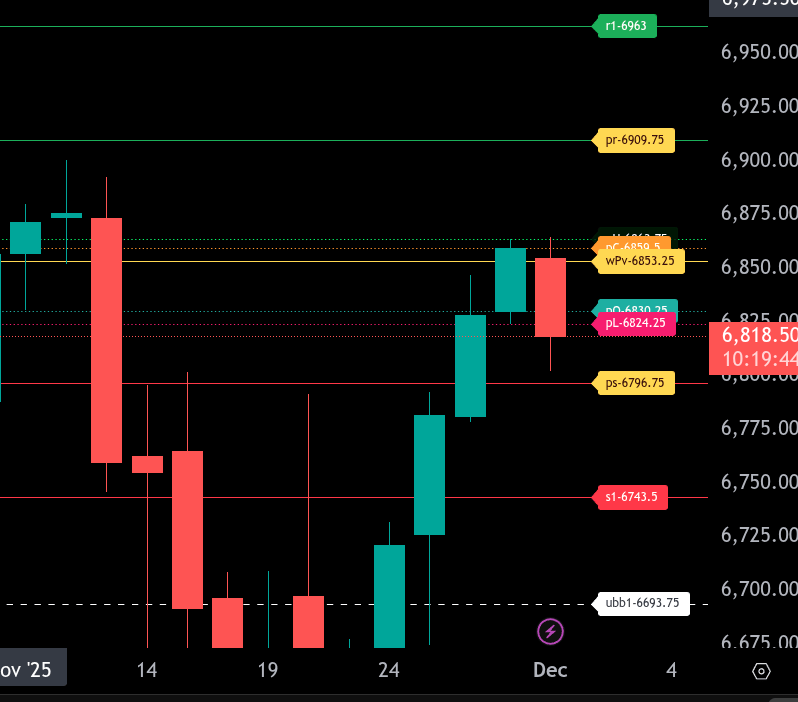
The bull/bear line for the ES is at 6853.25. Holding below this keeps the tone weak in the Globex session.
ES is currently trading near 6819.25, sitting under the bull/bear line and showing downside pressure. If sellers stay in control, the first downside objective is 6796.75, with further extension possible toward 6743.50.
On the upside, resistance sits at 6859.50 and then the upper range target of 6909.75. A sustained move back above 6853.25 would open the door for buyers to test these levels.
Additional support is at 6824.25, with resistance above at 6863.75 and 6883.00 if momentum turns.
NQ Z

The bull/bear line for the NQ is 25,446.25. Trading below this level keeps the tone bearish for now.
Price is currently around 25,297.75, sitting under the bull/bear line. If sellers stay in control, the next downside target is 25,158.25, followed by 24,887.25 as deeper support.
If NQ reclaims 25446.25 and holds, upside opens toward 25,734.25. A sustained move above that level could test 26,005.25.
Support levels: 25,285.75 and 25158.25.
Resistance levels: 25,482.00 and 25734.25.
The lower range target is 24887.25. The upper range target is 25734.25.
Calendars
Today’s Economic Calendar

This Week’s Important Economic Events

Upcoming Earnings
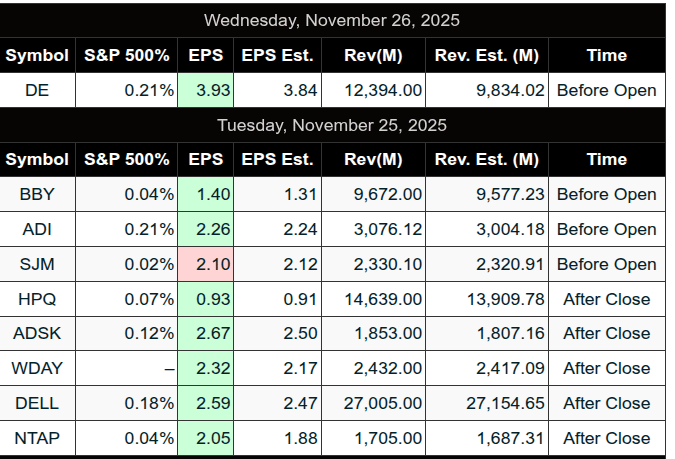
Recent Earnings
Room Summaries:
Affiliate Disclosure: This newsletter may contain affiliate links, which means we may earn a commission if you click through and make a purchase. This comes at no additional cost to you and helps us continue providing valuable content. We only recommend products or services we genuinely believe in. Thank you for your support!
Disclaimer: Charts and analysis are for discussion and education purposes only. I am not a financial advisor, do not give financial advice and am not recommending the buying or selling of any security.
Remember: Not all setups will trigger. Not all setups will be profitable. Not all setups should be taken. These are simply the setups that I have put together for years on my own and what I watch as part of my own “game plan” coming into each day. Good luck!
This post goes out as an email to our subscribers every day and is posted for free here around 2 PM ET. To get your real-time copy, sign up for the free or premium version here: Opening Print Subscribe.
Comments are closed