This post goes out as an email to our subscribers every day and is posted for free here around 2 PM ET. To get your real-time copy, sign up for the free or premium version here: Opening Print Subscribe.
Rate-Cut Roulette: Everyone’s Long and the Tape’s Getting Nervous
Follow @MrTopStep on Twitter and please share if you find our work valuable!
Our View
It’s going to be a busy week, and while some of last week’s numbers met expectations, the September core PCE inflation cooled to 2.8% year-over-year as expected (down from 2.9%). Yet durable goods spending jumped 1.4%, underscoring continued consumer strain from still-elevated prices. The final University of Michigan December Sentiment Index rose more than forecast to 53.3 (from 51.0).
This Tuesday’s rate cut is highly anticipated, but risks of re-accelerating inflation and renewed household affordability are still a huge concern for the public. And Trump has already chosen Kevin Hassett.
I gotta be honest — I was very pointed on the December 2024 rate cut, saying they should not lower rates as inflation was rising. They did lower rates, and by Friday, December 13, the S&P 500 had declined a total of 3.2% from its December 10 close.
Our Lean
I’m not saying the ES can’t go up — it can — but there is some underlying risk.
Will the ES and NQ sell off? I’m not sure. But like I said in this X livestream: everyone has gone from shorting into the hole to going long into the rally.
Even if they sell the rate hike news, I’m still looking for higher prices. But don’t forget — the ES has rallied 380 points in 8 sessions.
I’m going to leave it at that!

The Outlook for Fed Cuts in 2026
The US Federal Reserve is likely to cut rates next week after September’s delayed jobs report showed signs of a weakening labor market. While the outlook for 2026 is less clear, Jan Hatzius, Goldman Sachs Research’s chief economist, expects the Fed to slow the pace of easing in the first half of next year as economic growth reaccelerates and inflation cools.
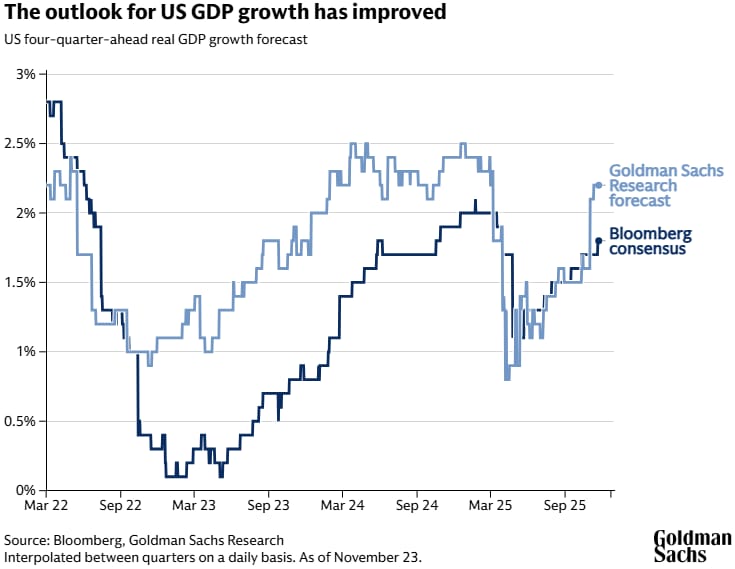
Goldman Sachs Research forecasts US economic growth will accelerate to 2-2.5% in 2026, driven by reduced impacts from tariffs, by tax cuts, and by easier financial conditions. Hatzius expects the Fed to pause its cutting cycle in January before delivering cuts in March and June, pushing the funds rate down to a terminal level of 3-3.25% (compared with 3.75% to 4% currently).
That said, the labor market, especially for college-educated workers—who account for an estimated 55-60% of US labor income—shows signs of weakening, according to Hatzius. “A further deterioration in employment opportunities for this key demographic—perhaps reflecting artificial intelligence (AI) and other efficiency-enhancing measures—could have a disproportionate negative impact on consumer spending and prompt further rate cuts over time.”
Market Recap
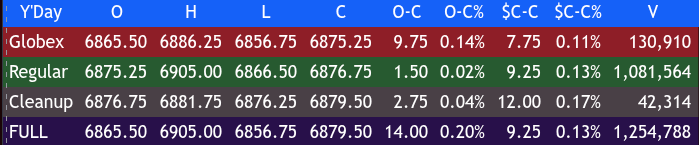
The ES traded up to 6886.25 on Globex and opened Friday’s regular session at 6875.25, up 7.75 points or +0.11%. It dipped slightly to 6874.00, then rallied 31 points up to 6905.00 at 10:30. From there, it sold off 34 points down to 6871.00 at 11:40, rallied up to 6887.25, then sold off again to 6866.26 at 12:35.
The ES bounced to 6888.00 at 1:10, pulled back to 6875.75 at 1:20, and rallied up to 6890.50 at 1:30. It then sold off to 6876.25 at 2:40, rallied again to 6884.75 at 2:55, and sold off once more to 6869.50 at 3:45.
It traded 6871.00 as the 3:50 cash imbalance showed $2.1 billion to sell, dipped to 6866.75, then flipped to a $1.8 billion buy imbalance and traded 6876.75 on the 4:00 cash close. After 4:00, the ES traded up to 6881.75, flatlined, and settled at 6878.25, up 11.5 points or +0.17%.
After 43 days of no economic reports, Friday’s benign inflation data and improving consumer sentiment helped offset pressure from rising bond yields. The Fed’s preferred gauge, September core PCE prices, increased exactly as expected at +0.3% month-over-month and +2.8% year-over-year. Personal income grew more than anticipated at +0.4% m/m, while spending rose in line at +0.3% m/m.
The final University of Michigan December survey added more good news:
-
Consumer sentiment climbed to 53.3, better than the expected 52.0
-
One-year inflation expectations dropped to an 11-month low of 4.1% (vs. 4.5% expected)
-
Five- to ten-year inflation expectations eased to 3.2% (vs. unchanged 3.4% forecast)
Despite the supportive data, equity gains remained modest as the 10-year Treasury yield climbed to a two-week high of 4.14%.
As of the close, the CME FedWatch tool showed an 87% chance that the U.S. Federal Reserve will deliver an interest rate cut next week, with further cuts expected in 2026.
In the end, it was a data-filled day that supported the ES and NQ back to where they were on 11/12/25.
In terms of the ES’s overall tone, the markets were firm but whippy. In terms of the ES’s overall trade, total volume was 1.266 million contracts, the lowest for a full session since 10/24/25.
MiM
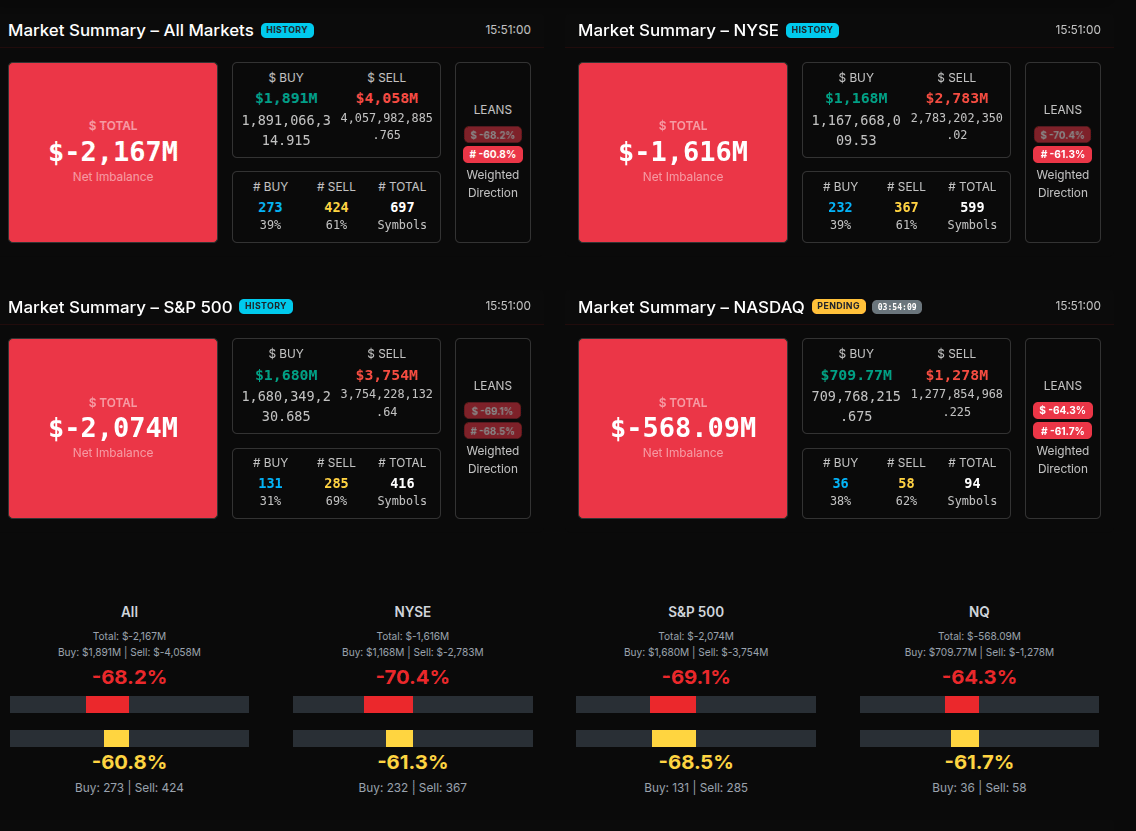
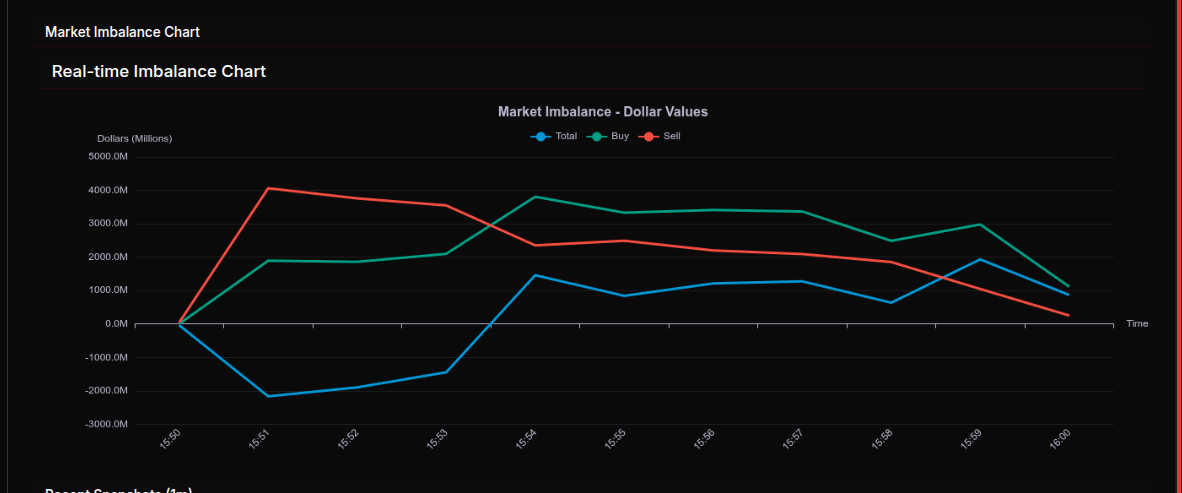
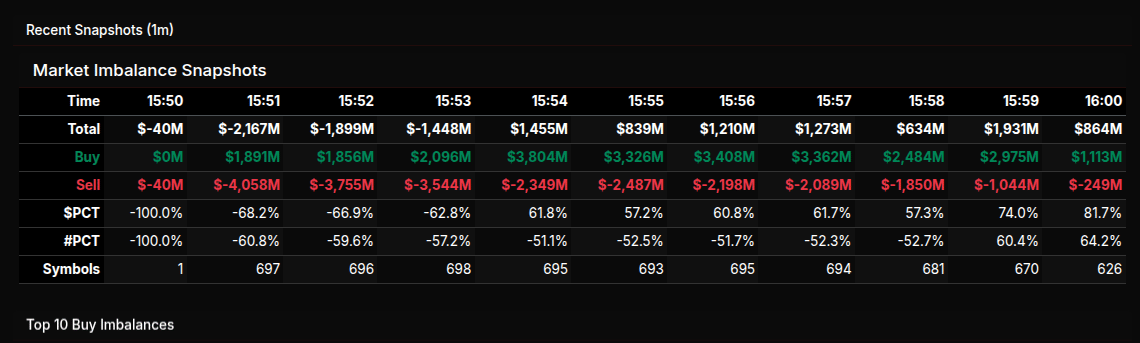
The MOC auction opened at 15:51 with a sharp $2.17B sell imbalance, driven by $1.89B buy vs. $4.06B sell, leaving the tape leaning –68% on a weighted basis. Symbol breadth confirmed the pressure early: 424 sell symbols vs. 273 buy, a configuration that held consistently through the close even as dollar flows moderated.
Through 15:52–15:54, the imbalance remained materially negative, oscillating between –$1.9B and –$1.4B, but the composition shifted. Buy interest expanded to as much as $3.8B at 15:54, yet sell programs still exceeded them until late. This was a rotational phase, with % leans improving from –66.9% → –51.1%, signaling less of a wholesale liquidation and more back-and-forth program activity.
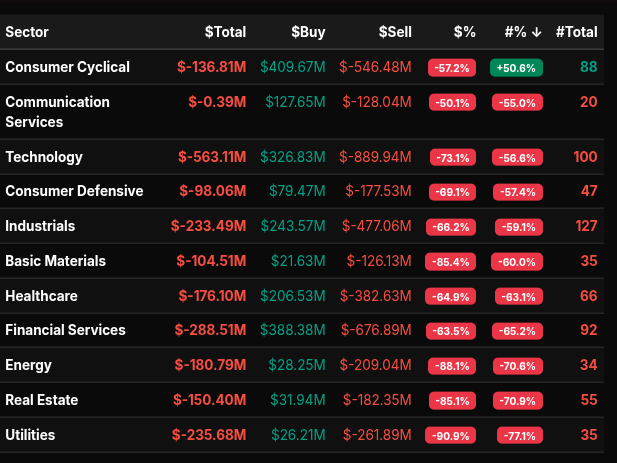
Sector data clarified where supply was concentrated. Utilities (–90.9%), Real Estate (–85.1%), Basic Materials (–85.4%), and Energy (–81.8%) were deep-lean sectors and clear sources of sell pressure. Technology (–73.1%), Industrials (–66.2%), and Healthcare (–64.9%) added meaningful distribution. The only sector showing relative resilience was Consumer Cyclical, which, despite a –57.2% dollar lean, carried a slight +50.6% symbol lean, indicating a rotational rather than directional unwind.
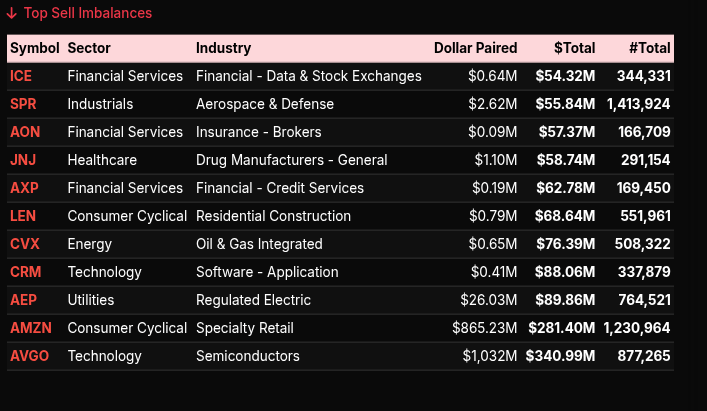
Individual names confirmed the sell-dominant character. Heavy sell imbalances appeared in AVGO ($341M), AMZN ($281M), CVX, AXP, AON, and ICE. These were broad-based across Tech, Energy, Financials, and Industrials—another sign of multi-sector distribution rather than a single-theme unwind.
On the buy side, leadership was narrower. WRB ($246M), TSLA ($191M), GOOG, APH, and BKNG were the largest bidders, but with fewer symbols participating (only 36–38 buy symbols in NASDAQ vs. 58–62 sellers).
Into 15:59–16:00, the imbalance faded toward –$864M, but the lean flipped deeper negative again (to –81.7%), indicating sellers maintained control into the auction print.
Overall: broad selling, sector-wide distribution, persistent negative leans, and limited buy-side leadership defined the close.

Technical Edge
Fair Values for December 8, 2025:
-
SP: 7.64
-
NQ: 32.24
-
Dow: 49.87
Daily Breadth Data 📊
For Friday, December 5, 2025
• NYSE Breadth: 44% Upside Volume
• Nasdaq Breadth: 51% Upside Volume
• Total Breadth: 50% Upside Volume
• NYSE Advance/Decline: 47% Advance
• Nasdaq Advance/Decline: 45% Advance
• Total Advance/Decline: 46% Advance
• NYSE New Highs/New Lows: 134 / 33
• Nasdaq New Highs/New Lows: 233 / 67
• NYSE TRIN: 1.18
• Nasdaq TRIN: 0.76
Weekly Breadth Data 📈
For Week Ending December 5, 2025
• NYSE Breadth: 51% Upside Volume
• Nasdaq Breadth: 54% Upside Volume
• Total Breadth: 52% Upside Volume
• NYSE Advance/Decline: 48% Advance
• Nasdaq Advance/Decline: 52% Advance
• Total Advance/Decline: 51% Advance
• NYSE New Highs/New Lows: 273 / 72
• Nasdaq New Highs/New Lows: 441 / 297
• NYSE TRIN: 0.90
• Nasdaq TRIN: 0.93
Today’s BTS Levels:
ES Z
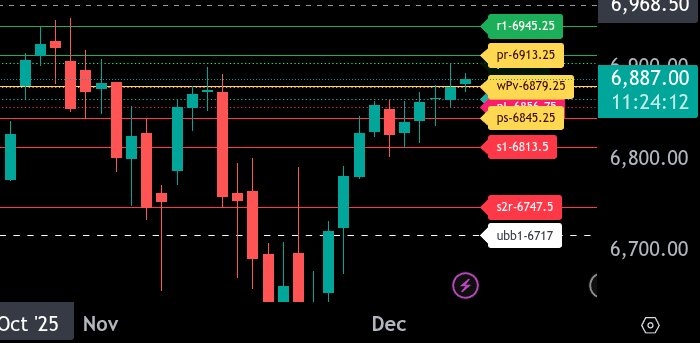
The bull/bear line for the ES is at 6879.25. ES is currently trading near 6888.00 in Globex, indicating trade above the bull/bear line. Holding over 6879.25 keeps the tone constructive.
The upper intraday range target is 6913.25. If ES can push through 6905 and sustain, 6913.25 becomes the next upside magnet, followed by 6945.25 as higher resistance.
The lower intraday range target is 6845.25. Loss of 6879.25 opens the door to 6865.50 and then 6856.75. A break of 6856.75 increases the odds of testing 6845.25.
Key resistance levels: 6905, 6913.25, 6945.25.
Key support levels: 6879.25, 6865.50, 6856.75, 6845.25.
Overall, ES remains firm above 6879.25. A sustained hold over the bull/bear line favors attempts toward 6905 and 6913.25. A failure back below shifts focus to 6865.50 and 6845.25.
NQ Z
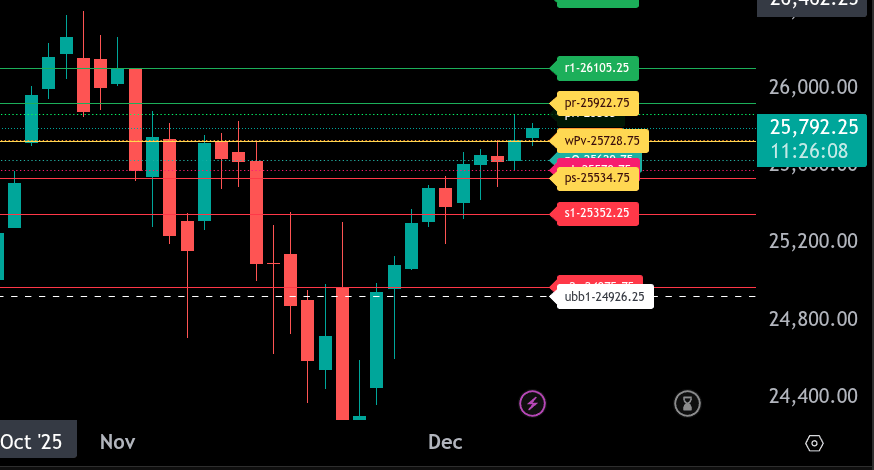
The bull/bear line for the NQ is at 25,728.75. Trading is currently above this level, indicating early bullish control as long as price holds above it.
The upper intraday range target is 25,922.75. If buyers continue to defend above the bull/bear line and push through 25,868.00, momentum can build toward this target.
The lower intraday range target is 25,534.75. A failure back below 25,728.75 would open the door for sellers to press into 25,579.75 and 25,534.75, where responsive buyers may attempt to stabilize.
Immediate resistance sits at 25,868.00 and then 25,922.75. Sustained acceptance above these levels strengthens the bullish structure.
Support shows first at 25,629.75, followed by 25,579.75, then the lower band at 25,534.75. Below that, 25,352.25 and 24,975.75 become the next downside magnets if sellers take control.
Overall, holding above 25,728.75 favors attempts higher toward 25,922.75. Losing that level shifts control back to sellers with 25,534.75 as the key downside target..
Calendars
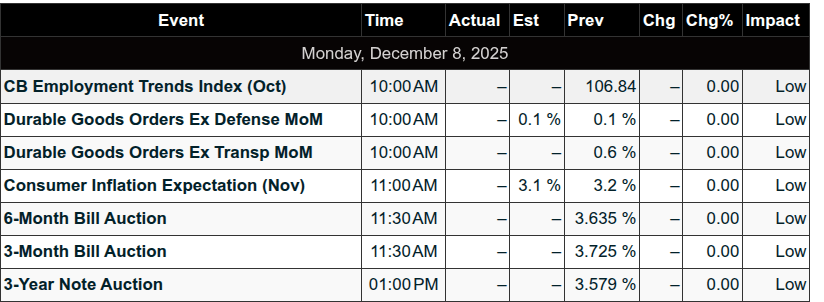
Today’s Economic Calendar
This Week’s Important Economic Events

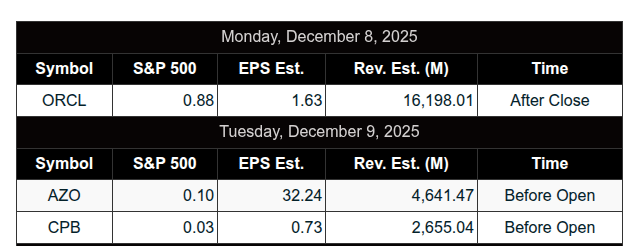
Upcoming Earnings
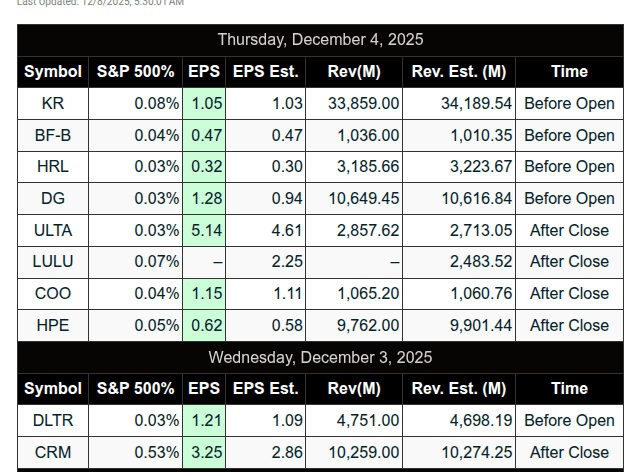
Recent Earnings
Room Summaries:
Polaris Trading Group Summary – Friday, December 5, 2025
Friday’s trading session in the Polaris Trading Group room was a classic example of a day with early potential that faded into midday chop and consolidation, ultimately turning into a battle for balance. PTGDavid emphasized capital preservation while highlighting trade setups, key levels, and rhythmic transitions throughout the day. There were a few solid opportunities for both bulls and bears, though the overall tone was cautious heading into the weekend.
Key Themes and Highlights:
Morning Setup & Strategy
-
The overnight session was bullish, fulfilling the initial target zone laid out in the DTS Briefing.
-
Bull scenario: A hold above 6865 would target the 6880–6895 zone.
-
Early lean was to buy dips, with an initial sandbox (balance range) identified between 6875–6885.
-
Economic data (PCE and UMich) came in exactly as expected, clearing the way for bullish continuation.
Trade Opportunities & Market Action
Morning Action (9:30 AM – 10:30 AM):
-
Market rhythm transitioned into an up grinder post-economic data.
-
David issued a bullish mission briefing, encouraging traders to target the ignition belt at 6865–6880.
-
Short-term longs were favored early as price reclaimed the ignition zone.
-
“Capital Preservation Fryday” mood set in, but with potential fireworks hinted for the close.
Midday Shifts (10:30 AM – 1:00 PM):
-
Price consolidated and lost upward momentum.
-
Bulls lost control, and Bo was noted for crushing it—likely catching a solid short.
-
David called out an A4 short trade setup, which ran the stops, confirming bear momentum.
-
Bears gained control, with David marking 6865 as the new LIS (Line in Sand).
-
VWAP back-test (85–87) gave another solid A10 short opportunity, reinforcing bear dominance.
Afternoon Grind (1:00 PM – Close):
-
Price chopped in a balance zone between 6870–6890, with 6880 as midpoint.
-
Afternoon was quiet with “no real edge,” leading David to jokingly call for burgers and beers.
-
Final hour brought MOC (Market on Close) imbalance volatility:
-
Initially a $2.1B sell imbalance
-
Flipped to a $1.8B buy imbalance—another example of typical MOC “trickery”
-
Traders called out the unreliable data feed with light-hearted frustration
-
Lessons & Takeaways
-
Patience pays: Early bullish setups played out, but traders who waited for confirmation of rhythm shifts had better entries, particularly on shorts.
-
Adapt to rhythm: Transition from bullish grind to consolidation to bearish control was a textbook day for rhythm recognition.
-
VWAP tags + structure held up well as useful reference zones for entries (e.g., VWAP back-test led to solid short).
-
Capital preservation mindset helped traders navigate a choppy midday and avoid overtrading.
-
End-of-day imbalances remain volatile and unreliable—treat them with caution.
Positive Trade Calls
-
Early long dips above 6865 into ignition zone worked well
-
A4 and A10 short setups were clearly called and played out profitably
-
VWAP back test short was a strong afternoon scalp opportunity
Closing Vibe:
While Friday didn’t offer fireworks into the close, the session rewarded disciplined traders who followed the rhythm shifts and managed risk. It was a Fryday of balance, deception (thanks to the MOC), and a reminder that sometimes the best trade is to preserve capital and plan for the next battle.
DTG Room Preview – Monday, December 8, 2025
-
Fed Week & Macro Focus
-
Markets expect an 87% chance of a 25bps Fed rate cut on Wednesday.
-
Key focus: Powell’s press conference and year-end “dot plot” projections.
-
Last meeting for current Fed voters (Boston, Chicago, St. Louis, Kansas City); new voters from Cleveland, Minneapolis, Dallas, and Philly rotate in.
-
Bond market uneasy — 10Y yield jumped 10bps last week, reflecting inflation concerns limiting aggressive cuts.
-
Fed chair replacement speculation continues into 2026.
Economic Calendar & Earnings
-
Tuesday: November + delayed September JOLTS job openings.
-
Last week’s data: ADP & Challenger showed job losses; PCE showed inflation moderation — boosting rate cut hopes.
-
Earnings highlights this week: ORCL, ADBE, AVGO, COST.
-
Today: TOL reports after the bell; ASO & AZO report Tuesday morning.
-
Today’s calendar is light; volatility still moderate but could rise post-Fed.
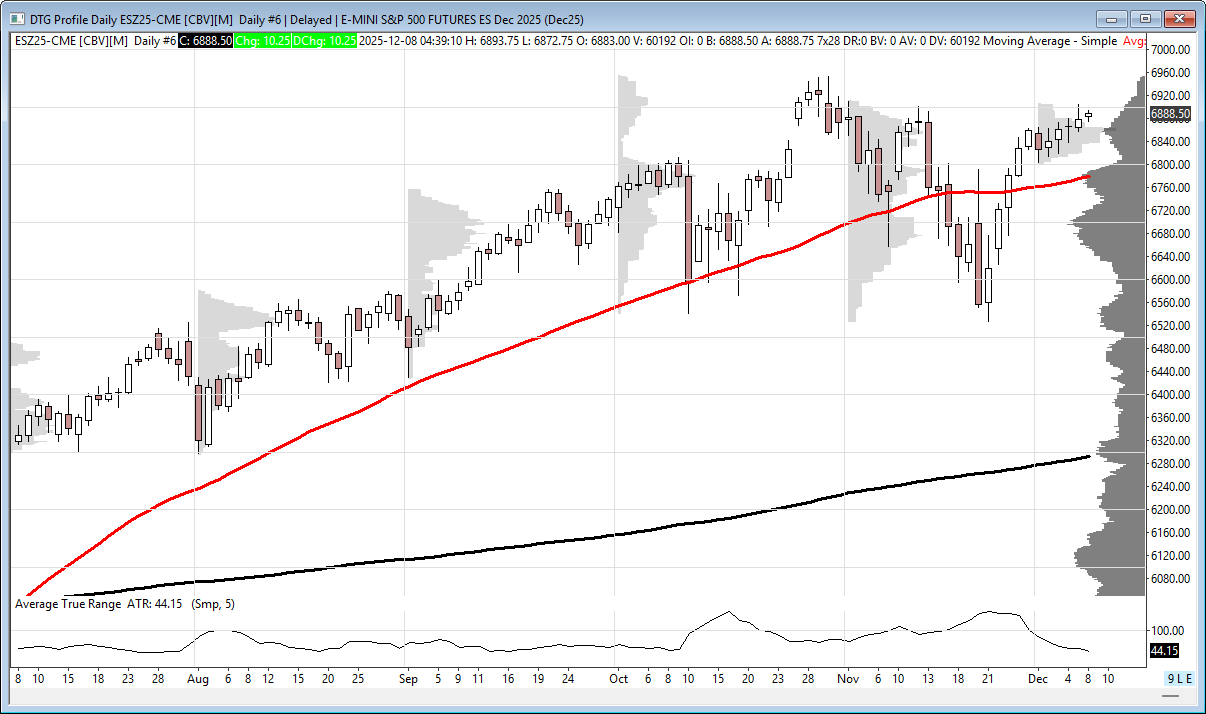
ES Technical Levels
-
ES grinding higher; 5-day ADR: 52.5 pts.
-
Holding above former short-term channel top (6768/63s) and 50-day MA (6779.25).
-
Bulls and bears have room to work technically.
Key Technical Levels
-
Resistance: 7265/70s, 7400/05s
-
Support: 6768/63s, 6598/03s, 6453/48s

-
Affiliate Disclosure: This newsletter may contain affiliate links, which means we may earn a commission if you click through and make a purchase. This comes at no additional cost to you and helps us continue providing valuable content. We only recommend products or services we genuinely believe in. Thank you for your support!
Disclaimer: Charts and analysis are for discussion and education purposes only. I am not a financial advisor, do not give financial advice and am not recommending the buying or selling of any security.
Remember: Not all setups will trigger. Not all setups will be profitable. Not all setups should be taken. These are simply the setups that I have put together for years on my own and what I watch as part of my own “game plan” coming into each day. Good luck!
This post goes out as an email to our subscribers every day and is posted for free here around 2 PM ET. To get your real-time copy, sign up for the free or premium version here: Opening Print Subscribe.
Comments are closed