This post goes out as an email to our subscribers every day and is posted for free here around 2 PM ET. To get your real-time copy, sign up for the free or premium version here: Opening Print Subscribe.
Market Bubble?
Follow @MrTopStep on Twitter and please share if you find our work valuable!
Our View
I remember when I worked in the Chicago Board of Trade’s bond pit, taking orders from two very large traders.
One was Rick Barns, a former trader from C&D. Rick was a desktop trader who, at any time, would have positions in 10 to 15 different markets. His position size was 3k to 5k bonds, and he would hold 25k to 30k bond options. I took those orders for two years straight.
The other trader was Gary Bielfeldt from BL&H. Every order I took for him was a 500-lot or a 1,000-lot. He would ring the direct line and put in scaled bids and offers. He also owned the Bank of Peoria, and that’s where I started to learn about the Treasury auctions, because on those days, trading was huge.
Back then, I believe the auctions started at 11:00 am CT, and I would be on the phone until 2:00, when the bonds closed. I remember Gary explaining that the big banks, hedge funds, pension and mutual funds, and foreign central banks were the buyers — and that’s how the government finances its operations.
He was a total nerd, but I knew he was a very smart guy. But as I’ve always said, these are not our father’s markets or charts!
The drop in foreign official demand, coupled with growing U.S. debt, means domestic sources and private investors must pick up the slack—often requiring the U.S. Treasury to offer higher interest rates to attract sufficient capital.
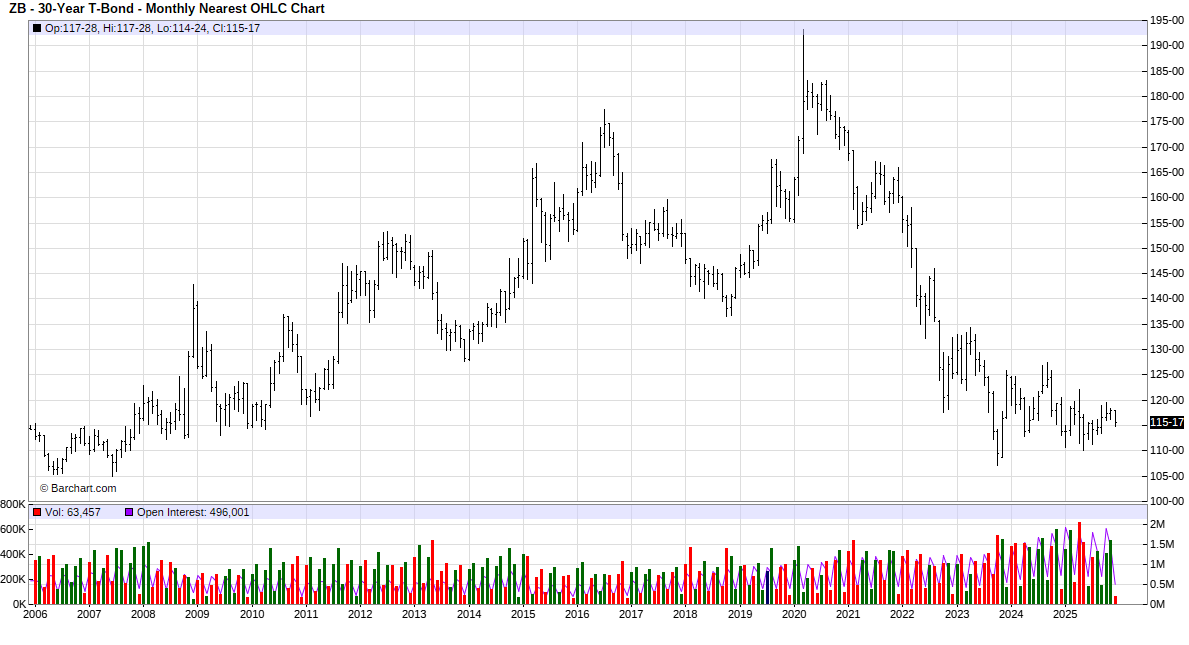
After U.S. Debt Soars to $38 Trillion, the ‘Easy Times’ Are Over as Hedge Funds Jump Into the Bond Market, Former Treasury Official Warns
This text outlines a warning from former Treasury official Geng Ngarmboonanant that U.S. lenders will no longer accept “financial engineering” or empty promises; they now demand a credible plan to control the national debt.
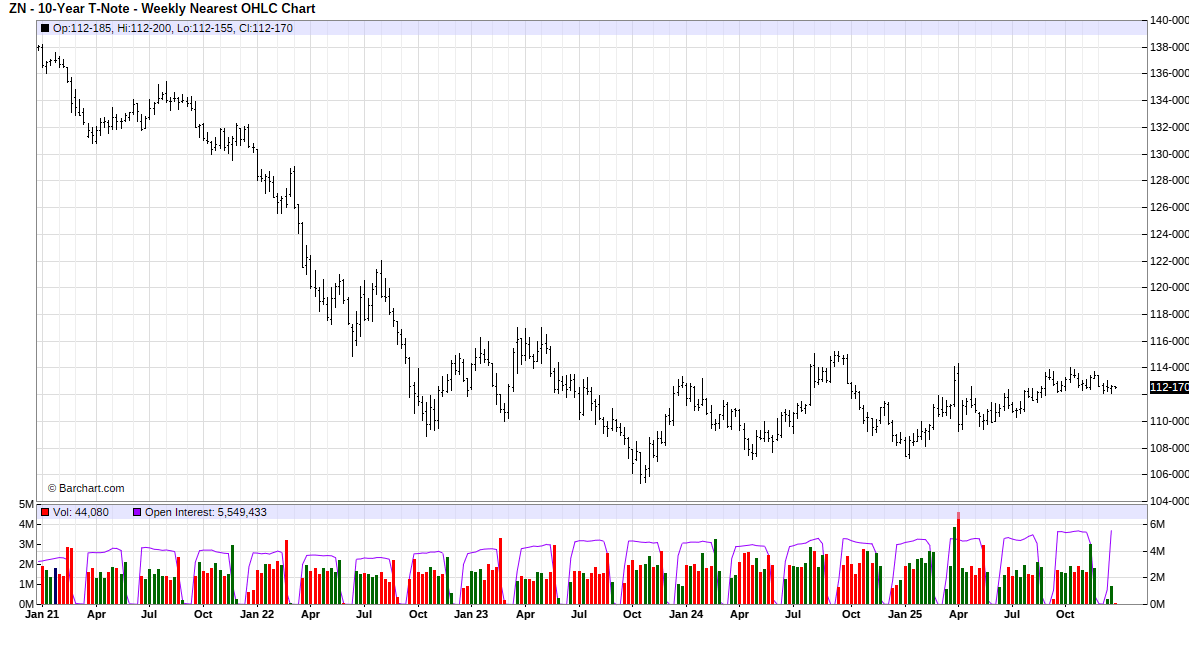
To illustrate the market’s power to enforce this discipline, the author cites the resurgence of “bond vigilantes”—investors who sell off government debt to punish fiscal irresponsibility. This dynamic was proven recently in April 2025, when a sharp bond market selloff forced President Trump to retreat from his aggressive “Liberation Day” tariff proposals, prompting economist Nouriel Roubini to label these investors “the most powerful people in the world.”
Bond Vigilantes
A term coined by economist Ed Yardeni in the 1980s. It refers to bond market investors who protest monetary or fiscal policies they view as inflationary (such as high deficits) by selling bonds. This drives up interest rates and forces the government to change course.
The Warning
Geng Ngarmboonanant (JPMorgan executive and former Treasury official) predicts that without genuine deficit restraint, the U.S. risks losing the confidence of lenders who have historically financed its debt.
The Verdict
Economist Nouriel Roubini observed that the market’s ability to “box in” the President proves that bond traders ultimately hold more power over the economy than political leaders.
Case Study: The April 2025 Reversal
Early April 2025
The Trigger: President Trump unveils aggressive new global tariffs (referred to as “Liberation Day” tariffs). The announcement stuns investors and raises fears of inflation.
April 3–8, 2025
The Market Riot: Bond investors react negatively, selling off Treasuries. Yields spike significantly, signaling that the market is unwilling to finance the policy. Stocks plunge.
April 9, 2025
The Retreat: Acknowledging that the market was “queasy,” Trump pauses the tariffs. This proves the “vigilante” theory: market pressure successfully forced a policy U-turn.
Our Lean
I am still long and added to my ES position on Friday. I still think the ES can take out its 7014.00 high, but unlike Rich, I think the possibility of ES 7100 is slim.
Recently, the price action has been to sell off on Globex, then rally before the open and again after. If that happens, I plan on getting out of half my position and trying to ride it out into Tuesday.
According to the Stock Trader’s Almanac, the last trading day of December 2026 has the Nasdaq down 18 of the last 24 occasions, and the first trading day of January (Friday) has the Nasdaq up 18 of the last 27 occasions.
Our lean: I am going to try to hold on and stick with my longs today and hold into Tuesday. If the ES closes higher today and Tuesday, I’ll put in a stop and try to hold into Friday.
With gold and silver going through the roof, I asked Rich from @HandelStats to do a study, and he titled it “Market Bubble.”
Market Bubble – Rich Miller Handelstats.com
Does This Market Really Look Like a Bubble?
How about this Market?
There has been no shortage of commentary lately calling the equity market a “bubble.”
New highs, concentration in mega-cap stocks, and decades-high index levels all make for easy headlines.
But headline price levels alone are a poor judge of bubbles.
To understand whether markets are truly in speculative excess, we need to step outside nominal dollars and ask a more important question:
How does the S&P 500 look when measured against real money?
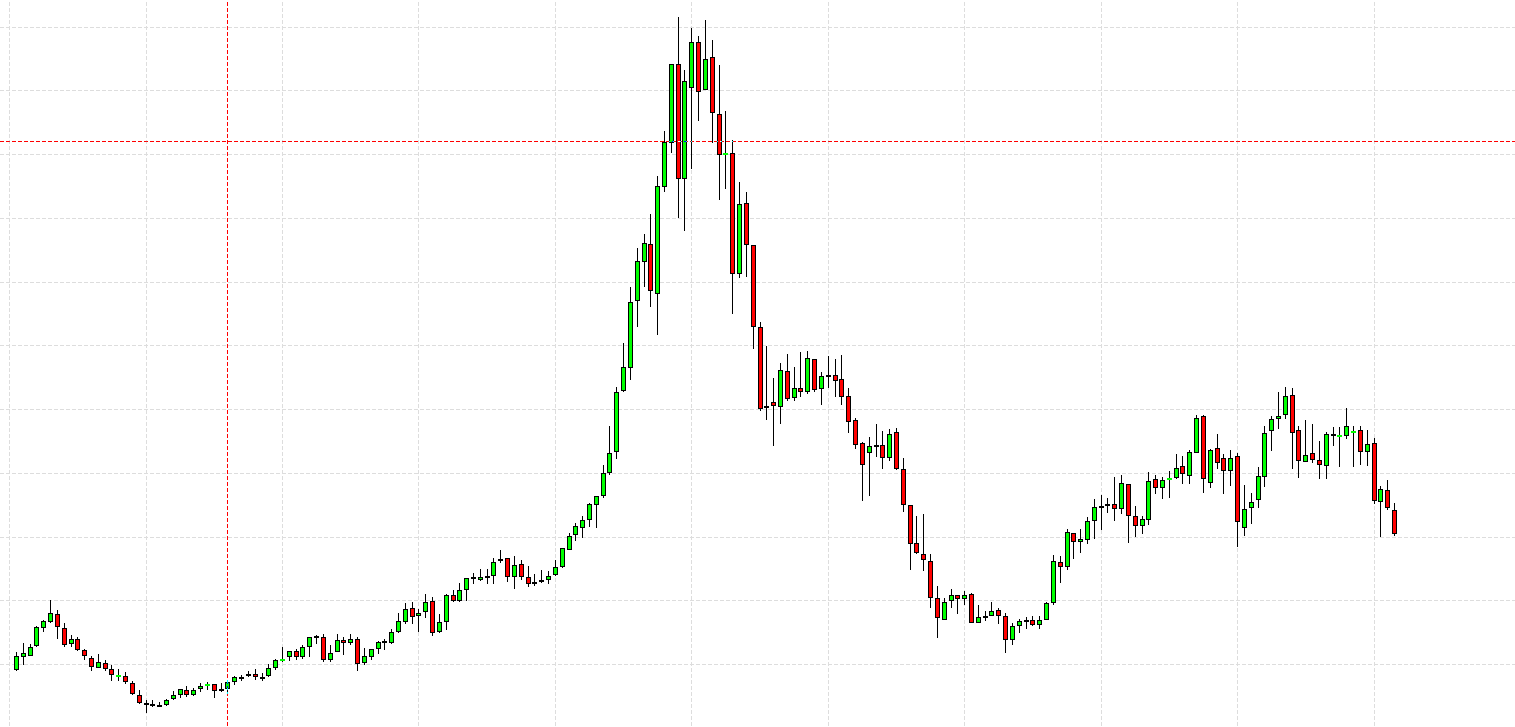
The S&P 500 Priced in Gold:
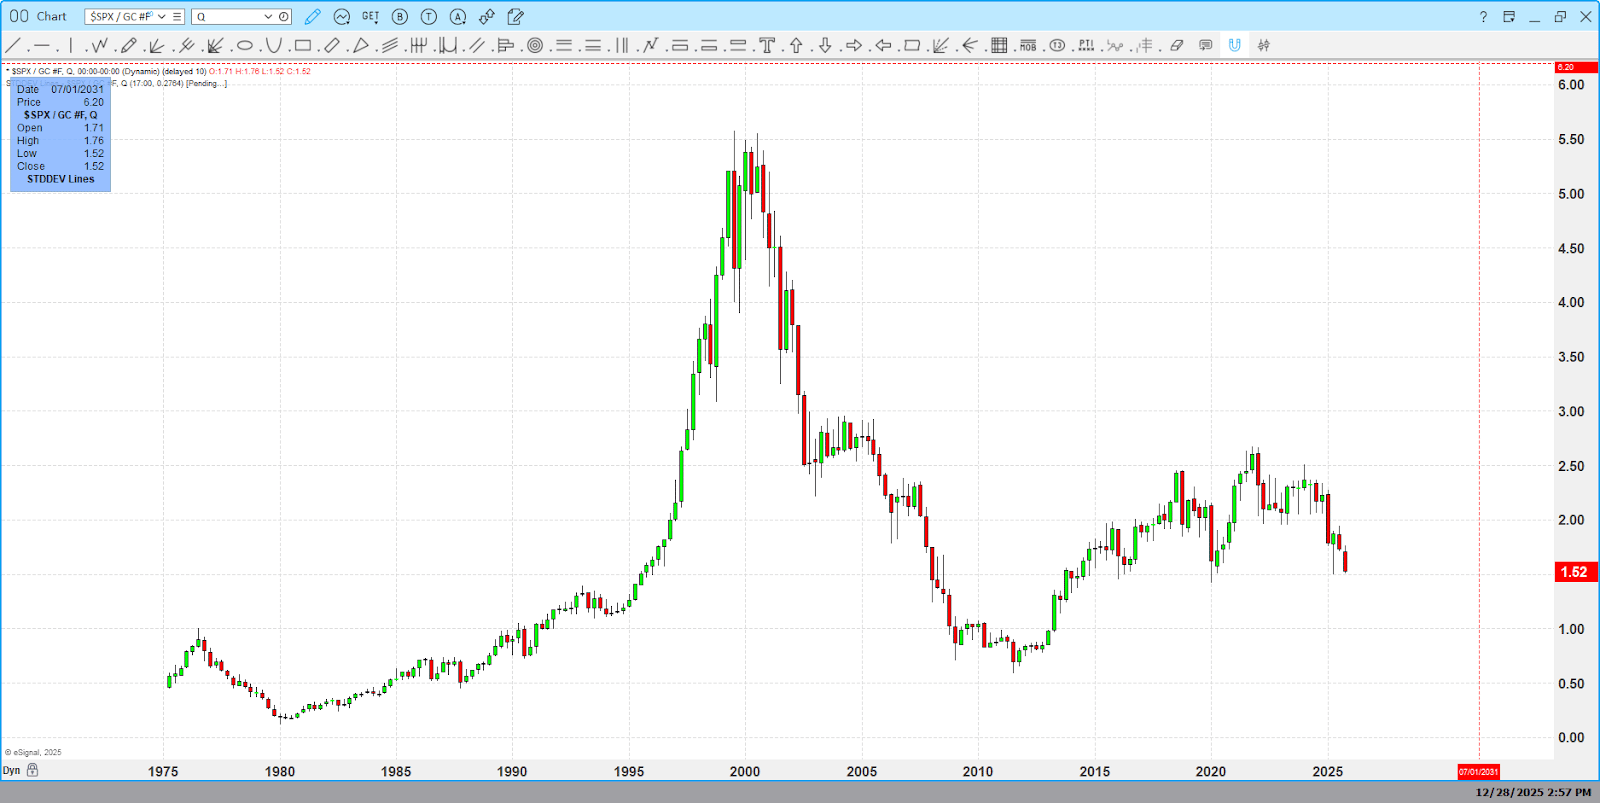
$SPX / GC
When we divide the S&P 500 by gold, we are no longer looking at equity prices — we are measuring purchasing power.
This ratio answers a simple but powerful question:
How many ounces of gold does it take to “buy” the S&P 500?
On this chart, one peak dominates everything else:
1999–2000.
That was the true equity bubble — not just in price, but in real value. Stocks massively outperformed hard assets, valuations detached from fundamentals, and time confirmed the excess.
Today, despite historically high nominal index levels, the S&P priced in gold remains well below those extremes. There is no breakout, no vertical acceleration, and no sign of the kind of real-value distortion that defines a true bubble.
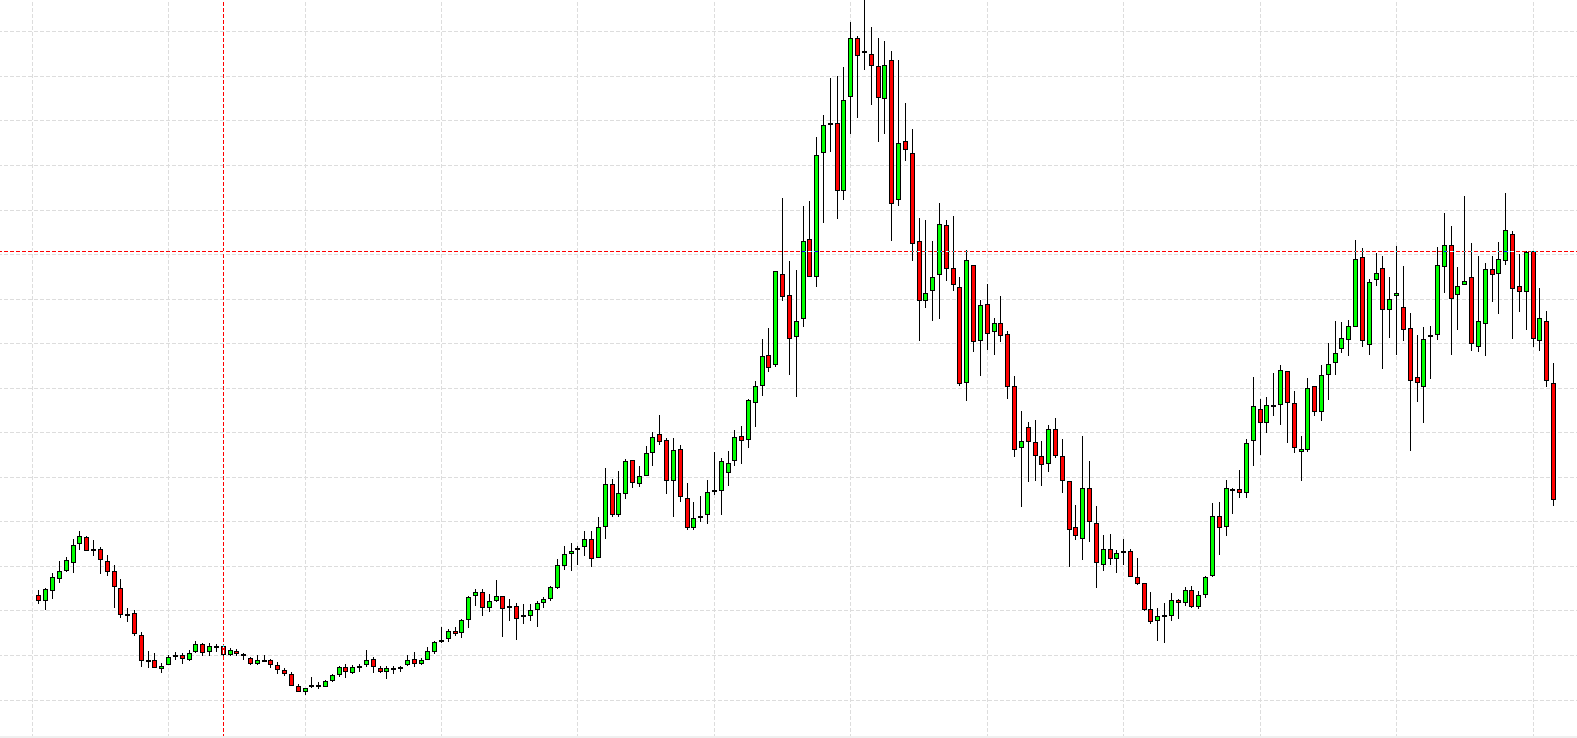
The S&P 500 Priced in Silver:
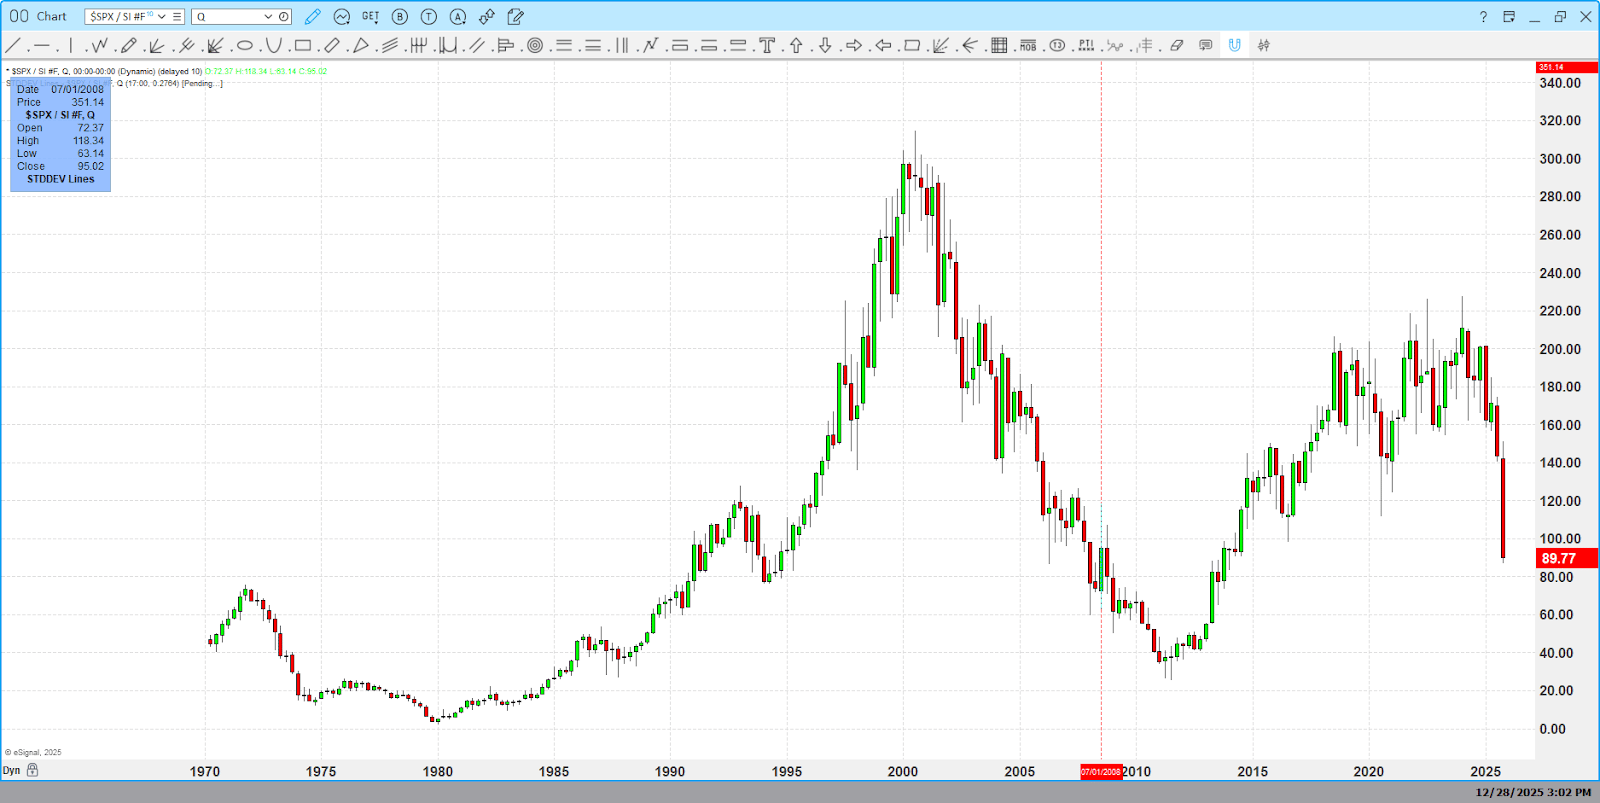
$SPX / SI
Silver adds another layer of insight.
Unlike gold, silver is:
-
More volatile
-
More speculative
-
More sensitive to late-cycle inflation and excess
Historically, silver tends to outperform during periods of monetary distortion and speculative enthusiasm.
Yet when we price the S&P 500 in silver, the picture is strikingly similar:
-
A clear, historic peak around 2000
-
A violent unwinding of excess
-
A long basing and recovery process
-
No modern breakout to bubble-level extremes
Once again, equities have not regained prior real-asset highs, even after years of strong nominal performance.
The Key Takeaway
If this were a true structural equity bubble, we would expect to see:
-
New highs in SPX / Gold
-
New highs in SPX / Silver
-
Sustained acceleration relative to real assets
None of those conditions are present.
Instead, what we see is something very different:
-
Nominal prices are high
-
Real purchasing power is not
-
Time has capped excess rather than confirmed it
This is not the signature of a speculative bubble.
It is the signature of an inflationary, monetary cycle — one where price rises reflect currency dynamics as much as equity enthusiasm.
Why Time Still Matters Most
At HandelStats, our work has always emphasized one core principle:
Price alone does not define excess.
Time validates or rejects it.
The 2000 bubble wasn’t obvious because prices were high — it was obvious because time failed to support the move.
Today, time is telling a very different story.
Markets may be late-cycle. They may be volatile. They may even correct sharply.
But based on real-asset comparisons, this is not a repeat of prior bubble regimes.
Bottom line:
Before labeling markets a bubble, always ask:
“Bubble relative to what?”
When measured against gold and silver — the answer, for now, is clear.
An Overview
Asset Prices and Inflation
Asset prices such as stocks generally rise in response to inflation. When inflation is low, its effect on asset prices is minimal and often negligible. However, in the current environment, inflation is much higher than officially reported, and this elevated level is expected to persist at a high single-digit rate.
Government Debt and Inflation
The federal government faces significant challenges in managing its debt. It is unable to raise taxes sufficiently to pay down this debt, nor will it enact spending cuts substantial enough to reduce it. As a result, the government relies on inflation as a tool to address the debt burden.
Inflation serves as a hidden tax on the holders of government debt. When debt is repaid, it is done so with currency that has diminished purchasing power due to inflation. This process occurs because the currency is essentially created out of thin air.
The Role of the Federal Reserve
The actual creation of currency is carried out by the Federal Reserve, which is a private institution empowered by the Federal Reserve Act of 1913. This mechanism allows for the expansion of the money supply, contributing to the ongoing inflationary environment. While these concepts may be familiar to some, they are important to reiterate for those who are less acquainted with the details. There are further complexities involved, but a deeper exploration is not necessary here. Handelstats
Market Recap

The ES traded down to 6974.00 on Globex, rallied up to 6978.75 at 12:30, and opened Friday’s regular session at 6983.50. It traded 6979.25, made a regular trading hours (RTH) high at 6994.00 at 9:45, then sold off down to 6973.00 at 10:15.
It rallied up to a lower high at 6986.75, back-and-filled just above and below the VWAP at 6983.00, then traded down to 6970.50 at 12:20. It traded back up to 6978.75 at 12:30, pulled back to a higher low at 6971.50 at 12:35, then traded up to 6977.25, and sold back off down to a new low of 6969.00 at 1:20, with total volume of 388k contracts traded.
After the low, the ES traded up to 6981.25 at 2:10, pulled back to 6976.25 over the next 90 minutes.
IMPRO: Dboy (3:35:08 PM): “Some bids showing up.”
The ES traded up to 6981.75, then 6980.00 as the 3:50 cash imbalance showed $900 million to sell, pulled back to 6977.00, traded up to 6981.25, and then 6980.00 on the 4:00 cash close. It settled at 6979.25, down 3.25 points or -0.05%.
The NQ settled at 25,863.25, down 17.25 points or -0.07%, with both the ES and NQ breaking their 5-day winning streaks.
In the end, I figured with all the flights canceled that it would be slower than usual—and that was spot on. In terms of the ES’s overall tone, a little weakness in the tech / AI sectors pulled the NQ down, taking the ES for a small ride lower. In terms of the ES’s overall trade, volume was low at 591k contracts traded.
Friday’s big question was whether the ES and NQ could get six higher closes in a row. They didn’t — but the closes were fractionally lower. In all honesty, there was a total lack of both buyers and sellers.
On Tap
-
Monday (Full session):
-
10:00 – Pending Home Sales
-
-
Tuesday (Full session):
-
9:00 – S&P Case-Shiller Home Price Index
-
9:45 – Chicago Business Barometer (PMI)
-
2:00 – Minutes of Fed’s December FOMC meeting
-
-
Wednesday (Full session):
-
8:30 – Initial Jobless Claims
-
-
Thursday:
-
New Year’s Day – CLOSED
-
-
Friday:
-
None scheduled
-
MiM
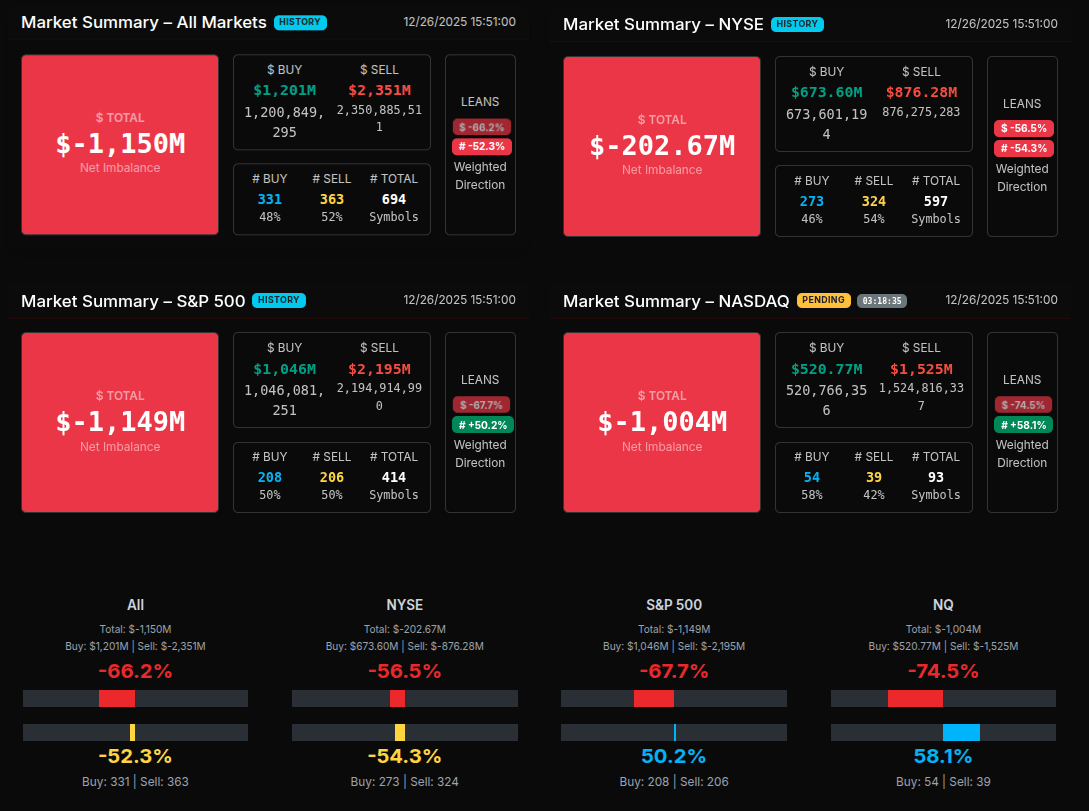
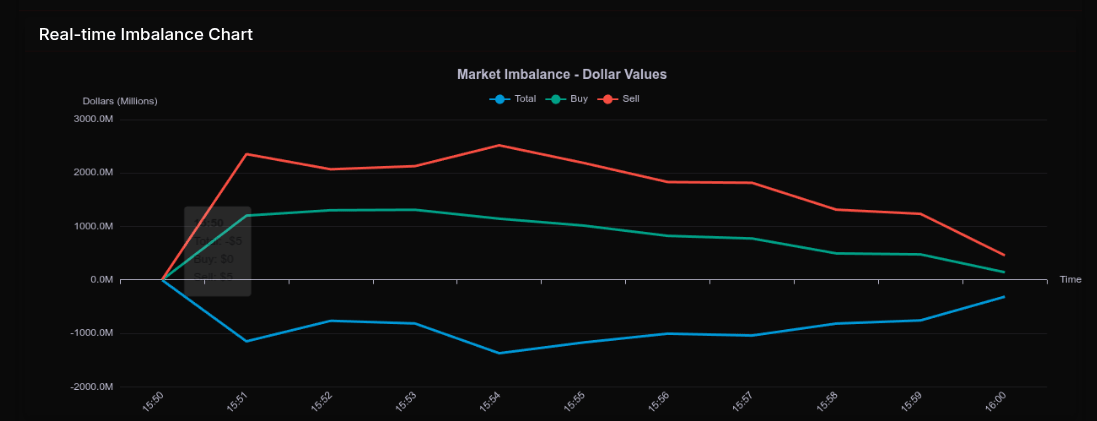
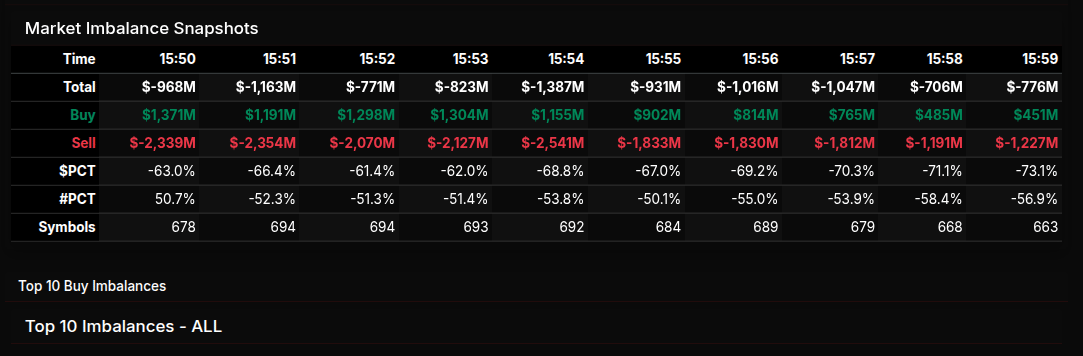
The Market-on-Close auction opened with a clear sell-side bias and never truly escaped it, even as brief stabilization attempts appeared late in the session. From the 15:50 snapshot onward, total imbalance consistently remained negative, with net sell pressure deepening into the final minutes. By 15:59, total imbalance sat near -$776M, capping a session defined by persistent institutional selling rather than a last-minute scramble to rebalance.
What stood out immediately was the wholesale nature of the selling. Aggregate dollar leans pushed well beyond the -66% threshold for much of the auction, confirming this was not a rotational tape but a broad, program-driven unload. The overall market lean finished near -66%, with the S&P 500 around -67.7% and Nasdaq stretching to an extreme -74.5%, signaling decisive sell dominance rather than two-way trade.
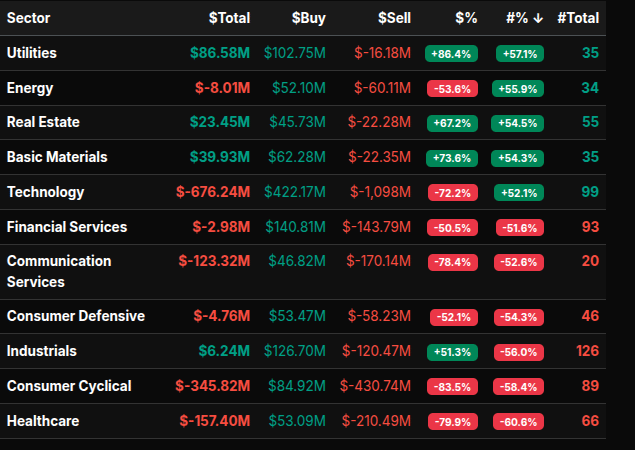
Sector flows reinforced that theme. Technology bore the brunt, posting a massive -$676M net imbalance with a -72% lean, driven by heavy sell programs in large-cap leaders. Communication Services followed with a steep -78% lean, while Consumer Cyclical and Healthcare also registered deeply negative, non-rotational readings. These were not isolated adjustments but coordinated pressure across growth and discretionary exposure.
In contrast, Utilities, Real Estate, and Basic Materials were notable exceptions. Utilities finished with an +86% buy lean, Real Estate at +67%, and Basic Materials at +73%, all indicative of defensive and inflation-hedge positioning. These pockets of strength, however, were insufficient to offset the dominant sell programs elsewhere.
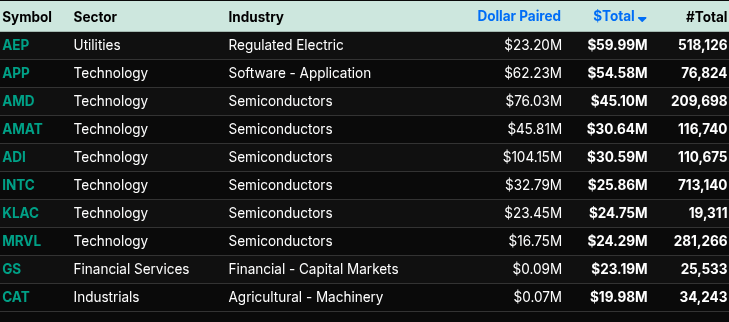
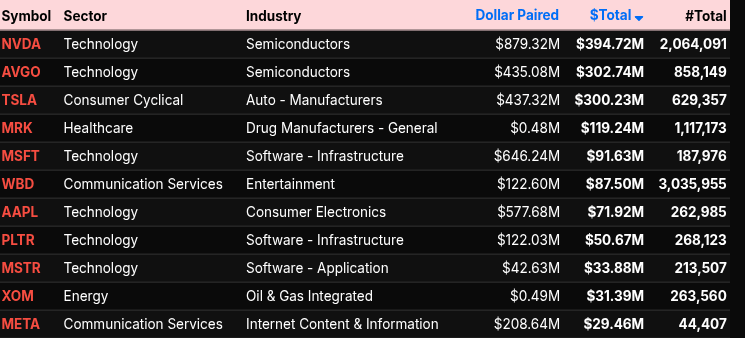
Single-stock activity highlighted the imbalance concentration. NVDA, AVGO, TSLA, and MSFT all appeared among the largest dollar-paired names, underscoring that mega-cap liquidity was the primary source of sell pressure. While a few industrial and utility names attracted bids, the flow profile confirmed that institutions were reducing risk into the close.
In sum, the MOC session was defined by broad, decisive selling rather than rotation. Extreme negative leans, especially in Nasdaq and Technology, point to wholesale risk-off behavior, with only limited defensive buying offering resistance as the auction concluded.
Technical Edge
Fair Values for December 29, 2025
-
SP: 47.03
-
NQ: 203.21
-
Dow: 270.46
Daily Breadth Data 📊
For Friday, December 26, 2025
-
NYSE Breadth: 50.9% Upside Volume
-
Nasdaq Breadth: 41.2% Upside Volume
-
Total Breadth: 42.2% Upside Volume
-
NYSE Advance/Decline: 51.9% Advance
-
Nasdaq Advance/Decline: 43.8% Advance
-
Total Advance/Decline: 46.8% Advance
-
NYSE New Highs/New Lows: 99 / 22
-
Nasdaq New Highs/New Lows: 154 / 199
-
NYSE TRIN: 0.97
-
Nasdaq TRIN: 1.09
Weekly Breadth Data 📈
For Week Ending December 26, 2025
-
NYSE Breadth: 58.0% Upside Volume
-
Nasdaq Breadth: 50.3% Upside Volume
-
Total Breadth: 53.0% Upside Volume
-
NYSE Advance/Decline: 59.2% Advance
-
Nasdaq Advance/Decline: 52.4% Advance
-
Total Advance/Decline: 54.9% Advance
-
NYSE New Highs/New Lows: 232 / 82
-
Nasdaq New Highs/New Lows: 350 / 413
-
NYSE TRIN: 1.00
-
Nasdaq TRIN: 1.05
Today’s BTS Levels:
ES H
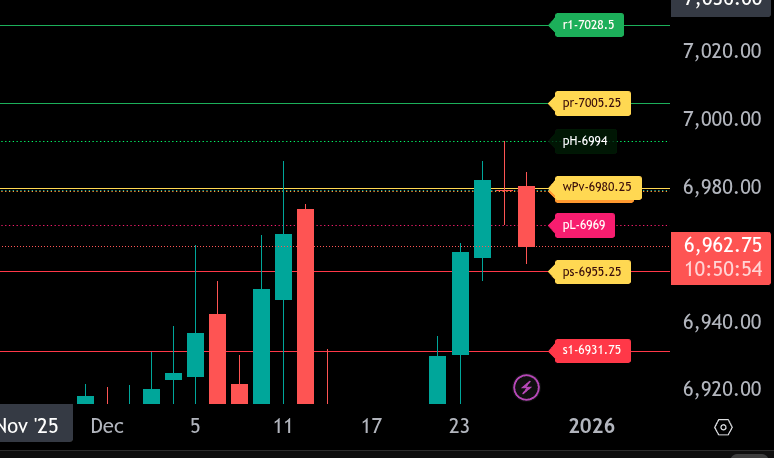
The bull/bear line for the ES is at 6980.25. This is the key pivot for the session and will dictate directional bias.
ES is currently trading below the bull/bear line near 6963.00, keeping pressure to the downside. As long as price remains below 6980.25, sellers have the edge with downside targets at 6969.00 and 6955.25, which is the lower range target for today. A failure to hold 6955.25 opens the door for a test of 6931.75.
On the upside, initial resistance sits back at 6980.25. A reclaim and hold above this level would shift momentum back to the upside and target 6994.00, followed by 7005.25, which is the upper range target. Above 7005.25, the next resistance comes in near 7028.50.
Overall, the bias remains bearish below 6980.25. Bulls need acceptance back above this level to negate downside risk and reopen higher range targets.
NQ H
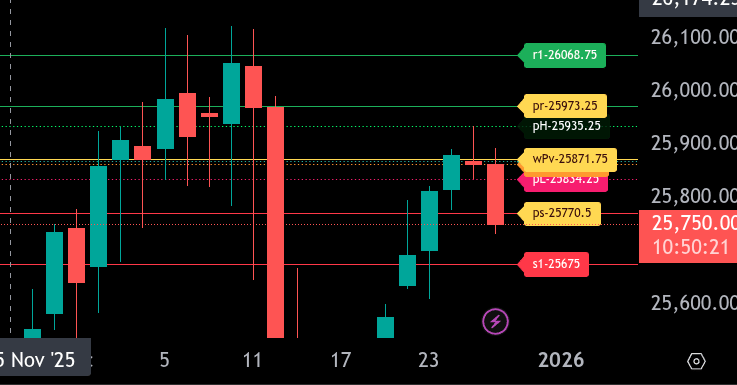
The bull/bear line for the NQ is at 25,871.75. This is the key pivot for today and defines short-term bias.
NQ is currently trading below the bull/bear line near 25,749.75, keeping pressure to the downside. As long as price remains below 25,871.75, sellers have control and rallies into this area are likely to be sold.
On the downside, initial support is at 25,770.50, which is the lower intraday range target and already hit. A sustained break below opens the door to 25,675.00, with further downside risk if selling accelerates through that level.
On the upside, resistance comes in first at 25,834.25, then at 25,935.25. The upper intraday range target sits at 25,973.25. Bulls need a clean reclaim and hold above 25,871.75 to shift momentum and set up a rotation toward these higher levels.
Overall, the tone remains bearish below 25,871.75. Acceptance back above the bull/bear line would neutralize downside pressure and favor a push toward the upper range target.
Calendars
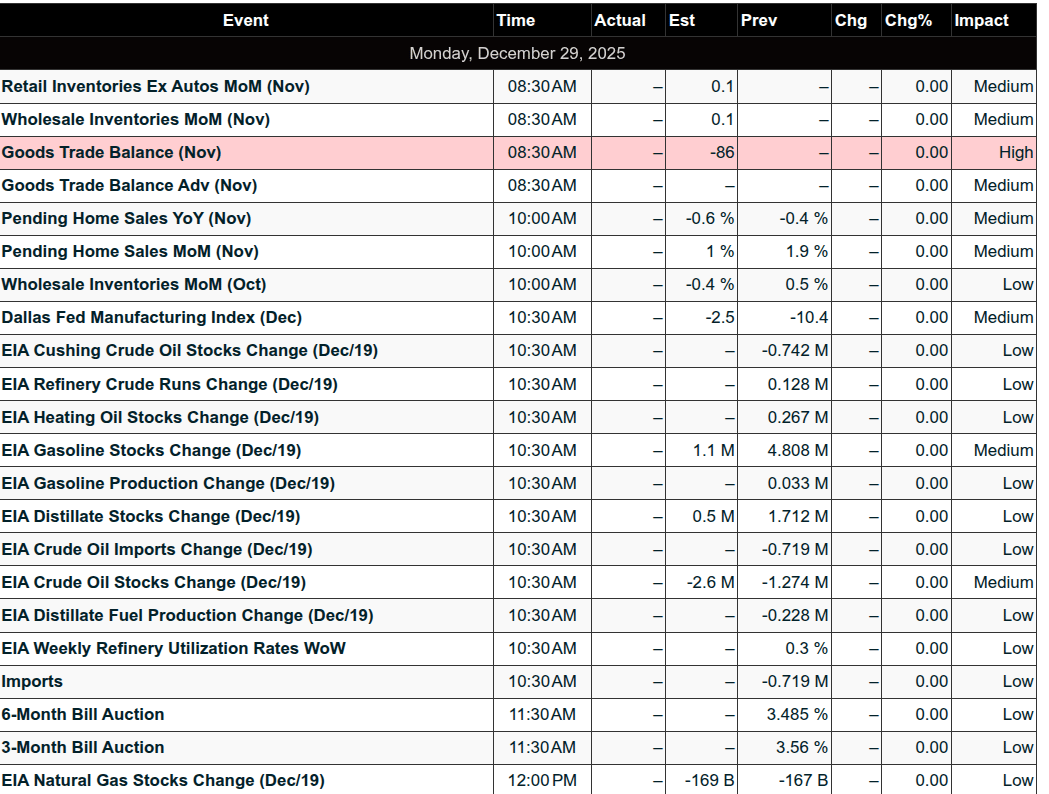
Today’s Economic Calendar
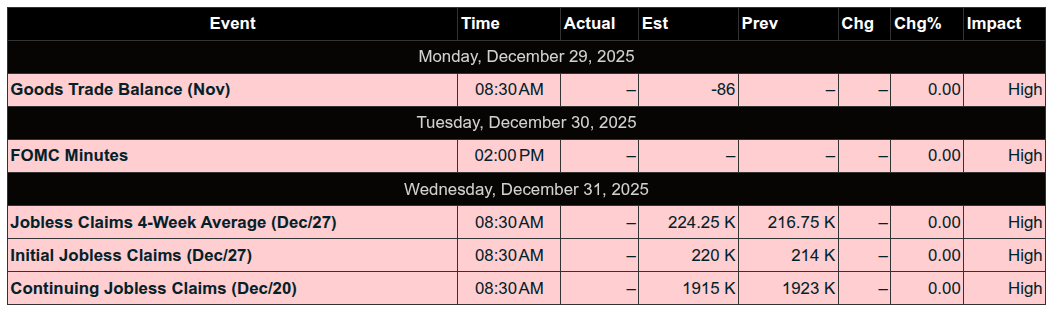
This Week’s Important Economic Events
Upcoming Earnings – SP500
NONE
Recent Earnings
NONE
Room Summaries:
Polaris Trading Group Summary – Friday, December 26, 2025
Friday’s session in the PTG room was a shortened, post-holiday trading day, as PTGDavid announced he would be stepping away around noon. While market volatility was expectedly muted, the day still offered a few clean setups and notable trade opportunities, especially for those who stayed focused through the quieter price action.
Key Trades & Positive Outcomes:
-
DLevel Short – Around 9:52 AM, PTGDavid called out a short setup at a DLevel, providing a tradeable moment in the early session. It was one of the better-structured plays given the limited volatility.
-
Crude Oil (CL) Open Range Short – This trade was the standout of the day. Posted in the afternoon, David confirmed that the CL short hit all targets, capping off the day with a strong win and offering reward to those who continued to monitor markets post-noon.
-
Manny’s Long Setup – Around 10:20 AM, Manny reported “Target 1 filled for +5,” showing that patient, tactical execution still paid off even in thin markets.
-
Silver & Gold Moves – Around 11:00 AM, there was some excitement as silver and gold started to move, with slatitude39 calling out the action. This suggested that commodity markets were offering better intraday movement than the indices.
Lessons & Takeaways:
-
Even quiet days offer opportunities – While the expected dampened volatility was present, traders who stayed selective and disciplined were rewarded.
-
Structure matters – Trades like the DLevel short and the CL Open Range Short highlighted the ongoing value of PTG’s structured approach, even in low-volume environments.
-
Know when to trade light – David set the tone early by announcing a half-day, reminding traders of the importance of adjusting expectations and position sizes around holiday schedules.
-
Confidence in tools – Comments from members (e.g., slatitude39’s trust in retracement tools) reinforced how valuable a consistent methodology is, even in slow sessions.
Summary:
Though Friday was a low-volume, post-holiday session, the PTG room still delivered a few quality trade setups, with the Crude Oil Open Range Short being the day’s top performer. Traders who followed structure and stayed alert were able to capitalize. The room maintained a professional yet relaxed tone, reflecting the season and the lighter trading pace.
Top Trade of the Day: CL Open Range Short – All targets hit
Overall: A quiet but worthwhile session for disciplined traders, with lessons in patience, preparation, and sticking to proven setups — even on slower days.
DTG Room Preview – Monday, December 29, 2025
Markets closed last week with a 2.3% gain for the S&P 500, pulling back slightly Friday after five consecutive green days. The week ahead is another shortened holiday week, with markets closed Thursday for New Year’s Day. Wednesday brings key releases: ADP employment data and Fed December meeting minutes.
We’re now in the heart of the historically strong Santa Claus Rally period. Since 1950, it’s never logged more than two down years in a row — and with both 2023 and 2024 negative, bulls are watching for a rally as a positive sign for 2026.
Key Themes:
-
Market unknowns persist: Russia/Ukraine war, Venezuela oil tensions, potential oil glut, rising US isolationism, high valuations, and growing debt levels.
-
Fed is widely expected (80% odds) to hold rates steady in January, with divisions among members likely to continue into 2026.
-
Mortgage rates remain around 6.2%, stuck amid conflicting labor and inflation data and ongoing government data delays.
-
No notable corporate earnings this week.
Today’s Data:
-
Pending Home Sales @ 10:00am ET
-
Crude Oil Inventories @ 10:30am ET
Volatility & Levels:
-
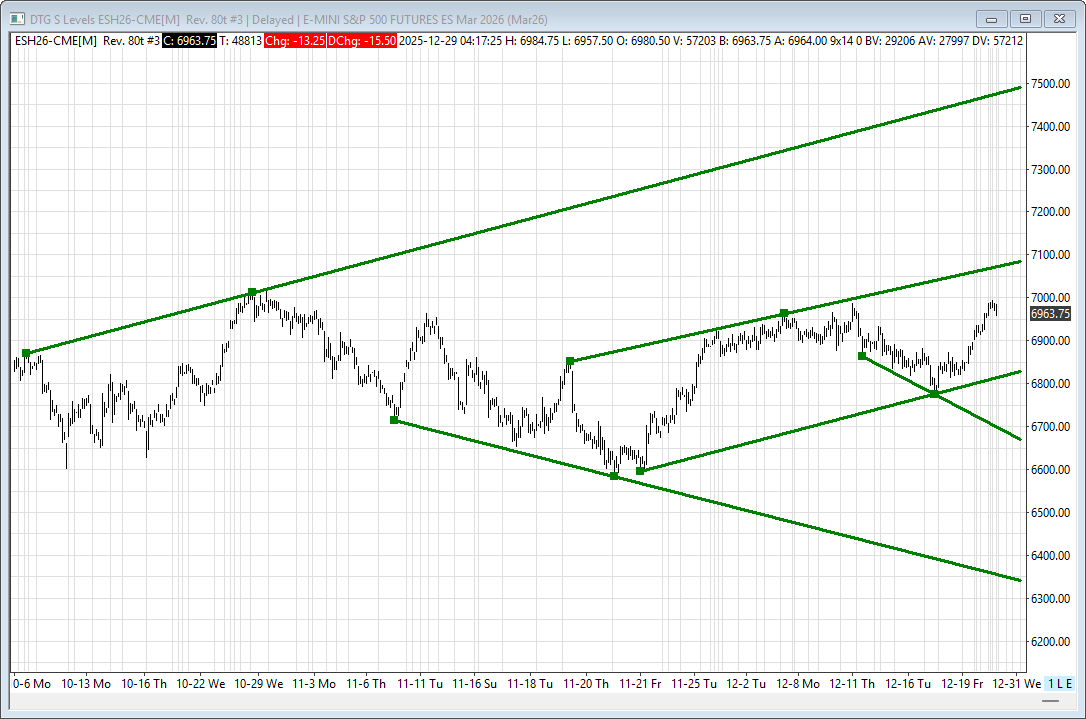
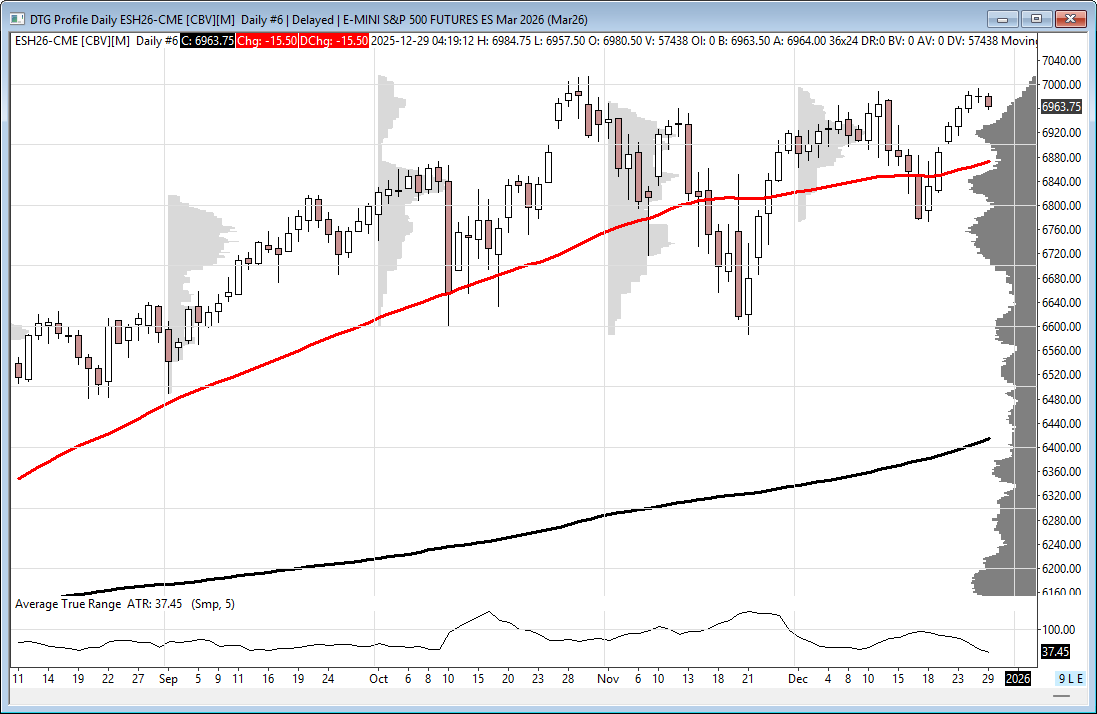
Volatility remains low; ES 5-day ADR down to 47 points.
-
ES continues grinding higher within a short-term uptrend.
-
Resistance: 7080/85, 7495/7500
-
Support: 6824/29, 6670/75, 6332/37
-
50-day MA sits at 6872.25 (loose support).
-
Plenty of room for both bulls and bears in today’s session.
Affiliate Disclosure: This newsletter may contain affiliate links, which means we may earn a commission if you click through and make a purchase. This comes at no additional cost to you and helps us continue providing valuable content. We only recommend products or services we genuinely believe in. Thank you for your support!
Disclaimer: Charts and analysis are for discussion and education purposes only. I am not a financial advisor, do not give financial advice and am not recommending the buying or selling of any security.
Remember: Not all setups will trigger. Not all setups will be profitable. Not all setups should be taken. These are simply the setups that I have put together for years on my own and what I watch as part of my own “game plan” coming into each day. Good luck!
This post goes out as an email to our subscribers every day and is posted for free here around 2 PM ET. To get your real-time copy, sign up for the free or premium version here: Opening Print Subscribe.
Comments are closed