This post goes out as an email to our subscribers every day and is posted for free here around 2 PM ET. To get your real-time copy, sign up for the free or premium version here: Opening Print Subscribe.
Jobs Friday
Follow @MrTopStep on Twitter and please share if you find our work valuable!
Our View
Jobs Friday
This upcoming report is considered the first “clean” data set following a disruptive 43-day federal government shutdown that occurred in late 2025. Goldman Sachs economists, led by Jan Hatzius, have recently highlighted “growing signs of weakness” in the U.S. labor market, pointing to a “low-hire, low-fire” environment that has particularly impacted younger workers.
J.P. Morgan’s Chief U.S. Economist, Michael Feroli, forecasts that the December 2025 jobs report, being released today, will show an addition of 75,000 jobs, exceeding the Dow Jones consensus estimate of 54,000 jobs, with the unemployment rate expected to hold steady at 4.6%.
This projection follows a cooling trend in the U.S. labor market throughout 2025, during which monthly payroll growth averaged 50,000 jobs. The November 2025 report showed a gain of 64,000 jobs, with a 4.6% unemployment rate. J.P. Morgan anticipates this slow growth to persist into the first quarter of 2026, with an average monthly gain of only 25,000 jobs.

U.S. Supreme Court Ruling on Legality of Trump Tariffs & Polymarket Odds
The Supreme Court has scheduled today as an opinion day, making it a possible date for the ruling. Polymarket odds currently indicate a 24% to 25% chance that the Supreme Court will rule in favor of the Trump administration’s tariffs. This suggests that traders on the platform expect the Court to rule against the tariffs, finding them illegal under the International Emergency Economic Powers Act (IEEPA).
Prediction markets have consistently priced in a low probability of the tariffs being upheld. The odds for a favorable ruling for the Trump administration have declined from around 48% in November to current levels, following oral arguments where justices—both conservative and liberal—expressed skepticism about the president’s authority to impose such sweeping tariffs without clear congressional approval.
Our View
Despite the down open, not retesting the Globex low was an indication that the sellers had exhausted themselves, as every selloff led to a bounce. Two things I pointed out yesterday were that:
-
The jobs number would come in inline with expectations of around 60k, and
-
If Trump were going to lose the Supreme Court ruling, the boys with the better seats would be front-running/selling.
Unlike the Polymarket odds above, these odds favor Trump. The only thing I know is that when you throw in the January Week Two options expiration, it all spells one thing: volatility!
Our Lean
I may have gotten a little too negative yesterday, but I did say I didn’t doubt the ES could rally—I just didn’t know if it would hold. And clearly, there were a lot of rallies that got sold.
I still think YM 5000 and ES 7020 are on their way, and that January will be an up month. But if you looked at Jeff Hirsch’s post from the Stock Trader’s Almanac yesterday, January typically opens strong, and weakness tends to creep in mid-month, with sideways and choppy trading through the end of the month.
ES support: 6935–6940, 6910–6900
ES resistance: 6985–6990, 7007, 7020, 7030
Guest Posts:
SPX 2025: From Panic to Persistence
Rich Miller – Handelstats.com
SPX
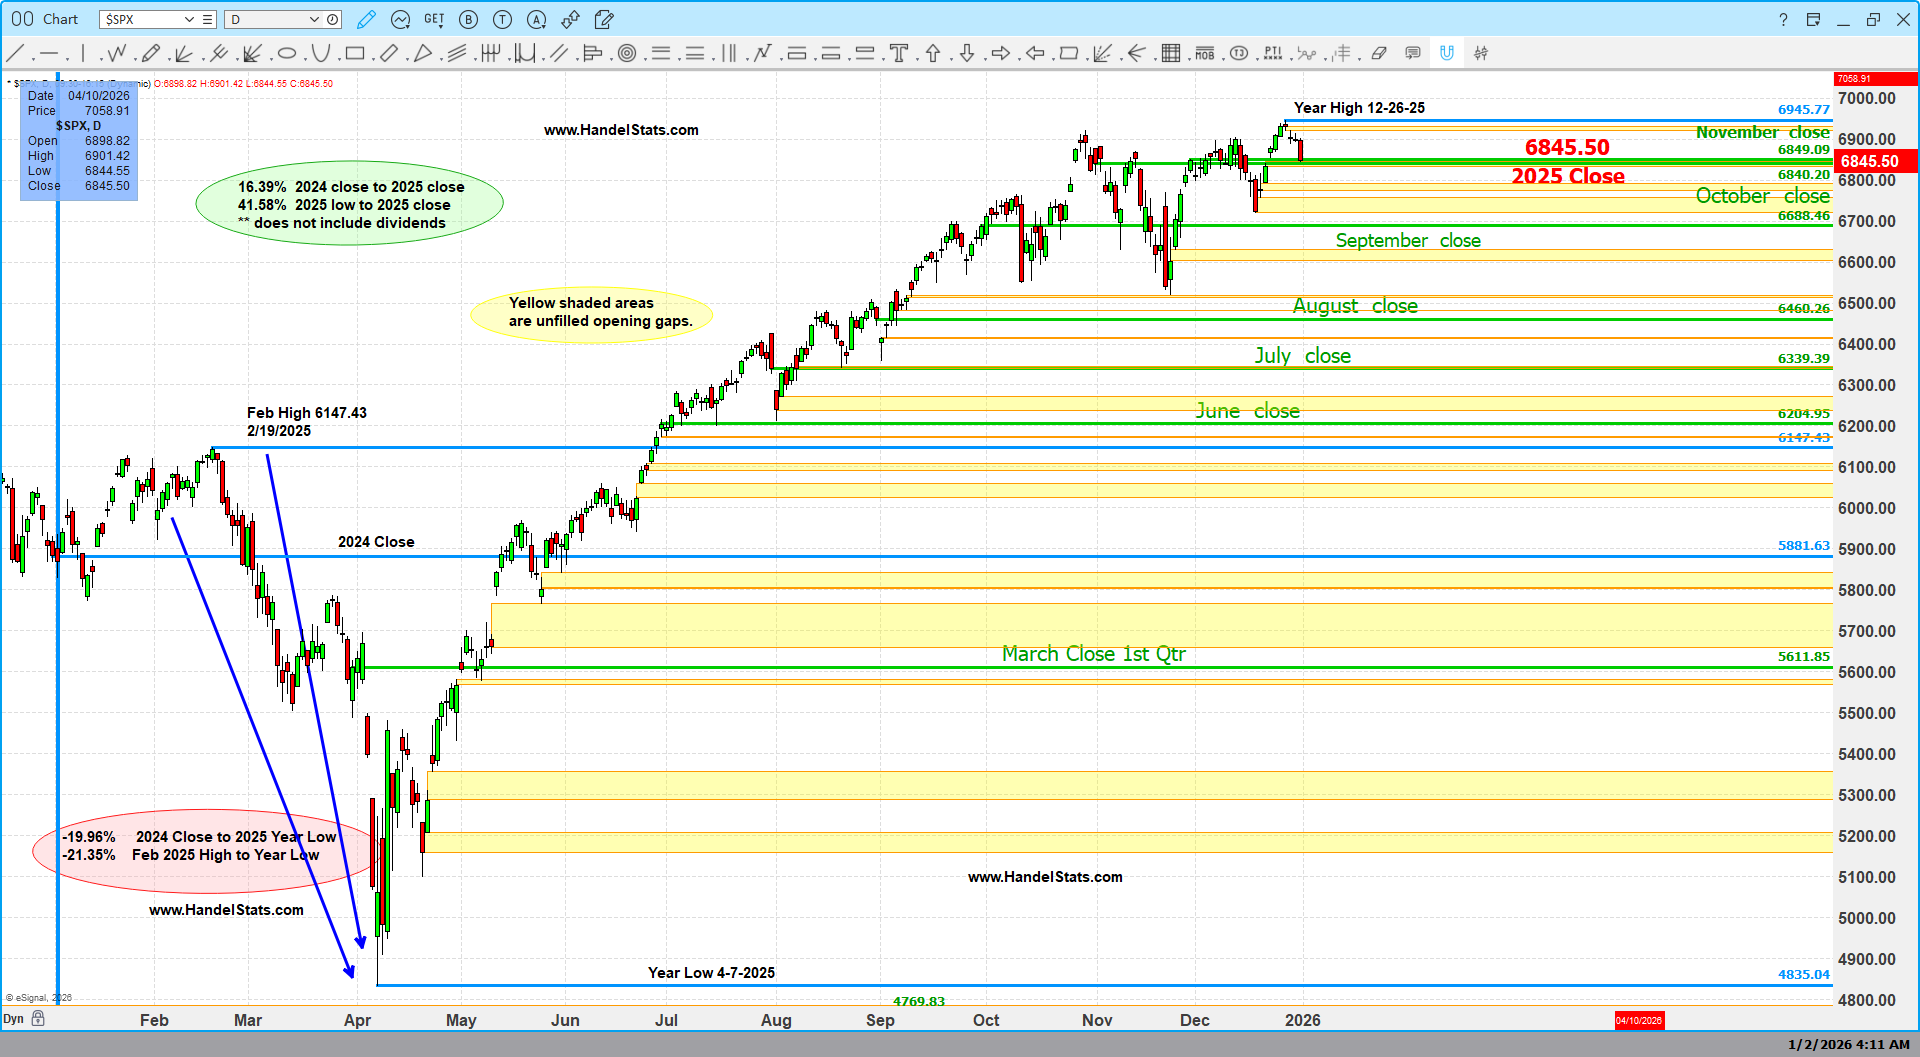
The S&P 500’s 2025 path is a textbook example of why time, structure, and reference levels matter more than headlines.
After opening the year with a sharp drawdown, the SPX fell over 21% from the February high to the April year-low, marking one of the more violent first-quarter resets in recent years. From the 2024 close to that April low, the index was down nearly 20%, testing investor conviction early.
But markets don’t move on emotion alone — they move on repair.
The Turn: April Was the Inflection
April marked the low and the beginning of a steady, structurally sound recovery. From that point forward, the market transitioned into a persistent, trend-driven advance, reclaiming level after level with minimal backtracking.
By year-end:
-
The SPX closed +16.39% from the 2024 close
-
From the April low to the December close, the advance exceeded 40%
-
The year closed at 6845.50, just off the late-December highs
(returns do not include dividends)
Quarter-by-Quarter Perspective
-
Q1 2025: −4.59%
Volatility, liquidation, and forced repricing -
Q2 2025: +10.57%
Strong rebound off the April low -
Q3 2025: +7.79%
Trend continuation with improving breadth -
Q4 2025: +2.35%
Compression, digestion, and consolidation near highs
This was not a one-month wonder — it was a time-validated trend.
Why the Gaps Matter
The yellow zones on the chart highlight unfilled opening gaps, many of which formed during the summer and early-fall advance. These gaps are not predictions — they are references.
Unfilled gaps often act as:
-
Support during pullbacks
-
Magnet levels during corrective phases
-
Risk-definition zones for swing and position traders
Notably, the market respected these structures throughout the second half of the year, reinforcing the idea that price acceptance over time is what confirms trend strength.
The Big Takeaway
2025 reminds us that:
-
Violent declines reset expectations
-
Time confirms direction
-
Structure tells the truth long after the news cycle fades
Markets that survive sharp first-quarter damage and still close near the highs are not weak markets — they are repaired markets.
As we move into 2026, these monthly and quarterly closes, along with the unfilled gap structure, remain critical reference points for risk, opportunity, and expectation.
—
HandelStats
Quantifying markets. Respecting time.
$SPX return by Quarter
5611.85
5881.63
-269.78
-4.59%
Q1 2025
6204.95
5611.85
593.10
10.57%
Q2 2025
6688.46
6204.95
483.51
7.79%
Q3 2025
6845.50
6688.46
157.04
2.35%
Q4 2025
$SPX return by Month
6040.53
5881.63
158.90
2.70%
25-Jan
5954.50
6040.53
-86.03
-1.42%
25-Feb
5611.85
5954.50
-342.65
-5.75%
25-Mar
5569.06
5611.85
-42.79
-0.76%
Apr-25
5911.69
5569.06
342.63
6.15%
May-25
6204.95
5911.69
293.26
4.96%
Jun-25
6339.39
6204.95
134.44
2.17%
Jul-25
6460.26
6339.39
120.87
1.91%
Aug-25
6688.46
6460.26
228.20
3.53%
Sep-25
6840.20
6688.46
151.74
2.27%
Oct-25
6849.09
6840.20
8.89
0.13%
Nov-25
6845.50
6849.09
-3.59
-0.05%
Dec-25
** Does not include dividends.

Get instant access to our partners’ real-time market data and insights not available anywhere else. Here is last night’s Founder’s note getting you ready for today’s market and explaining the constraints in yesterday’s market. – MrTopStep
Founder’s Note:
Futures are +15bps ahead of NFP and a possible ruling from the Supreme Court on tariffs.
Today’s straddle is $42/60bps, implying mild risk into today’s data points. This is quite a bit richer relative to the 40bps straddle from yesterday, which speaks to today’s data having more impact vs Jobless Claims.
Given this, we continue to see a grinding/chopping market if the SPX holds >6,900. This grind is driven by positive gamma in the 6,900-7,000 range. With the passing of NFP, vol may contract a bit, and that could add positive drift which may push SPX toward 7,000.
<6,890 we would flip to a risk-off stance.
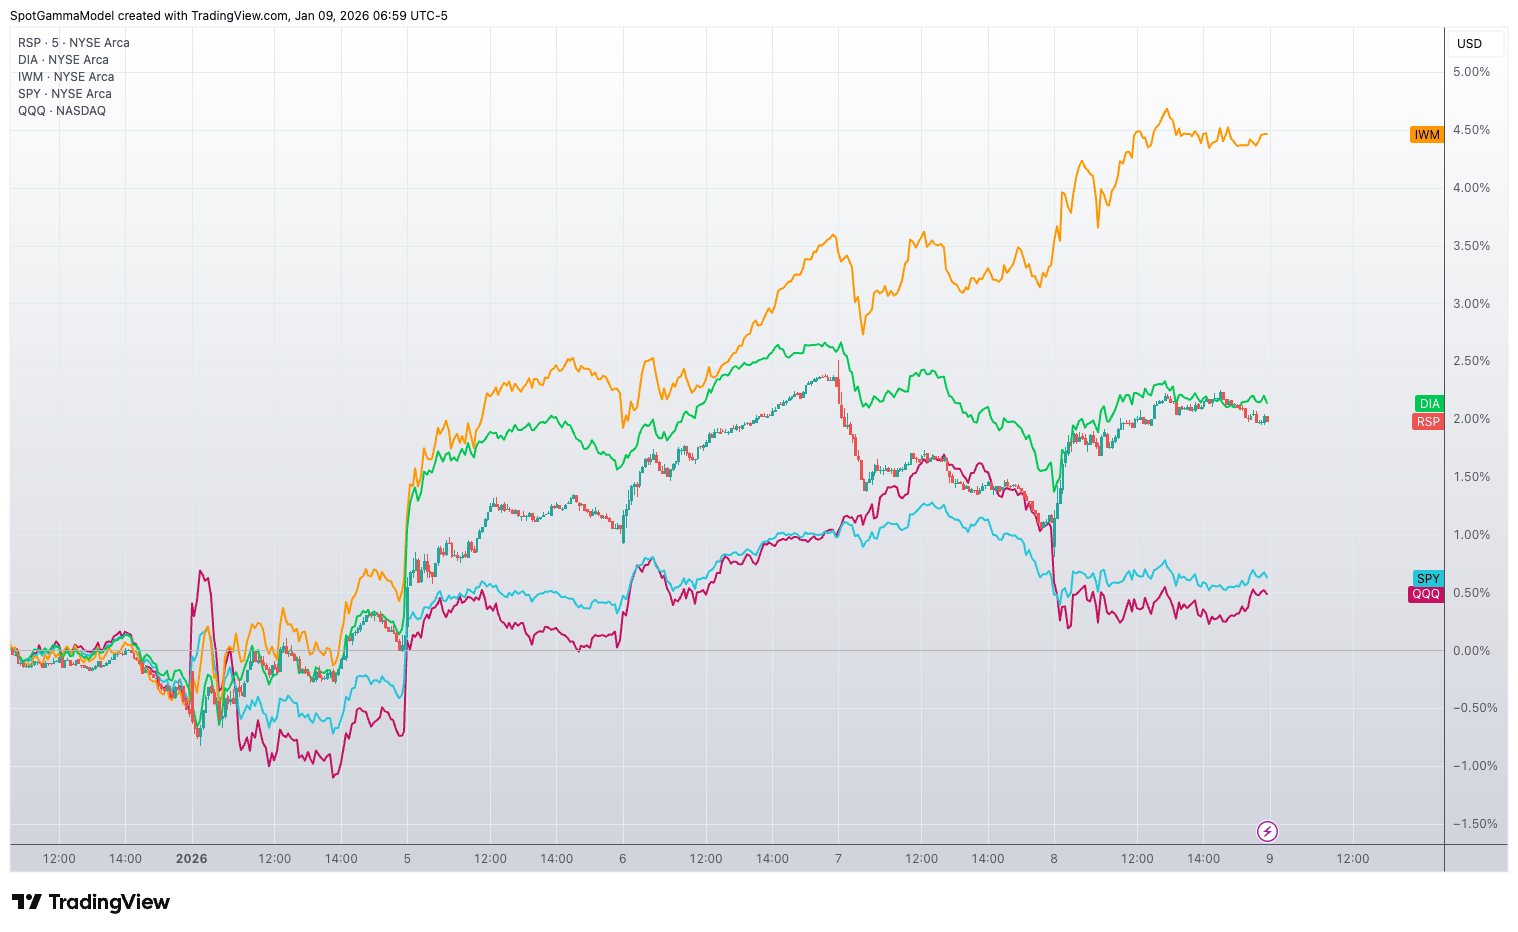
While the SPX has stalled, small caps, DJIA, and equal-weighted SPX (RSP) have performed strongly over the last week. You can see the outperformance below, with IWM surging 4.5% in the first 9 days of Jan. This of course speaks to rotation, as investors allocate amongst equities to best position. This, vs allocating across assets. You can tie this rotation idea into our low equity correlation (i.e. COR1M) environment – this environment is about an alpha-chase, not a risk-protection/mitigation regime.
Our concern with this low equity correlation is the potential for a volatility spasm, which would correct the imbalance between single stock and index vol. The trouble with this, is timing. A benign passing of NFP likely leads to a “risk-on” Friday, as traders head into the weekend. When you turn to something like the potential Supreme Court ruling, we have little view on potential impact but that feels like a potential curve ball that could catch traders off guard. We can’t help but recall Trump’s 10/10 tweet(s) that sparked a 1-day 2-3% decline (from a very low vol position).
That said, we’re simply not going to bet on “upset” until/unless SPX <6,890.
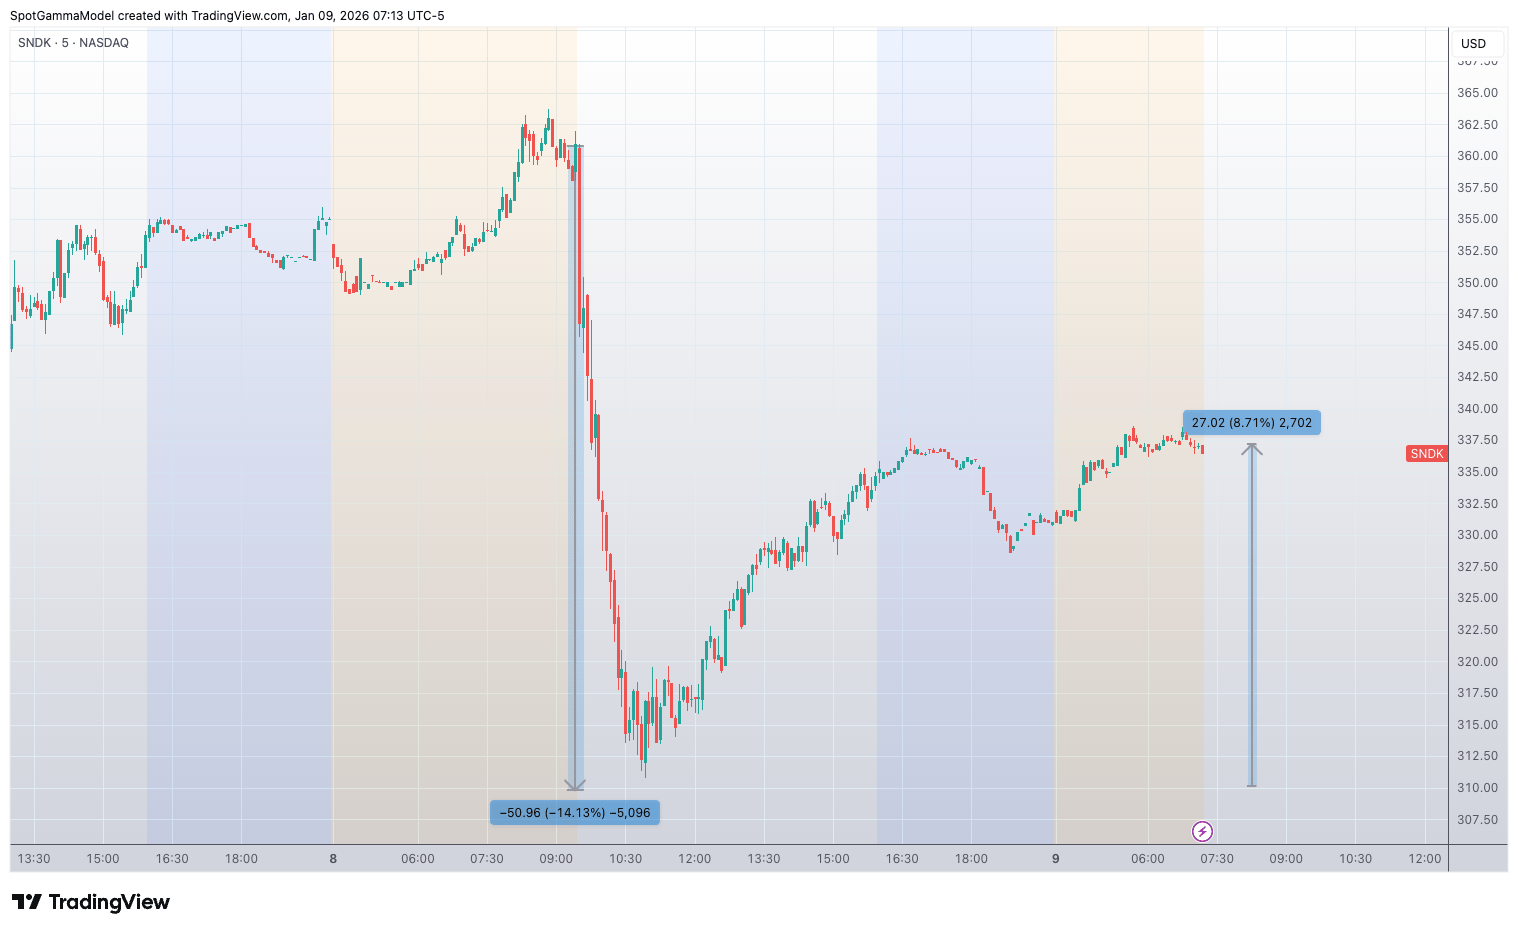
If you look at something like SNDK, which we highlighted yesterday AM, its +75% Skew Rank and +75% IV Rank scream instability, as traders bid calls. The stock went into yesterday AM +40% on the year, purged -15% into mid-day, then rallied 8% from lows. Other related stocks saw similar volatility, and it speaks to the instability of this environment, which is cloaked by the real lack of movement of the SPX over the last week (i.e. SPX stuck in 6,900-6,950).
©2025 TenTen Capital LLC DBA SpotGamma
All TenTen Capital LLC DBA SpotGamma materials, information, and presentations are for educational purposes only and should not be considered specific investment advice nor recommendations. Futures, foreign currency and options trading contains substantial risk and is not for every investor. An investor could potentially lose all or more than the initial investment. Risk capital is money that can be lost without jeopardizing one’s financial security or lifestyle. Only risk capital should be used for trading and only those with sufficient risk capital should consider trading. Past performance is not necessarily indicative of future results. VIEW FULL RISK DISCLOSURE https://spotgamma.com/model-faq/disclaimer/
Market Recap
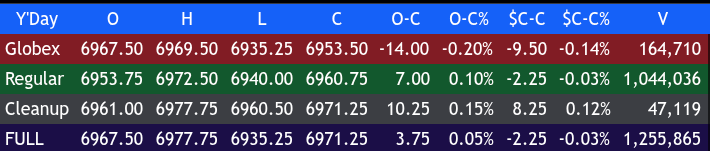
The ES traded down to 6935.25 on Globex and opened Thursday’s regular session at 6953.75, down 9.25 points or -0.13%. After the open, the ES traded 6948.75, rallied up to 6958.50, sold off to the RTH low of 6940.00 at 9:45, then rallied up to 6966.00 at 10:15. It chopped up and down in a 10-point range, sold back off to 6960.75 at 10:55, rallied again to 6966.00, traded back down to 6950.25 at 11:35, rallied up to 6967.25 at 11:45, then back-and-filled in a 5 to 9-point range until 12:25.
The ES rallied to a new high of 6972.50 at 12:50, sold off to 6954.00, rallied up to 6964.50 at 1:45, sold off down to 6949.25 at 2:15, and rallied to a 6960.00 double top at 2:30. It back-and-filled just above and below the vwap, then rallied up to 6967.25 at 3:35. It traded down to and traded 6961.75 as the 3:50 cash imbalance showed flat NYSE and $950 million to sell on NASDAQ. It traded 6961.00 on the 4:00 cash close. After 4:00, the ES rallied up to 6977.00, pulled back a bit, and settled at 6963.25, down 3.5 points or -0.03%.
The NQ settled at 25,687.50, down 151.25 points or -0.59%, the YM settled at 49,493, up 254 points or +0.52%, and the Russell 2000 futures (QRH26) settled at 2818.40, up 28.9 points or +1.12% on the day.
In the end, it was a choppy session with large rotations—buy Russell and Dow, sell Nasdaq—reflecting a move out of AI-related and mega-cap technology stocks into small caps. In terms of the ES’s overall tone, there was a lot of two-way price action, capped off with a post-cash-close pop. In terms of the ES’s overall trade, volume was in line with the last few sessions at 1.256M.
The yield on the 10-year note rose +3 bps to 4.18%, which was another negative factor, after announced layoffs at U.S. companies dropped to a 17-month low in December, and weekly jobless claims rose less than expected.
On Tap
9:45 AM: U.S. Employment Rate, U.S. Hourly Wages, U.S. Hourly Wages YoY
Also: Housing Starts, UMich Consumer Sentiment
1:35 PM: Richmond Fed President Tom Barkin speaks
MiM
Market-On-Close Recap
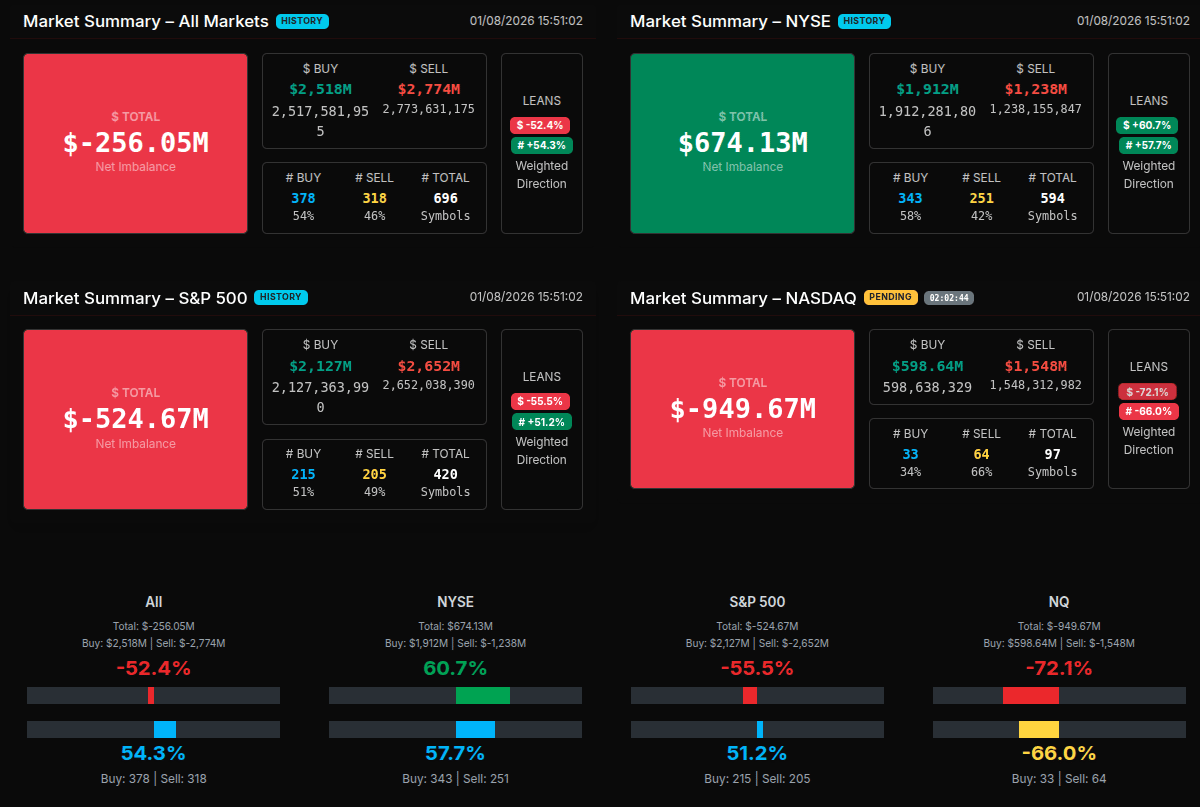
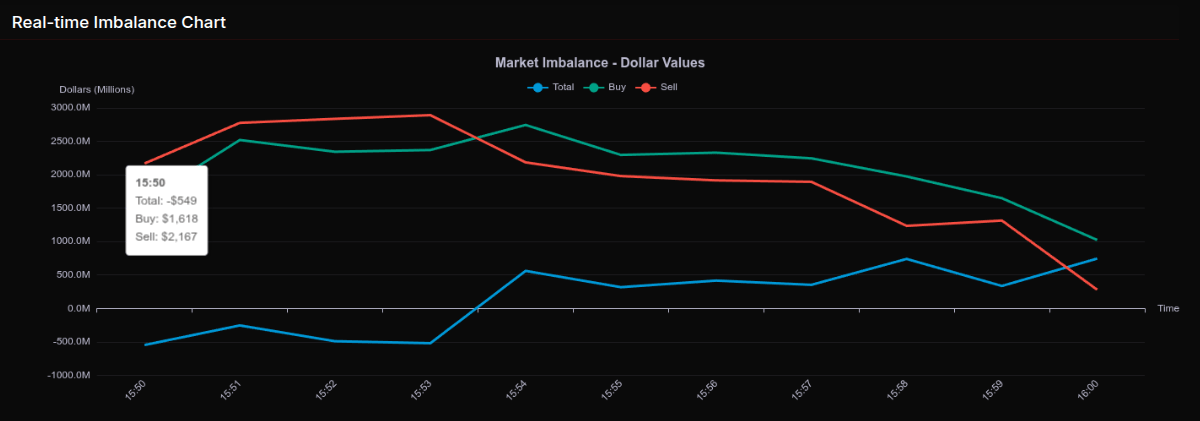
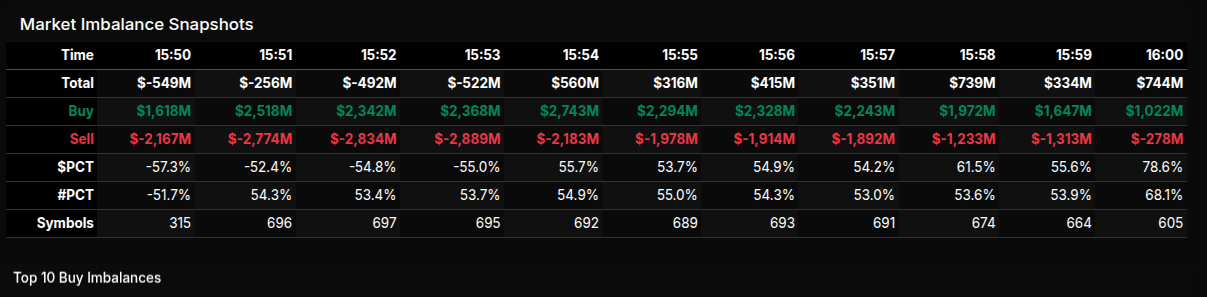
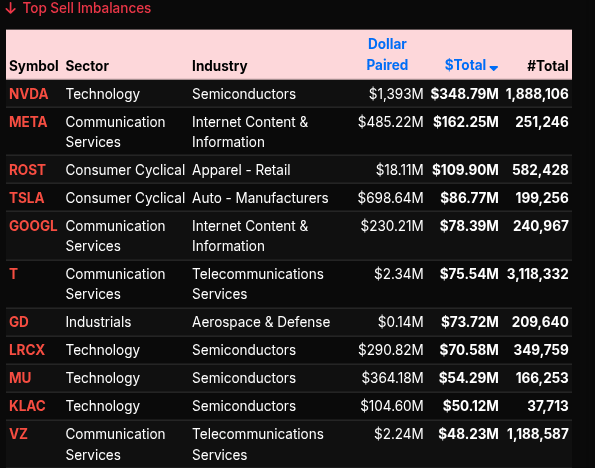
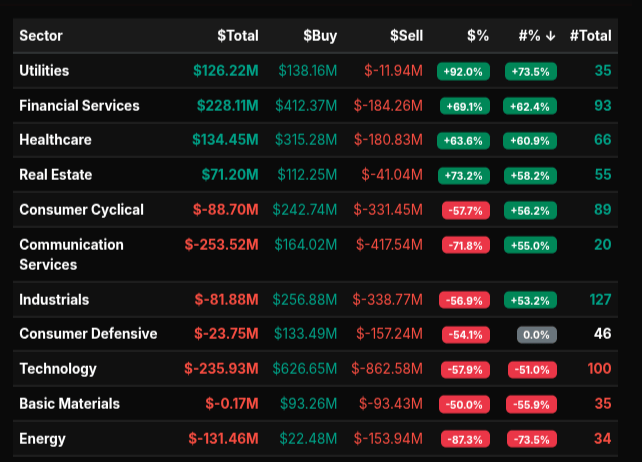
The Market-on-Close auction opened with a clear defensive tone before undergoing a notable late-session transition as buy interest steadily reasserted itself into the final prints. Early imbalance snapshots showed the tape leaning decisively to the sell side, with total imbalances hovering near minus $500M to minus $550M between 15:50 and 15:53. Sell pressure was broad, particularly across Technology, Communication Services, and Consumer Cyclical, where sell-side dollars overwhelmed paired buys and pushed sector leans well beyond the -66% threshold — a sign of wholesale liquidation rather than routine rotation.
Technology was the clear weight, finishing with a net imbalance of nearly -$236M and a lean close to -58%. Semiconductor-heavy names dominated the sell list, led by NVDA, META, LRCX, MU, and KLAC, confirming that this was not isolated profit-taking but coordinated supply hitting the close. Communication Services followed a similar path, ending near -$254M, driven by persistent selling in META, GOOGL, T, and VZ. Energy also stood out on the downside, posting an extreme -87% lean, reinforcing the one-sided nature of selling in that group.
The character of the auction shifted materially after 15:54. Buy programs began to step in, pushing total imbalances positive in several snapshots and lifting buy percentages into the mid-50s and low-60s. Financial Services, Utilities, Healthcare, and Real Estate all posted strong positive leans above +66%, indicating genuine demand rather than simple offsetting flows. Financials were particularly notable, with over $412M in buy interest against $184M in sells, while Utilities showed one of the cleanest buy-side profiles of the session.
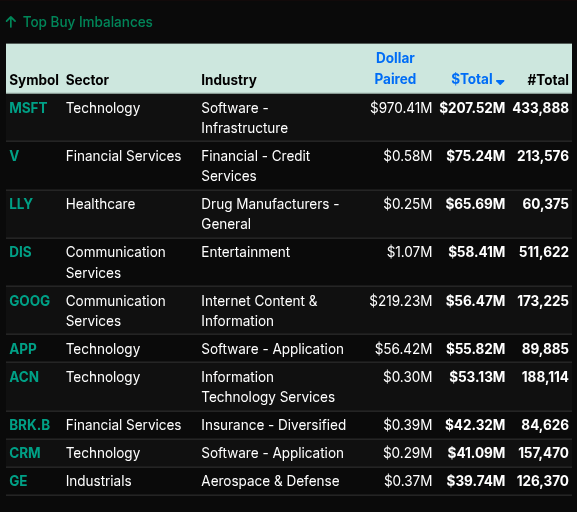
On the single-name side, MSFT anchored the buy list with over $207M to buy, joined by LLY, DIS, GOOG, and ACN, signaling selective accumulation in quality large caps. By the final print, the auction closed with a sharp Nasdaq sell imbalance near -$950M, contrasted by a firm NYSE buy imbalance north of $670M. That divergence underscores the day’s defining theme: heavy de-risking in growth and tech, offset by rotation into defensive, financial, and yield-sensitive sectors rather than a blanket risk-off exit.
ES Levels
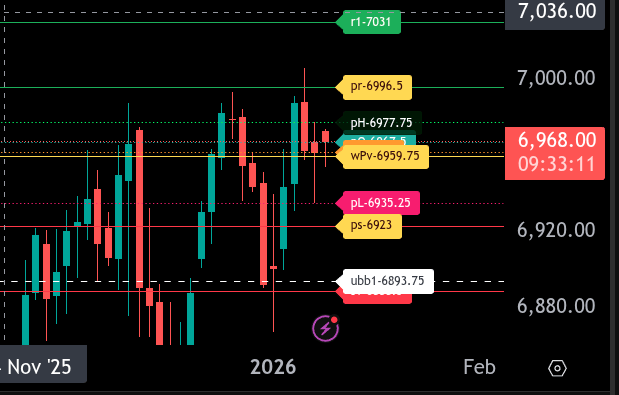
The bull/bear line for the ES is at 6959.75. This is the key pivot for today and defines directional bias.
ES is currently trading near 6967.75 in the Globex session, holding above the bull/bear line. Acceptance above 6959.75 keeps the tone constructive and opens the door for rotation higher.
On the upside, initial resistance is at 6977.75, followed by 6996.50. A sustained push above 6996.50 targets 7031.00.
If ES loses 6959.75, downside pressure increases with support at 6935.25. Below that, look for a test of 6923.00, the lower range target. Failure to hold 6923.00 risks extension toward 6893.75 and 6888.50.
Overall, ES remains bullish above 6959.75. A break back below this level shifts the bias back to sell-the-rallies until reclaimed.
NQ Levels
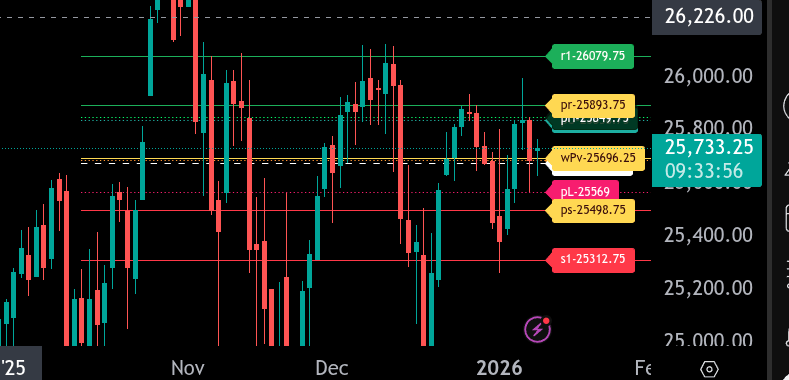
The bull/bear line for the NQ is at 25,696.25. This is the key pivot for today’s session and defines directional bias. Holding above this level keeps the upside in play, while sustained trade below it favors sellers.
NQ is currently trading around 25,733.75, slightly above the bull/bear line. As long as price holds above 25,696.25, look for rotation higher toward 25,838.75 and then 25,849.75. A clean push through this zone opens the door to the upper range target at 25,893.75.
Failure to hold 25,696.25 shifts focus back to the downside. Initial support sits at 25,569.00, followed by 25,498.75, which is the lower range target for today. A breakdown below 25,498.75 increases risk of acceleration toward 25,312.75.
Overall, the NQ remains balanced to slightly constructive above 25,696.25, but volatility is elevated. Expect two‑way trade around the bull/bear line, with directional clarity coming only after a decisive hold above 25,893.75 or a breakdown below 25,498.75..
Technical Edge
Fair Values for January 9, 2026
-
SP: 38.27
-
NQ: 165.53
-
Dow: 215.6
Daily Breadth Data 📊
For Thursday, January 8, 2026
-
NYSE Breadth: 70.83% Upside Volume
-
Nasdaq Breadth: 51.06% Upside Volume
-
Total Breadth: 53.78% Upside Volume
-
NYSE Advance/Decline: 69.03% Advance
-
Nasdaq Advance/Decline: 54.91% Advance
-
Total Advance/Decline: 60.06% Advance
-
NYSE New Highs/New Lows: 165 / 28
-
Nasdaq New Highs/New Lows: 245 / 73
-
NYSE TRIN: 1.02
-
Nasdaq TRIN: 1.13
Weekly Breadth Data 📈
Week Ending Friday, January 2, 2026
-
NYSE Breadth: 46.79% Upside Volume
-
Nasdaq Breadth: 51.73% Upside Volume
-
Total Breadth: 49.99% Upside Volume
-
NYSE Advance/Decline: 43.42% Advance
-
Nasdaq Advance/Decline: 37.97% Advance
-
Total Advance/Decline: 39.94% Advance
-
NYSE New Highs/New Lows: 136 / 86
-
Nasdaq New Highs/New Lows: 225 / 521
-
NYSE TRIN: 0.84
-
Nasdaq TRIN: 0.56
Calendars
Economic Calendar Today
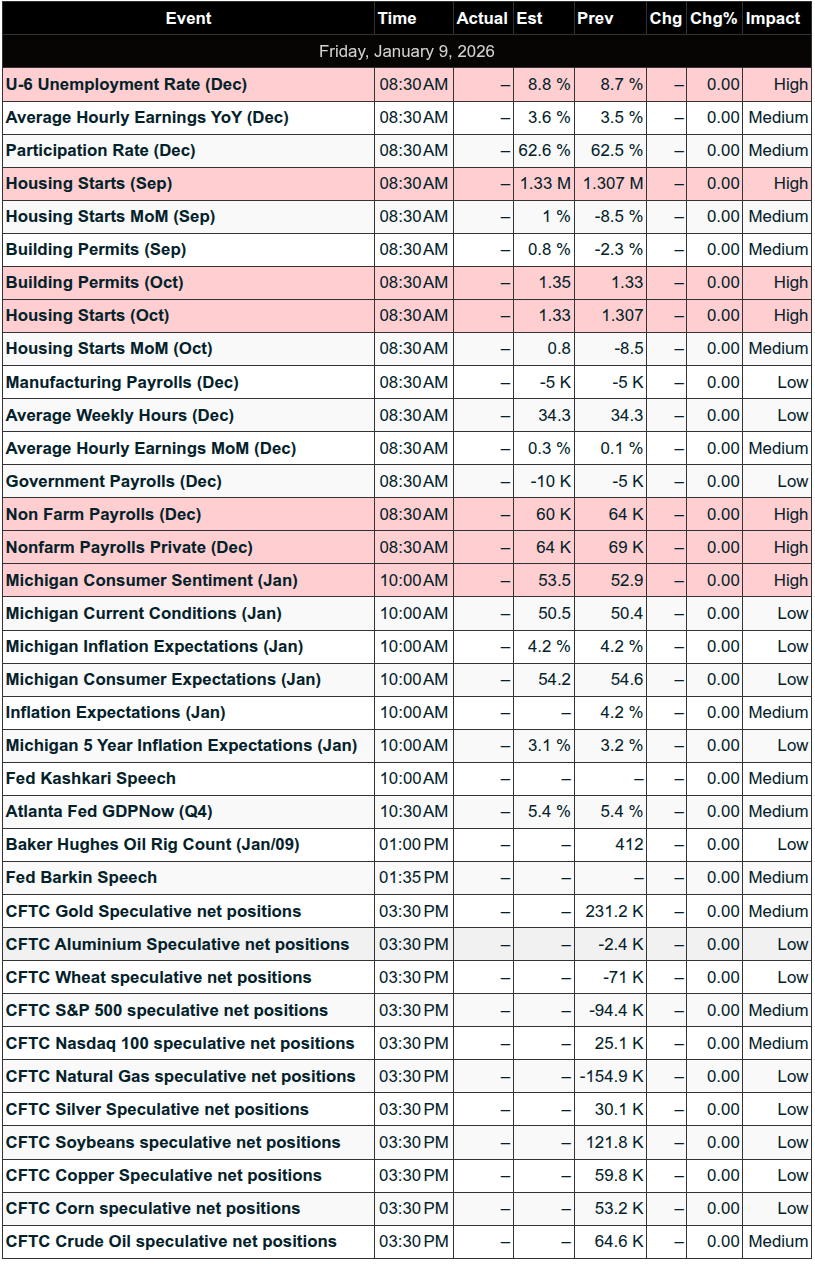
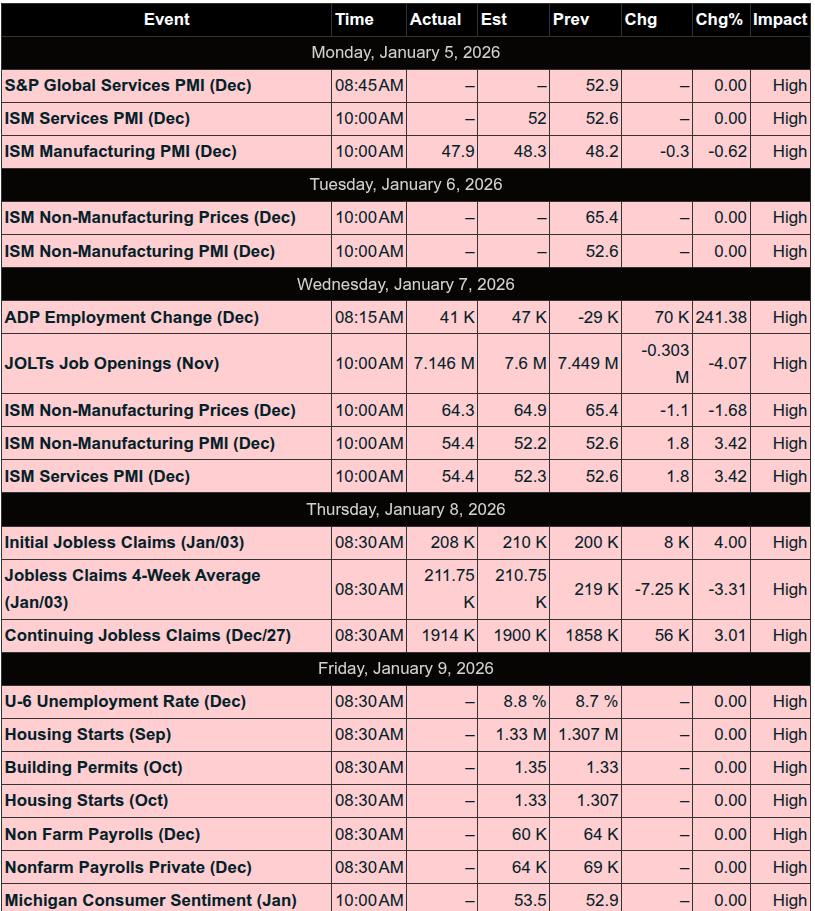
This Week’s High Importance
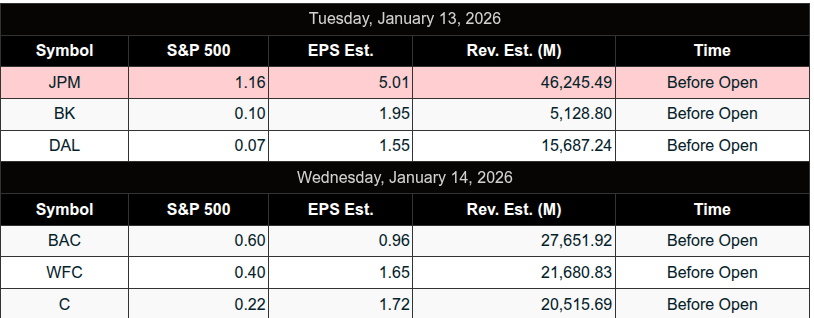
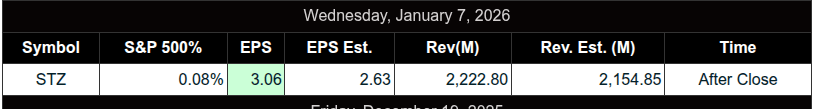
S&P 500 Earnings:
Upcoming:
Recent:
Trading Room News:
Polaris Trading Group Summary – For Thursday, January 8, 2026
Thursday was a technically sound trading day where the pre-market bear scenario played out, followed by a strong rebound and “Dip and Rip” setup. While the early action gave limited opportunity for Setup #1, the order flow confirmed support responsiveness, and the market structure rewarded patience.
Room energy was high, with a lot of platform troubleshooting and collaboration, making it a good blend of trading education and community support.
Market Context & Trade Plan
-
Manny shared the trade plan early:
-
Primary Setup: Support Buy Zone at 6933–6937 (ES) / 6895 (SPX)
-
Trigger criteria: buyer absorption, delta flip positive, stacked bids, and seller exhaustion.
-
-
David confirmed that the overnight Bear Case had unfolded, reaching the 6940–6930 zone.
-
Market rebounded to Price Line (PL) 6957, where bulls needed to “C&C” (control & convert) that level.
-
Line in the Sand: 6965
-
Bear Case: Below 6965 → Targets: 6940…6930…6925
-
Bull Case: Above 6965 → Targets: 6975…6985…6995
-
-
Key Market Action
-
Initial Bearish Pressure: Price tested and responded to the lower support zone, validating the bear case.
-
Bounce from DLMB Zone: David noted a “solid response” from the upper DLMB zone mid-morning.
-
This led to a “Dip and Rip” pattern — a bullish intraday reversal after morning weakness.
-
-
Later in the day, the market tagged the 75% daily range high, suggesting follow-through strength after the dip recovery.
Positive Takeaways / Lessons Learned
-
Support Zone was respected: Though Manny missed an entry, the zone worked as expected. Great reinforcement of how pre-market planning aligns with real-time order flow.
-
Dip-n-Rip Pattern provided a high-probability setup, especially for traders watching DLMB zones and waiting for bullish confirmation.
-
Room discipline showed: Despite chop and potential NFP anticipation, traders remained focused, and many saw the expected price behaviors play out.
DTG Room Preview – Friday, January 9, 2026
-
Markets face potential turbulence today with two key events on deck:
-
Supreme Court Ruling on Tariffs: A decision is expected on the legality of Trump-era tariffs. A ruling against them could lead to hundreds of changes in the U.S. tariff book, significant business disruptions, and potential refunds of billions in duties—impacting companies like Costco (COST). This adds uncertainty to markets already strained by regulatory burdens from a now 4,500-page Harmonized Tariff Schedule.
-
December Jobs Report @ 8:30am ET: Key for the Fed’s rate path. Expectations: slower job growth and a small drop in unemployment. Also on tap: UoM Consumer Sentiment & Inflation Expectations @ 10:00am ET, Building Permits & Housing Starts @ 8:30am ET. Fed speakers: Kashkari (10:00am), Barkin (1:35pm).
Other Headlines:
-
Trump directs $200B in MBS purchases via Fannie/Freddie to lower mortgage rates—details unclear.
-
J&J reportedly reached a deal with the Trump admin to lower drug prices in exchange for tariff exemptions.
Market Setup:
-
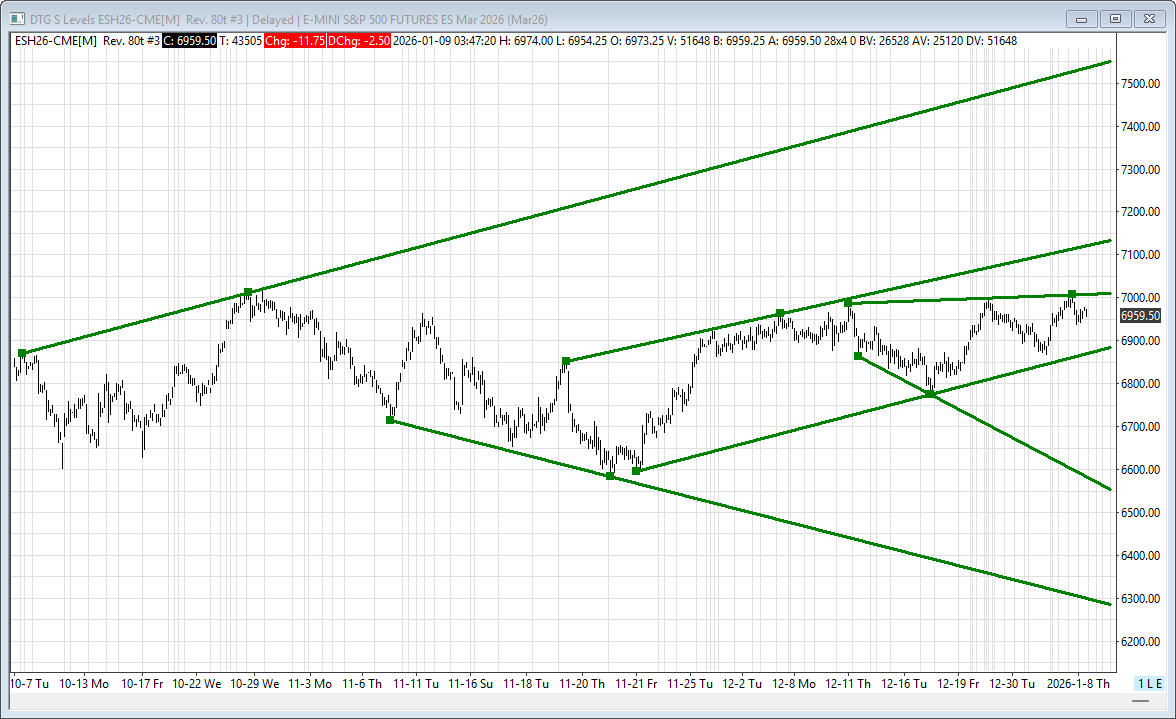
ES stuck in 6-week sideways consolidation; Supreme Court ruling could be the catalyst for breakout.
-
Whale bias is bearish into the 8:30am jobs data after significant overnight volume.
-
ES key levels:
-
Resistance: 7007/04s, 7125/30s, 7550/55s
-
Support: 6872/77s, 6556/51s, 6280/75s
-
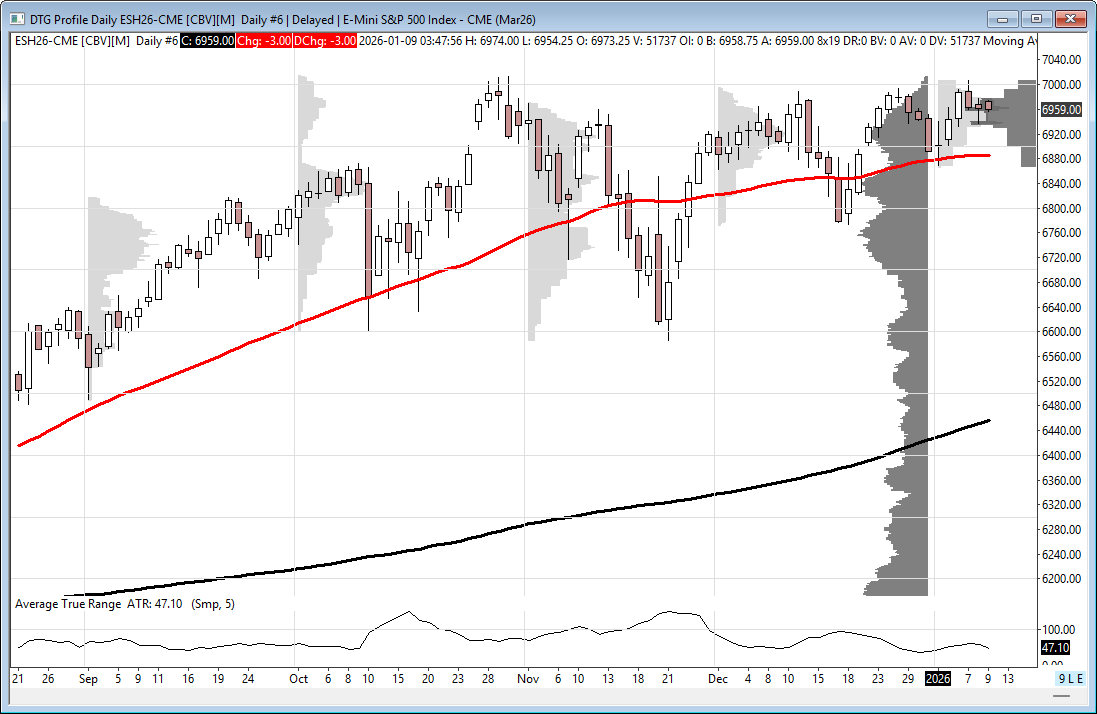
50-day MA: 6885.25 acting as loose support
-
Volatility is expected to expand sharply after contracting Thursday. Buckle up.
-
Affiliate Disclosure: This newsletter may contain affiliate links, which means we may earn a commission if you click through and make a purchase. This comes at no additional cost to you and helps us continue providing valuable content. We only recommend products or services we genuinely believe in. Thank you for your support!
Disclaimer: Charts and analysis are for discussion and education purposes only. I am not a financial advisor, do not give financial advice and am not recommending the buying or selling of any security.
Remember: Not all setups will trigger. Not all setups will be profitable. Not all setups should be taken. These are simply the setups that I have put together for years on my own and what I watch as part of my own “game plan” coming into each day. Good luck!!
Follow @MrTopStep on Twitter and please share if you find our work valuable!
This post goes out as an email to our subscribers every day and is posted for free here around 2 PM ET. To get your real-time copy, sign up for the free or premium version here: Opening Print Subscribe.
Comments are closed