This post goes out as an email to our subscribers every day and is posted for free here around 2 PM ET. To get your real-time copy, sign up for the free or premium version here: Opening Print Subscribe.
Headlines Rule, Volatility Builds — ES Burns Buying Power as Uncertainty Tightens the Noose
Follow @MrTopStep on Twitter and please share if you find our work valuable!
FREE Two-Week Offer for the Opening Print Premium. Open up the Lean and other premium features for the next Two Weeks!
Our View
As I have always said, the S&P hates uncertainty. Yes, the ES sold off and bounced, but there is a high probability that the headline hysteria is not over. The PitBull thought the US would strike Iran last night. The Polymarket odds for a US strike on Iran on this date are approximately 4% to 8%, with the odds increasing to 32% by January 16, 56% by January 23, and 66% by January 31. The markets do not specifically track “Trump attacks Iran” as a distinct event, but rather general US military action.
Credit Default Swaps Surge
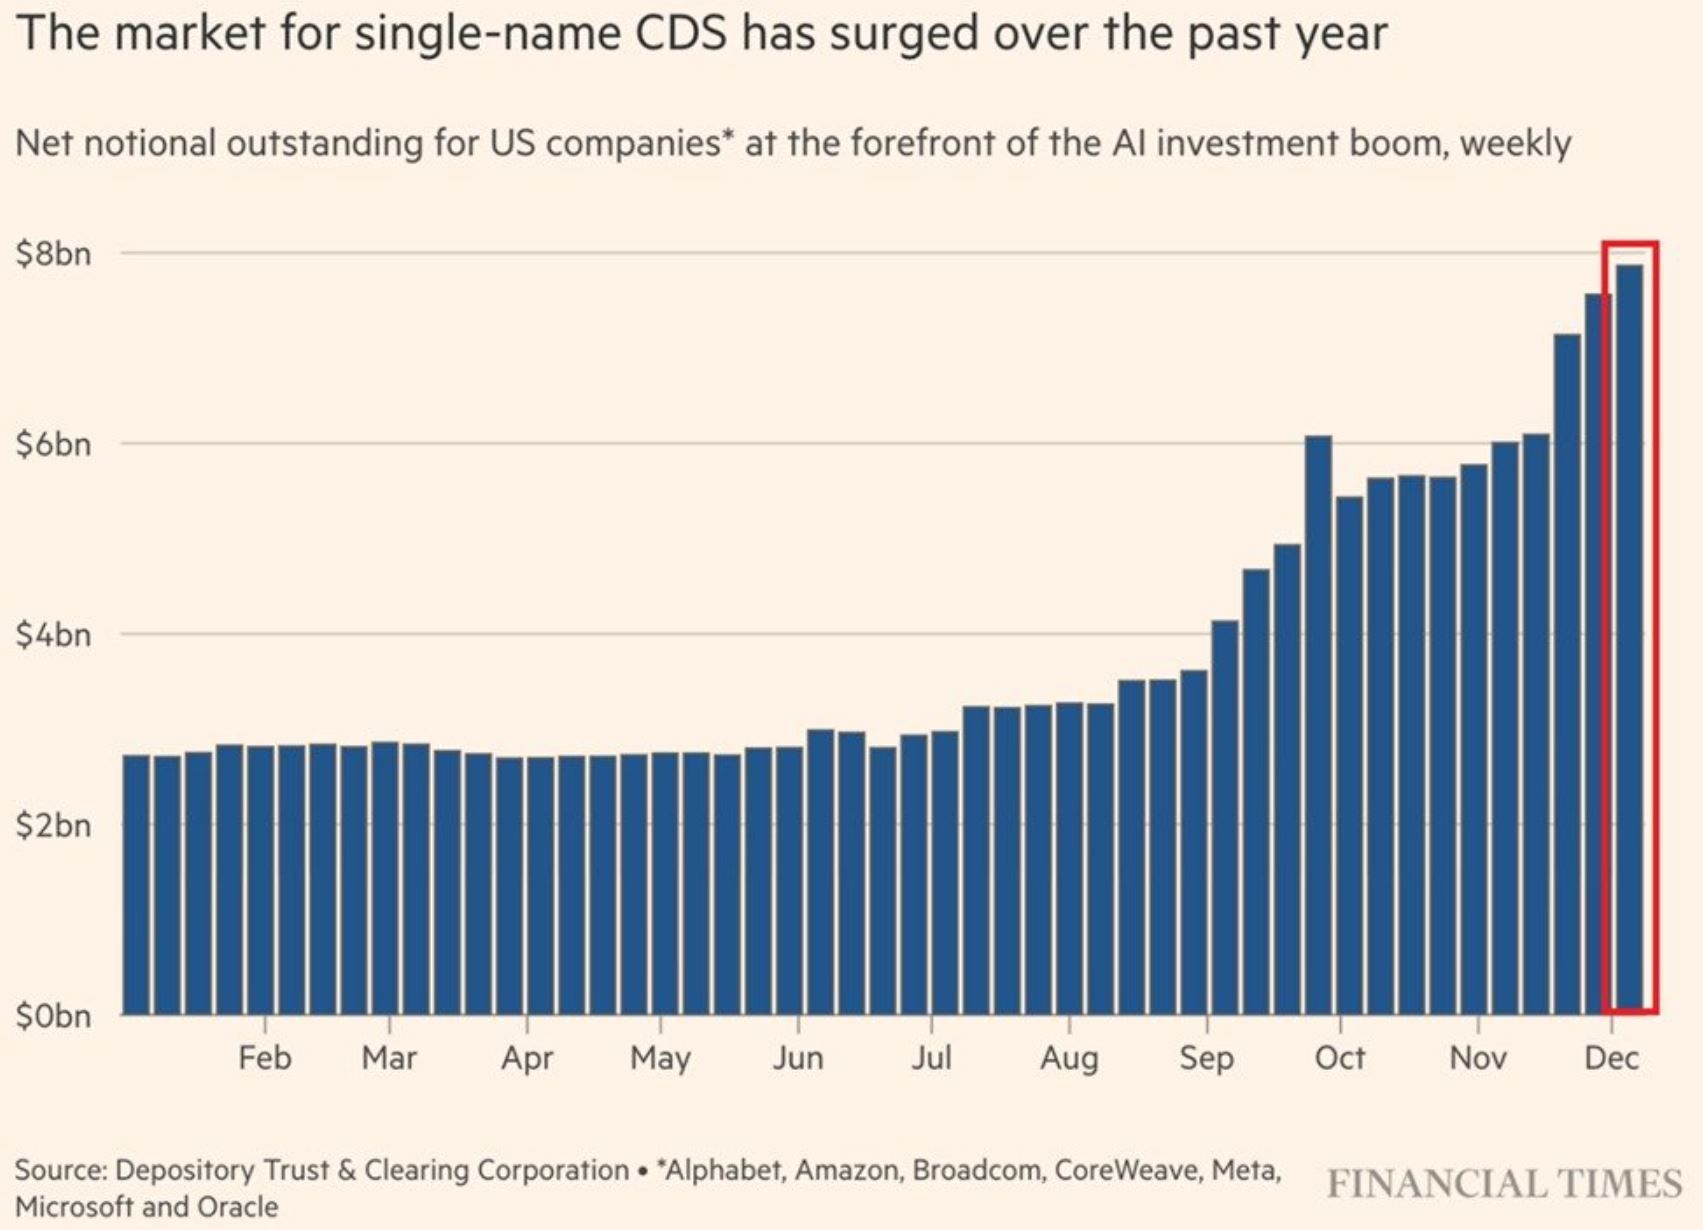
AI-driven borrowing is pushing investors to seek more downside protection:
The weekly trading volume in credit default swaps (CDS) tied to major tech companies rose to ~$8 billion in December 2025, the highest on record.
Volumes have more than DOUBLED since August.
By comparison, volumes were steady, at ~$3 billion, for the first half of 2025.
This comes as tech companies raised a combined $88 billion in debt last fall to fund AI infrastructure projects, led by Meta, Amazon, Alphabet and Oracle.
Meanwhile, investment-grade companies are projected to raise a massive $1.5 trillion by 2030 to build out AI infrastructure.
Investors are quietly hedging against AI debt risks.
Broader Big Tech and AI Context
The Oracle situation is part of a larger trend where tech giants like Alphabet, Amazon, Meta, and Broadcom have issued over $120 billion in bonds since September 2025 to finance AI data centers and related capex. This debt frenzy has sparked new CDS markets for companies like Meta, with investors seeking protection amid fears of overinvestment and potential downgrades (e.g., Oracle risks slipping into high-yield territory). Analysts warn spreads could hit 150-200 bps if financing clarity remains poor.
Company
Recent 5-Year CDS Spread (bps)
Change (Since Sept 2025)
Key Risk Factor
Oracle
126-139
+44% to +310%
$100B+ AI debt, earnings miss
Meta
~50-60 (emerging market)
New surge in inquiries
AI capex borrowing (~$38B loans)
Nvidia
Lower than Oracle (not specified)
Minimal
Less debt exposure vs. peers
Alphabet
~40-50
Stable but monitored
$120B+ sector bond issuance
This table summarizes spreads based on market data; Oracle stands out as the most repriced credit in large-cap tech.
Our Lean
This is the wild west of futures and options trading, and while I hate to keep saying the same thing, 2026 is going to be the year of increased volatility. Do I think the selloff is over? I doubt it, and that’s why I’ve been cautious.
Can the ES and NQ rally? Sure—but the uncertainty is ever-present. I know I’ve said I’ve been part of every market crash since 1980, and while I am not calling for that, it’s all about the headlines. The big question is: Can the ES and NQ hold the rallies? At this moment, the only thing I can say is—I doubt it.
Our lean: My advice is simple: trade less and pick your spots better. Sorry I don’t have more advice, but it may be a good time to reread yesterday’s OP, where I pointed out the 5 to 7-day winning streaks and the large gains.
Below are the AI levels I made:
Level
Range
R4 – Discovery Resistance
7,040 – 7,060
R3 – Major Resistance
7,000 – 7,010
R2 – VAH
6,985 – 6,995
R1 – Immediate Resistance
6,980 – 6,990
POC
6,950 – 6,960
Pivot Support
6,940 – 6,950
Intermediate Support
6,915 – 6,925
VAL
6,905 – 6,915
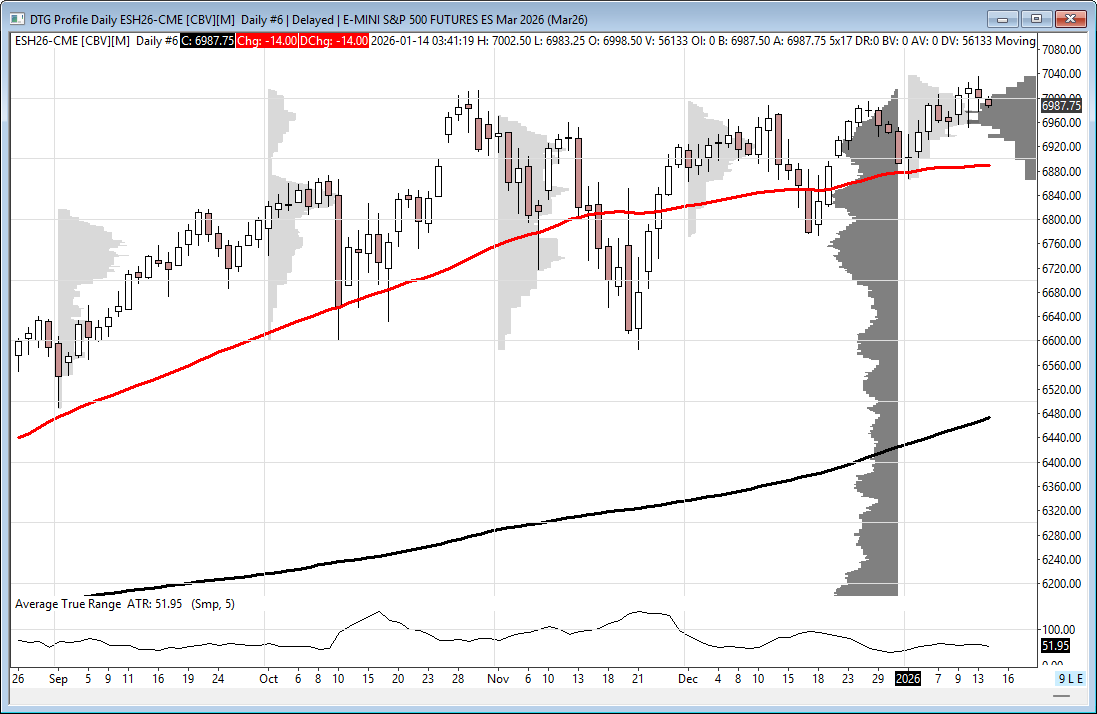
Market Recap
The ES traded down to 6998.75 and then rallied up to 7011.50 at 7:40 a.m. It traded 7005.25 at 8:25 a.m., then dropped to 7000.00 as the December core consumer prices rose at a 2.6% annual rate, less than expected. The ES then rallied up to 7036.25, sold off down to the VWAP at 7012.25 at 8:50, traded back up to 7027.50 at 9:26, then dropped down to 7016.00 just before the open.
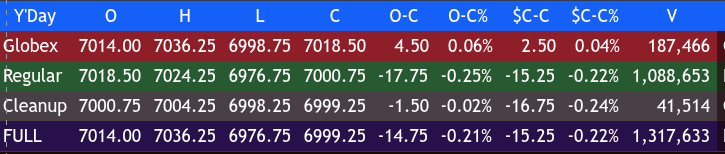
The ES opened Tuesday’s regular session at 7018.50, with 160k contracts traded. After the open, the ES traded up to 7024.25 at 9:40, then puked down to 6983.25 at 10:25. It rallied one tick above the VWAP up to 7005.75, sold off to a higher low at 6986.50 at 11:25, then rallied to 7015.25 at 11:55. It sold off again to another higher low at 6987.00 at 1:00, rallied to 6999.50 at 1:35, sold back down to another higher low at 6985.00 at 2:10, and rallied to 6995.25 at 2:55.
After 3:00, the ES started selling off again, making a new low at 6976.75 at 3:31. It then popped back up to 6986.50 at 3:40, 6988.50 at 3:45 and traded 6987.50 as the 3:50 cash imbalance showed $2.8 billion to buy. It rallied up to 7001.00 at 3:59 and traded 7000.75 on the 4:00 cash close. After 4:00, the ES traded up to 7004.25, then flatlined and settled at 7001.75, down 14.75 points or -0.21%.
The NQ settled at 25,960.00 (with a high of 26,045.50), down 50.55 points or -0.20%. The YM settled at 49,408, down 0.80%, and the RTY settled at 2,647.80, down 1.5 points or -0.06% on the day.
In the end, the markets:
-
Used up all their buying power after the CPI number.
-
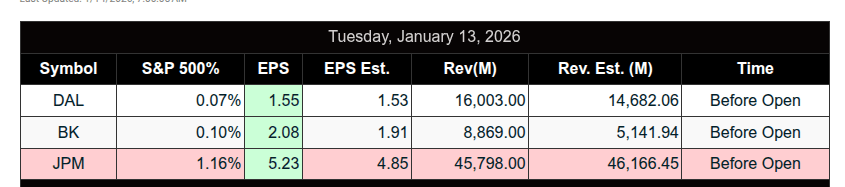
Reacted to JPM weakness after a quarterly earnings miss.
-
Were rattled by Iran preparing to execute/hang its first protester today and Trump’s threats.
In terms of the ES and NQ’s overall tone, the markets acted tight and spooked. In terms of the ES’s overall trade, volume was higher at 1.32 million contracts traded.
On Tap
-
Earnings: Bank of America, Wells Fargo, and Citigroup report.
-
Economic Reports (delayed reports):
-
8:30 a.m. – Retail Sales
-
8:30 a.m. – U.S. Producer Price Index
-
10:00 a.m. – U.S. Business Inventories, Existing Home Sales
-
-
Fed Speakers:
-
12:00 p.m. – Atlanta Fed President Raphael Bostic
-
12:30 p.m. – Fed Governor Stephen Miran
-
1:00 p.m. – Minneapolis Fed President Neel Kashkari
-
2:00 p.m. – Federal Reserve’s Beige Book
-
2:10 p.m. – New York Fed President John Williams (opening remarks)
-
Guest Posts
S&P 500 (ES)

Link to Full DTS Briefing Report >>> PTG Daily Trade Strategy 1.14.26
Nasdaq-100 (NQ)
Link to Full DTS Briefing Report >>> PTG Daily Trade Strategy 1.14.26
Thanks for reading, PTGDavid
MiM
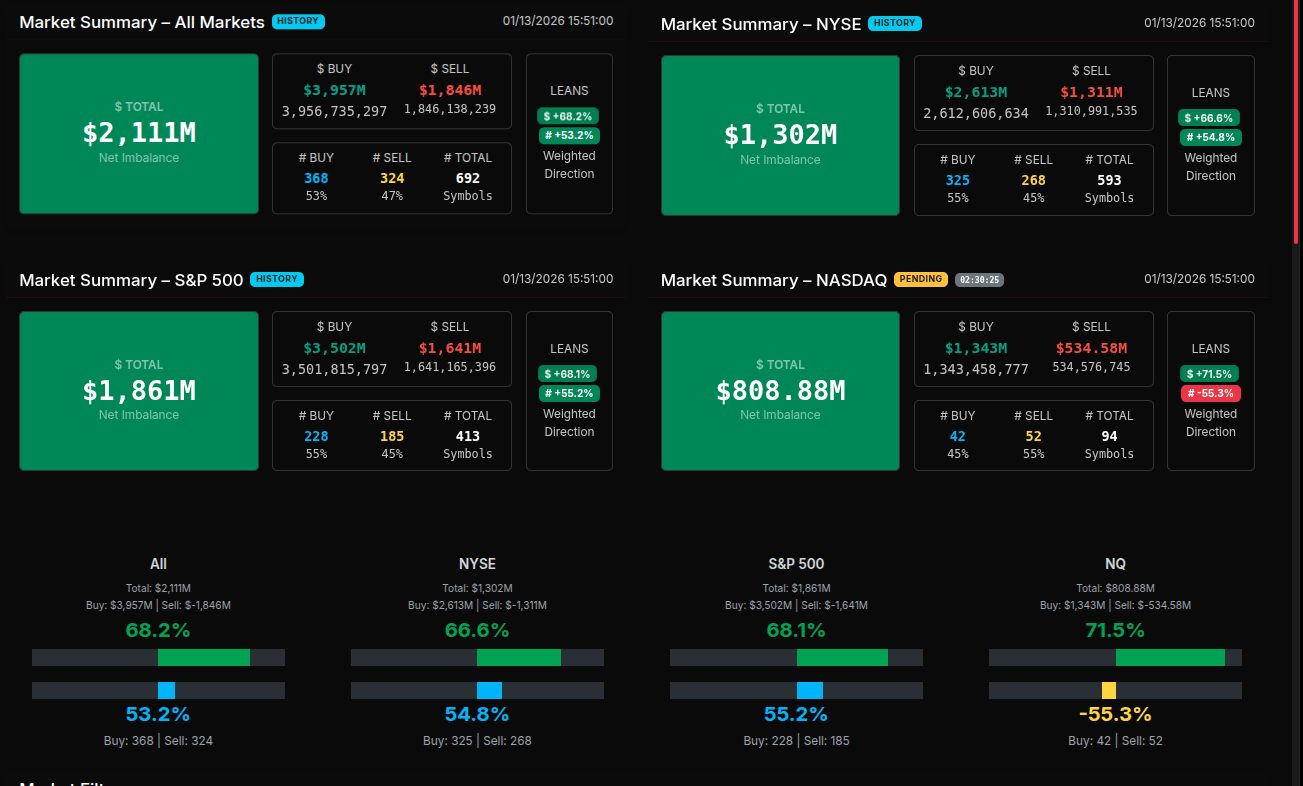
MOC Recap
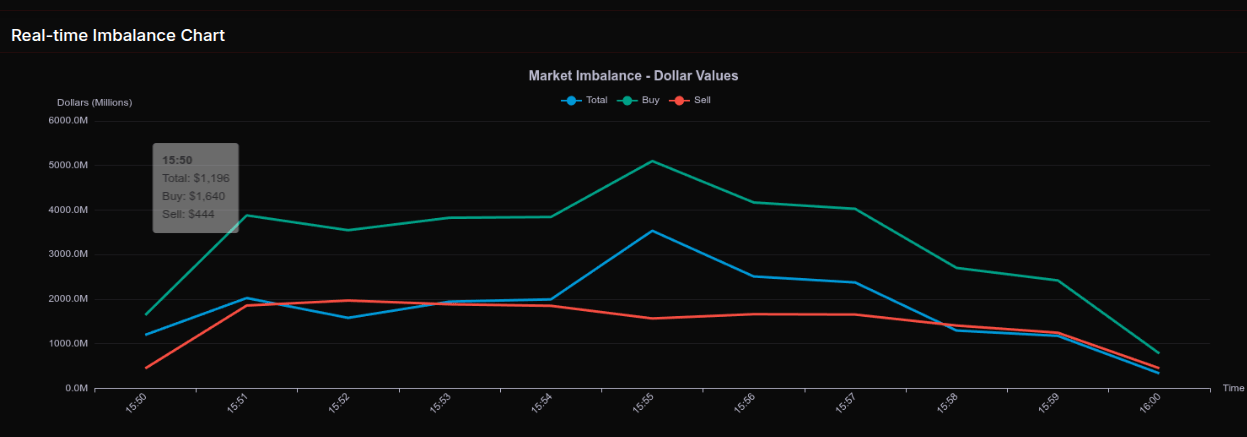
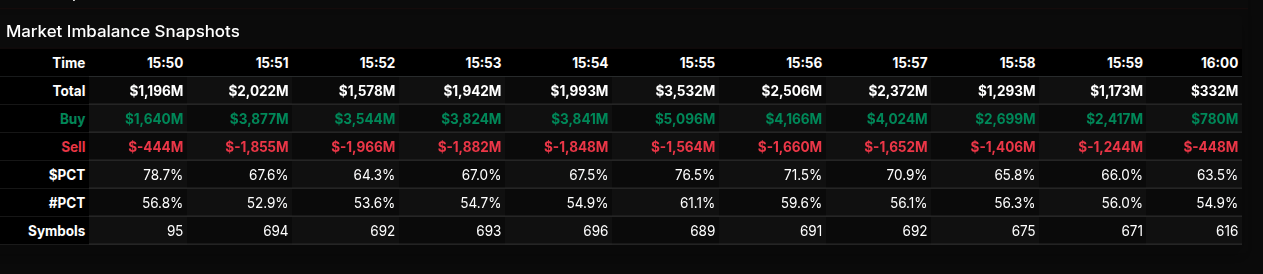
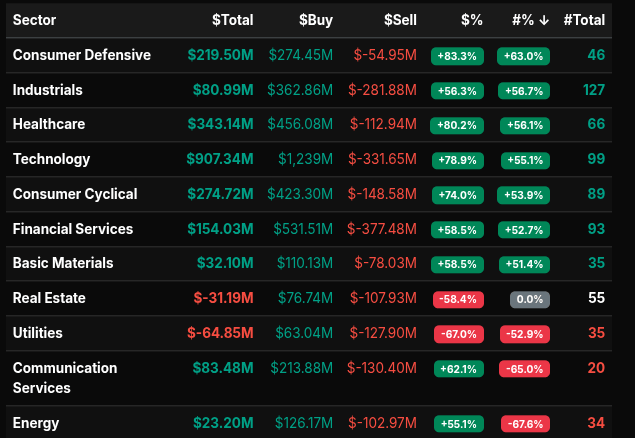
The market-on-close auction opened with a clear buy-side skew and held that tone throughout most of the 10-minute window, despite normal fluctuations in headline size. At 15:50, the imbalance registered just over $1.1B to buy, quickly expanding as buy interest accelerated into the 15:51–15:55 window. The peak occurred at 15:55, when total imbalance surged above $3.5B, driven by more than $5.0B in buy interest against roughly $1.6B in sell pressure. From there, the auction cooled but remained firmly positive into the close, finishing near $332M net to buy at 16:00.
Sector-level flows reinforced the constructive tone. Technology was the dominant buyer, posting a $907M net imbalance with a strong +78.9% buy skew, indicating broad, institutional accumulation rather than rotation. Healthcare followed with $343M net and an +80.2% lean, while Consumer Defensive also stood out with an +83.3% buy percentage—one of the most notable wholesale-style imbalances on the tape. Industrials, Consumer Cyclical, and Financial Services all showed healthy net buying with leans clustered in the mid-to-high 50% range, suggesting participation was widespread rather than narrowly concentrated.
On the other side, Utilities (-67.0%) and Real Estate (-58.4%) were the clearest sell-side outliers, reflecting ongoing yield sensitivity and defensive reallocation. Communication Services was mixed: positive in dollar terms but with a negative directional lean, pointing to internal rotation rather than outright accumulation.
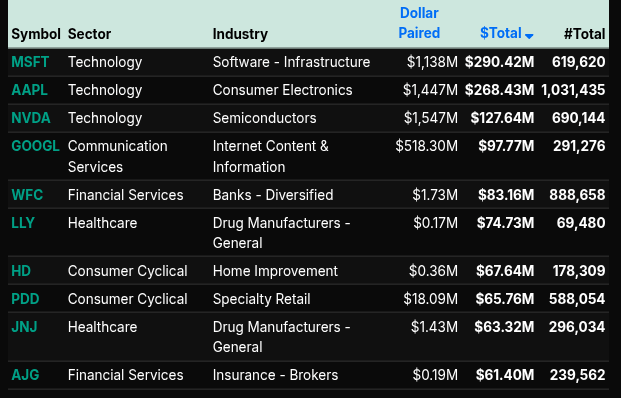
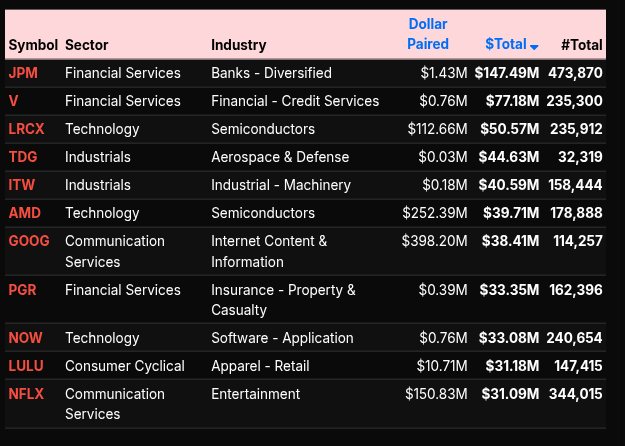
Single-name flow confirmed the sector picture. Mega-cap tech led the charge, with MSFT ($290M), AAPL ($268M), NVDA ($128M), and GOOGL ($98M) all posting sizable buy imbalances—classic index and benchmark-driven demand. Financials were anchored by JPM ($147M) and WFC ($83M), while semiconductors saw steady accumulation across AMD and LRCX.
Overall, symbol leans clustered above +66% across multiple sectors, signaling institutional buy programs rather than tactical rebalancing. The auction closed as a net positive event, reinforcing the broader risk-on tone into the next session.
Technical Edge
Fair Values for January 14, 2026:
-
SP: 37.07
-
NQ: 160.12
-
Dow: 202.22
Daily Market Recap 📊
For Tuesday, January 13, 2026
• NYSE Breadth: 45.5% Upside Volume
• Nasdaq Breadth: 47.9% Upside Volume
• Total Breadth: 47.6% Upside Volume
• NYSE Advance/Decline: 53.4% Advance
• Nasdaq Advance/Decline: 43.9% Advance
• Total Advance/Decline: 47.4% Advance
• NYSE New Highs/New Lows: 237 / 28
• Nasdaq New Highs/New Lows: 352 / 126
• NYSE TRIN: 1.41
• Nasdaq TRIN: 0.82
Weekly Market 📈
For the week ending Friday, January 9, 2026
• NYSE Breadth: 58.7% Upside Volume
• Nasdaq Breadth: 57.6% Upside Volume
• Total Breadth: 58.0% Upside Volume
• NYSE Advance/Decline: 73.6% Advance
• Nasdaq Advance/Decline: 71.6% Advance
• Total Advance/Decline: 72.3% Advance
• NYSE New Highs/New Lows: 414 / 89
• Nasdaq New Highs/New Lows: 701 / 246
• NYSE TRIN: 1.90
• Nasdaq TRIN: 1.81
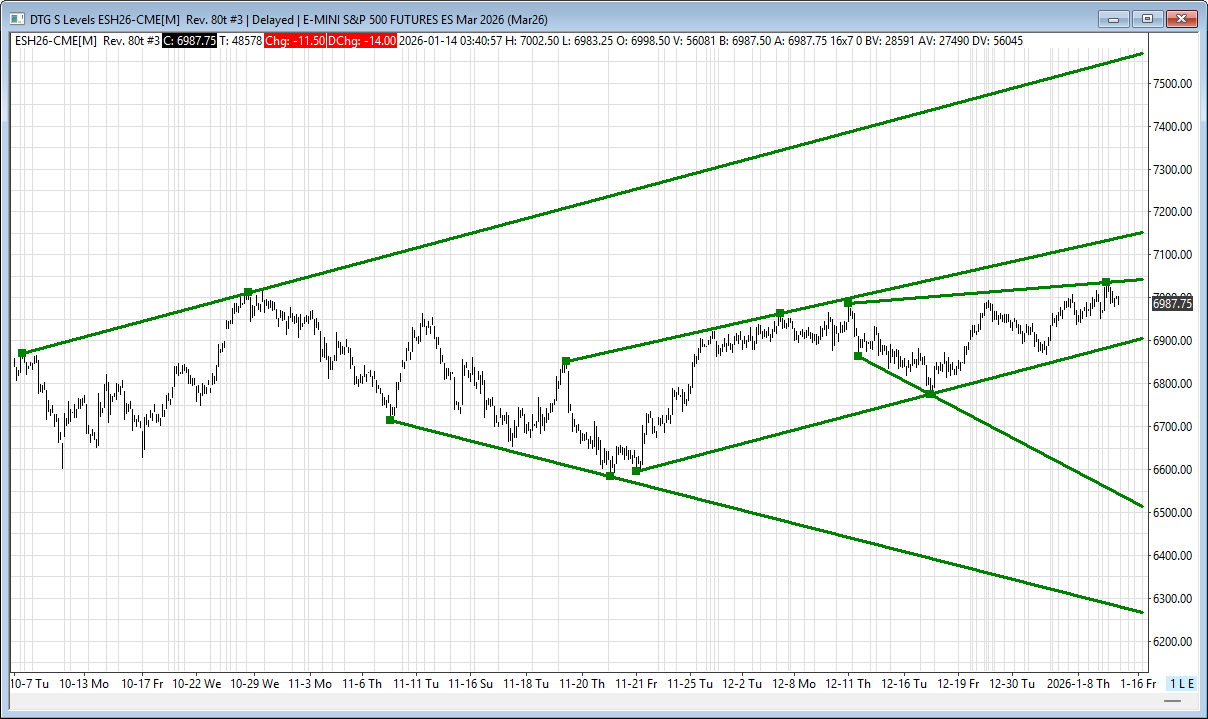
ES H Levels
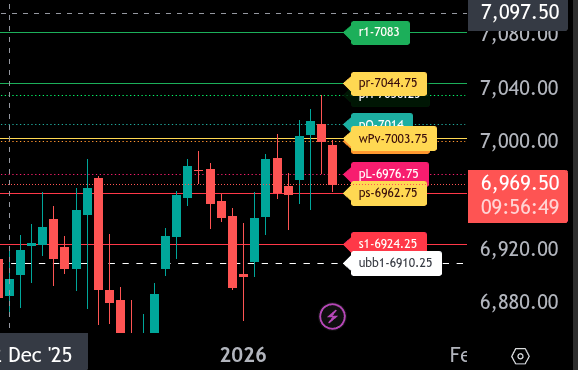
The bull/bear line for the ES is at 7003.75. This is the key pivot for today and defines directional bias.
ES is currently trading near 6969.75 in the Globex session, holding below the bull/bear line. Acceptance below 7003.75 keeps pressure to the downside and favors selling rallies rather than chasing strength.
On the downside, initial support sits at 6976.75, followed by 6962.75, which is the lower range target. A failure to hold 6962.75 opens the door for continuation toward 6924.25. A break and acceptance below 6924.25 would signal broader weakness.
On the upside, resistance is layered at 7014.00 and then 7036.25. Above that, 7044.75 is the upper range target. Bulls need a clean reclaim and hold above 7003.75 to shift momentum and target these higher levels.
Overall, the ES remains bearish below 7003.75. Only sustained trade back above the bull/bear line would neutralize downside risk and put the upside range targets back in play.
NQ H Levels
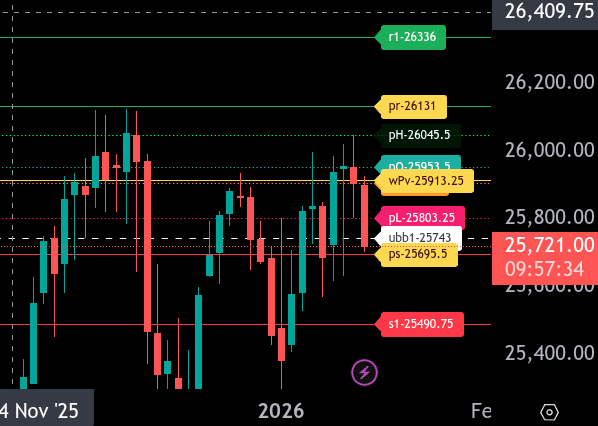
The bull/bear line for NQ is at 25,913.25. This is the key pivot for today and defines directional bias.
NQ is trading around 25,709.25 in the Globex session, well below the bull/bear line, keeping the tone bearish early. As long as price remains below 25,913.25, sellers remain in control.
On the downside, initial support sits at 25,695.50. A failure to hold 25695.50, the lower range target, opens the door for a test of 25,490.75. Acceptance below that level risks further liquidation.
On the upside, resistance comes in at 25,803.25, then 25,953.50. A reclaim of 25,913.25 is required to shift the bias higher, which would target 26,045.50 and then 26,131.00, the upper range target. Above 26,131.00, extension toward 26,336.00 is possible.
Overall, NQ remains bearish below 25,913.25. Bulls need a sustained reclaim and hold above this level to negate downside risk and re-open the upper range targets.
Calendars
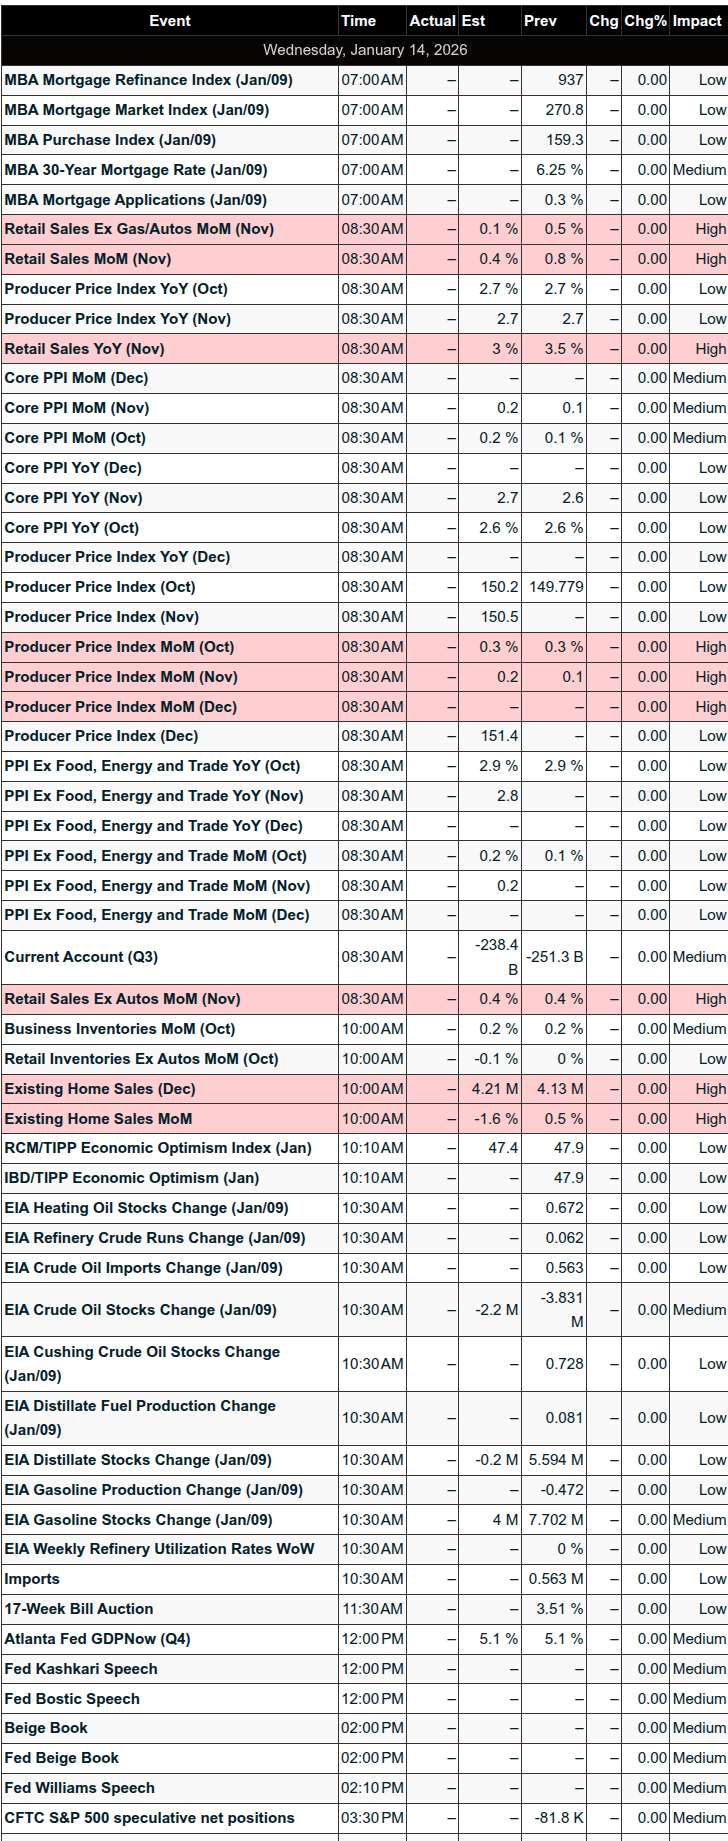
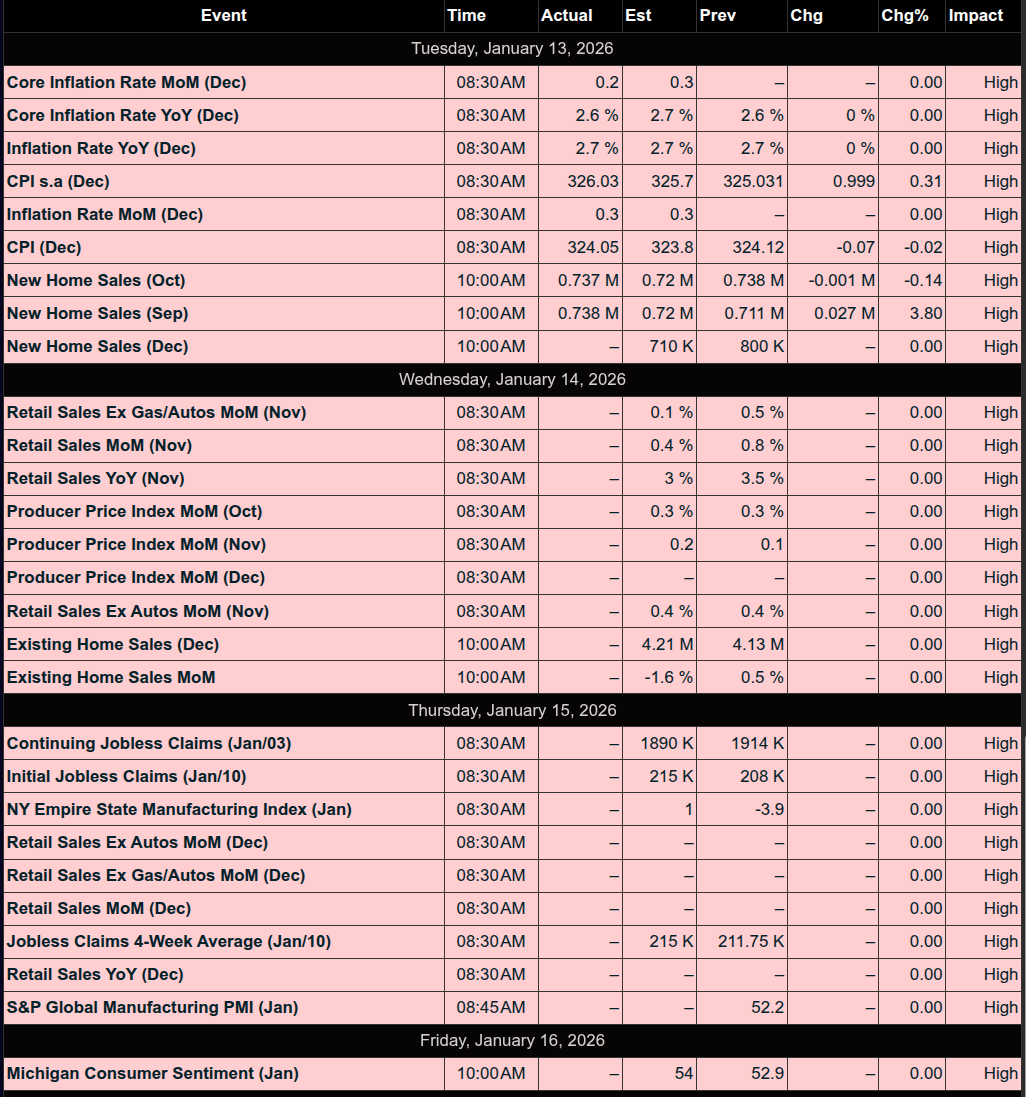
Economic
Today
Important Upcoming / Recent
Earnings – SP500
Upcoming
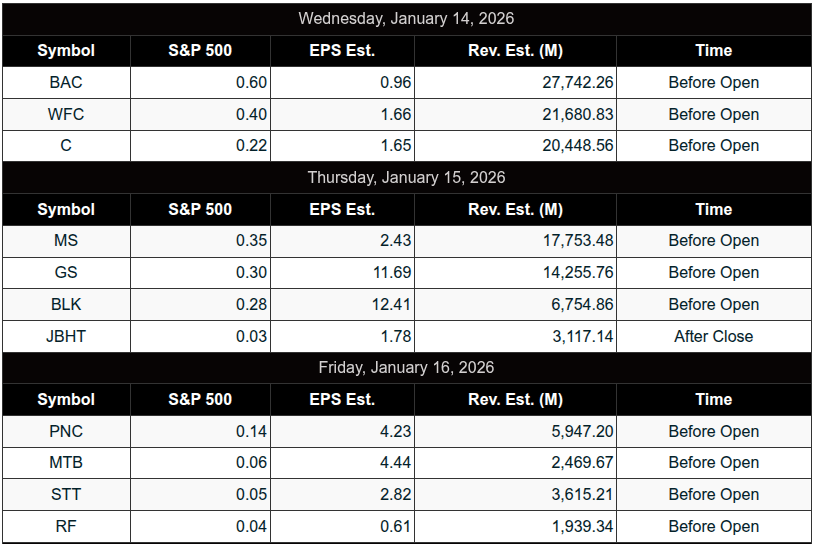
Recent
Trading Room Summaries
Polaris Trading Group Summary – Tuesday, January 13, 2026
Tuesday’s session in the PTG trading room, led by PTGDavid, was a clear demonstration of technical discipline and level-based execution. The market followed the Cycle Day 3 framework well, with precise reactions around key areas — especially the Line in the Sand (LIS) at 6995, which acted as both support and resistance throughout the day. The majority of high-probability trades developed in the morning session, with the afternoon offering a few deep pushes but also reinforcing an important PTG principle: know when to walk away.
Morning Session Recap:
-
Strong Open Reaction at D-Level:
Early in the session, the market delivered a “monster reaction” from an upper D-level, which set the tone for the day. DanV noted this level had responded consistently since the beginning of the year, and traders were able to capitalize on it. -
6995 Identified as Key Pivot (LIS):
David marked 6995 as the Line in the Sand, and price respected this level multiple times. It became the center of the trading “sandbox.”-
🔺 Bullish Scenario: Holding above 6995 targeted 7015–7025.
-
🔻 Bearish Scenario: Holding below 6995 targeted 6985–6975.
-
-
CPI Ramp Hit All Upside Targets:
During the morning ramp, all upside levels were fulfilled cleanly per the DTS Briefing, allowing traders to take profits and prepare for potential rotation. -
Shift to Bear Case Played Out Cleanly:
After price dropped back below the LIS, the bear scenario began to unfold. Price tagged the 6985 target and bounced right back to 6995 — a textbook technical reaction, and a great opportunity for those watching the levels closely. -
Reclaim of 6995 Provided Long Setup:
Around 11:16 AM, bulls reclaimed 6995. David identified this as a fresh long trigger, supported by the central pivot zone and a fair value gap on the 60-minute chart — an ideal area for dip-buyers to engage.
Lessons Reinforced:
-
Inventory Repricing Insight:
David explained that long positions initiated at higher prices had been flushed and replaced at lower levels — setting up the “official jam higher” as the market reloaded for another push. This gave traders a valuable look into how professional positioning works beneath the surface. -
Morning is Prime Time:
As the day wore on, David reminded traders that 90% of the best setups tend to occur in the morning — and that continuing to trade deep into the afternoon often leads to giving back profits.
Afternoon Developments:
-
Deep Sell-Off to Lower Targets:
The bear case deepened in the afternoon. Price dropped to and through the 6980 and 6975 targets, and even moved into the 6955–6950 zone — all levels laid out earlier in the session. -
RED ALERT Issued:
At 3:32 PM, David declared “RED ALERT” as 6980 was tagged, followed shortly by 6975 — a clear confirmation of the bearish path playing out in full. -
MOC Buy Imbalance Noted:
A large $2.8 billion MOC buy imbalance was recorded near the close, potentially setting the stage for today’s open.
Closing Notes:
-
David confirmed an official Positive 3-Day Cycle at the close.
Discovery Trading Group Room Preview – Wednesday, January 14, 2026
-
Key Focus:
Markets are watching for a Supreme Court ruling on the legality of Trump-era tariffs under the National Security Act. A ruling against them could force ~$100B in refunds and impact future trade policy. Meanwhile, corporate earnings and economic data releases are also in focus.Tariff Watch:
-
Treasury data shows a decline in tariff revenue for the second straight month ($27.89B in Dec vs $31.35B peak in Oct).
-
Despite record collections in 2025 ($264B), the U.S. ran a $602B Q1 deficit.
-
CBO has slashed its 10-year tariff revenue estimate by $1T.
-
Trump claims tariffs would fund military, citizen payments, and other programs.
Macro Headlines:
-
Global central banks reaffirm support for Fed independence after Trump’s critical remarks on Powell.
-
Gold and silver hit record highs on Fed concern.
Corporate/Earnings:
-
Saks Global (Saks Fifth Avenue, Neiman Marcus) files for bankruptcy amid debt and market headwinds.
-
Premarket earnings: BAC, C, WFC.
-
Scheduled today: INFY, BLK, JBHT, MS, TSM, GS.
Economic Calendar (ET):
-
8:30am: PPI (Oct/Nov), Retail Sales, Current Account
-
10:00am: Business Inventories, New Home Sales
-
10:30am: Crude Oil Inventories
-
2:00pm: Fed Beige Book
-
Fed Speakers: Paulson (9:50), Miran (10:00), Bostic & Kashkari (12:00), Williams (2:10)
Market Levels & Volatility:
-
ES ADR: 58 pts, moderate vol. Volatility could rise on SCOTUS or data surprises.
-
ES Key Levels:
-
Resistance: 7038/41, 7147/52, 7570/75
-
Support: 6907/12, 6505/00, 6260/55
-
50-day MA (6889.50) currently out of play
-
Whale Activity: None significant overnight.
-
Affiliate Disclosure: This newsletter may contain affiliate links, which means we may earn a commission if you click through and make a purchase. This comes at no additional cost to you and helps us continue providing valuable content. We only recommend products or services we genuinely believe in. Thank you for your support!
Disclaimer: Charts and analysis are for discussion and education purposes only. I am not a financial advisor, do not give financial advice and am not recommending the buying or selling of any security.
Remember: Not all setups will trigger. Not all setups will be profitable. Not all setups should be taken. These are simply the setups that I have put together for years on my own and what I watch as part of my own “game plan” coming into each day. Good luck!
This post goes out as an email to our subscribers every day and is posted for free here around 2 PM ET. To get your real-time copy, sign up for the free or premium version here: Opening Print Subscribe.
Comments are closed