This post goes out as an email to our subscribers every day and is posted for free here around 2 PM ET. To get your real-time copy, sign up for the free or premium version here: Opening Print Subscribe.
DAVOS Pending
Follow @MrTopStep on Twitter and please share if you find our work valuable!
FREE Two-Week Offer for the Opening Print Premium. Open up the Lean and other premium features for the next Two Weeks!
Our View
The markets are “spooked.” On the one-year anniversary of his second inauguration, President Trump made a lengthy, unannounced appearance at the White House press briefing alongside Press Secretary Karoline Leavitt. It went on for over an hour. He arrived late, carrying a thick stack of papers — including mugshots — and jumped between topics like immigration enforcement, his accomplishments, foreign policy, Greenland, tariffs, NATO, and more.
He talked about hotels and winter-themed amusement parks he wants to build in Greenland, threatened French President Macron with a 200% tariff on wines and champagnes over disagreements on a proposed “Board of Peace” for Gaza and other conflicts, and claimed he had settled “eight wars” and “should have gotten the Nobel Prize for each war.”
I seriously do not know what’s going on, but Trump has a major public appearance scheduled for today, where he will deliver a special address at the World Economic Forum (WEF) annual meeting in Davos, Switzerland — scheduled from 8:30 AM to 9:30 AM ET.
The world is watching!
Our Lean
I know everyone wants to blame Trump for the selloff, but Japanese long-dated bond yields hit record highs at 3.58%, the highest since Japan introduced the 30-year debt in 1999 — and gold is up another $70.00 tonight. This is what I call CNW: crazy, nuts, and wild.
The market is up so much, some traders are saying the highs are in. I think it’s all eyes on Trump’s speech this morning — and keep an eye on US and global yields.
There is definitely something going on, but does that mean the highs are in and there’s a crash coming? I don’t know. But what I can say is that the fast money is selling the rips, and clearly, there has been a lot of liquidation and hedging going on.
The other thing I know is that when the index markets close down hard, they tend to rally on Globex.
Our lean: The ES has been down 4 out of the last 5 sessions for a total of 187 points, and the NQ has also been down 4 out of the last 5 sessions, for a total loss of 827.50 points. I again don’t doubt the ES and NQ can bounce — I just don’t think they will hold.
Keep in mind there are multiple catalysts for the downside, and if there is a big gap down, it could initially get bought — especially after such a big drop yesterday.
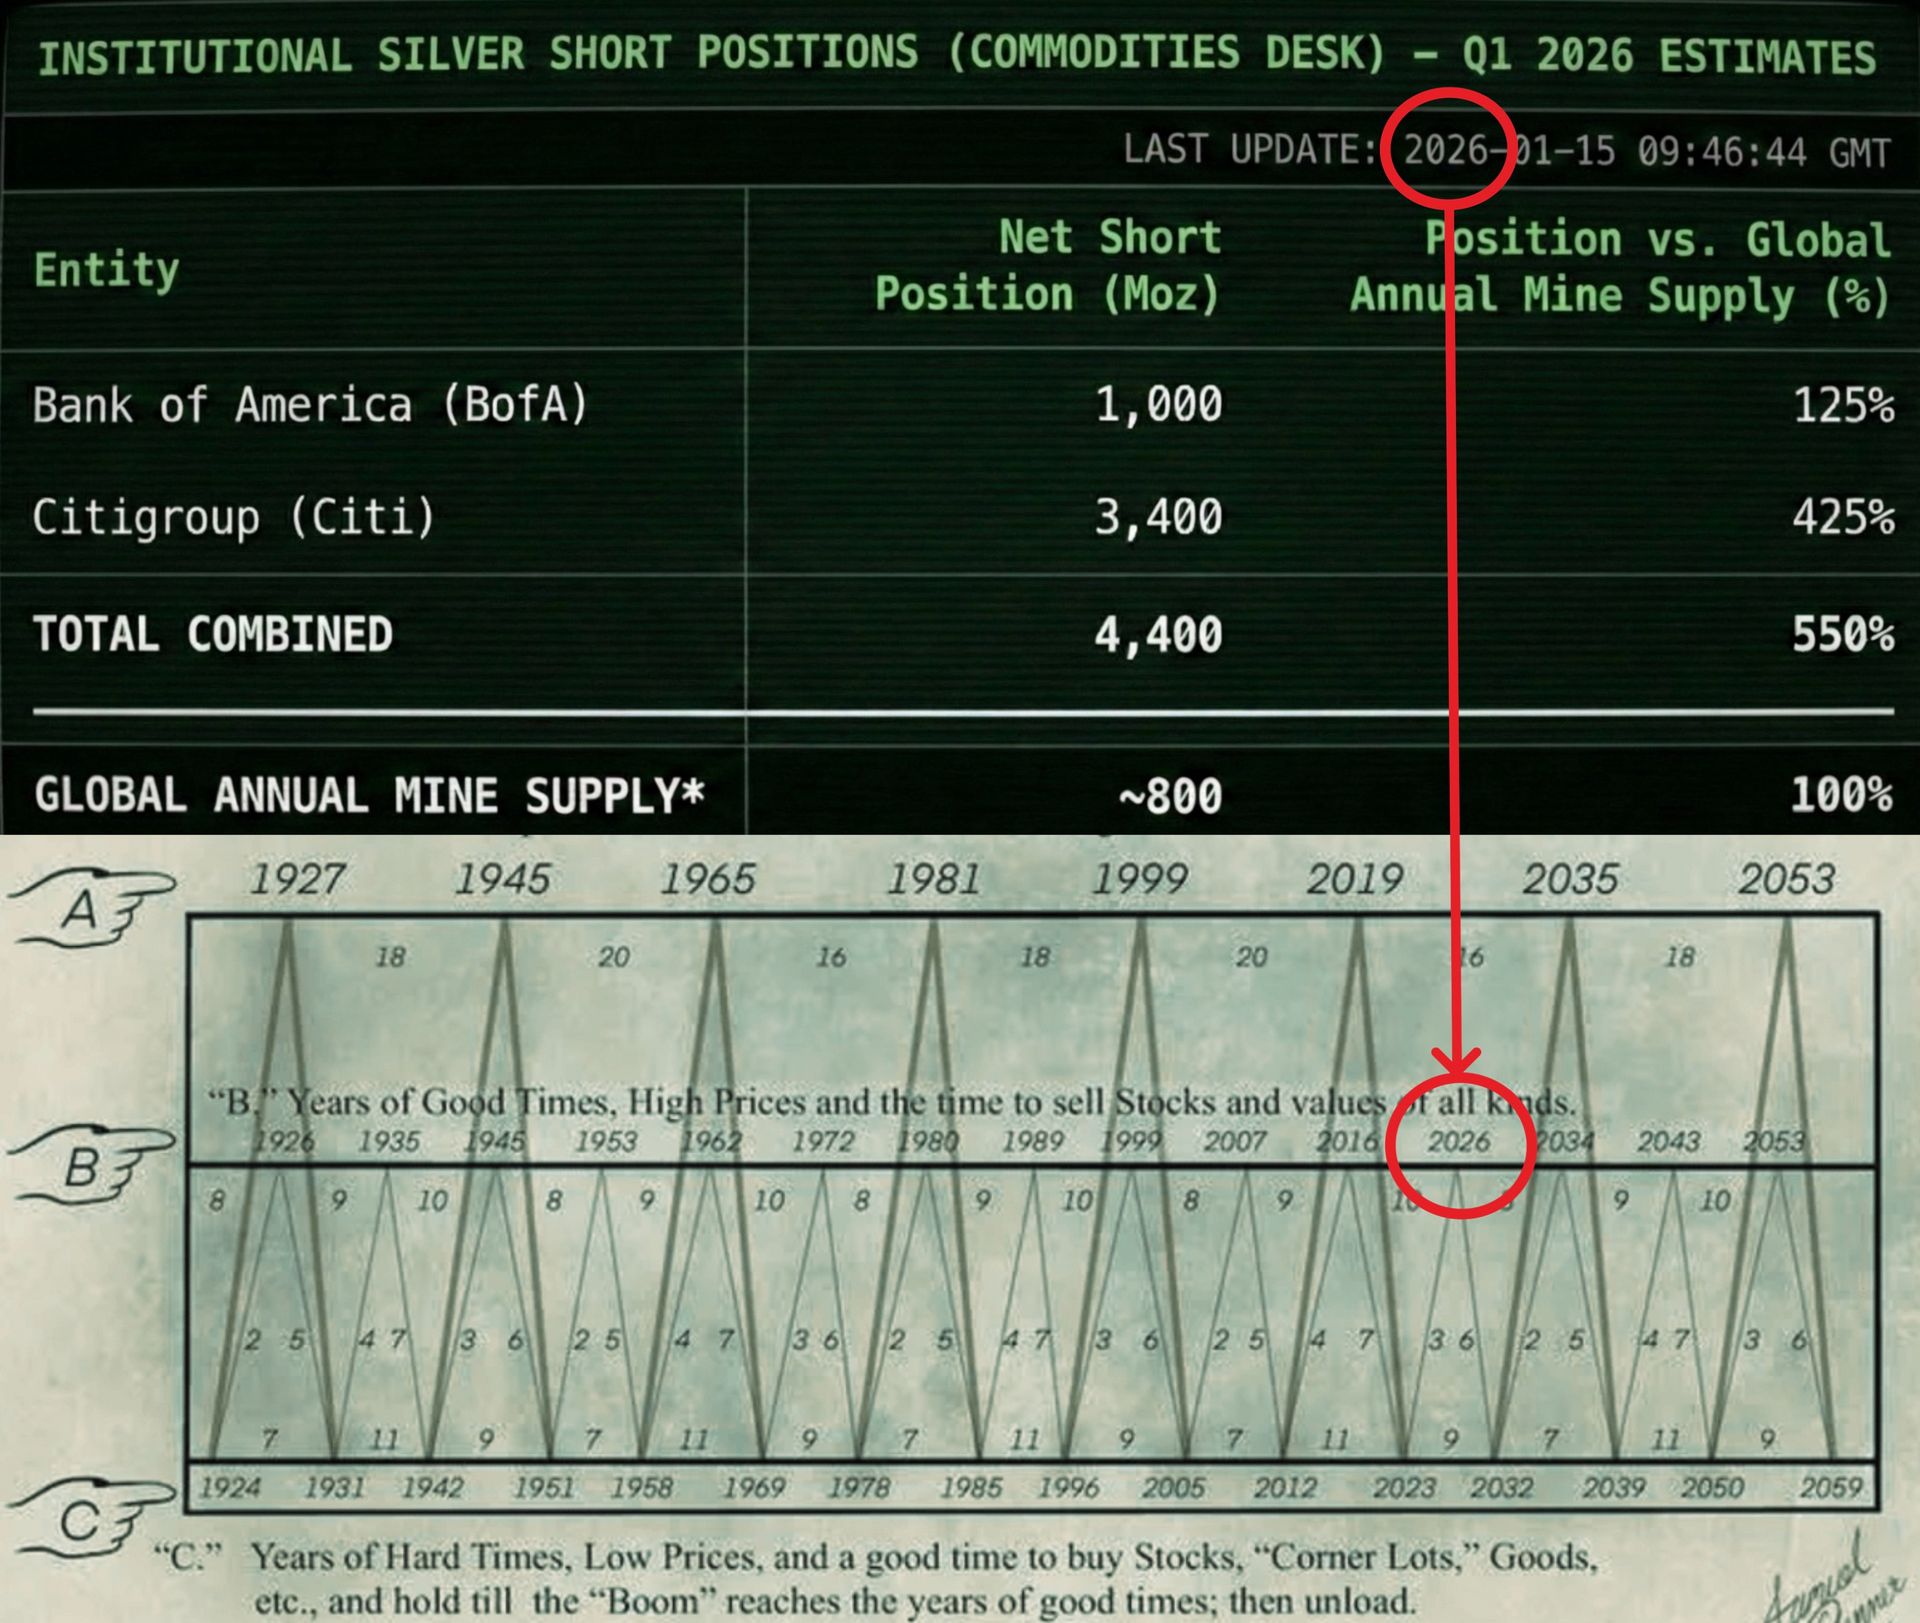
Silver…How High Can it Go? To Infinity and Beyond?
Market Recap
The ES traded down to 6946.75 on Globex and opened Tuesday’s regular session at 6871.75, down 41.50 points. After the open, the ES traded 6869.00, moved up to 6890.50 at 9:50, sold off down to 6865.50, then rallied up to 6905.00 at 10:40. It sold off back down to 6886.25, forming a double bottom at 11:05, rallied up to a lower high at 6903.25, and then sold off down to 6882.50 at 11:25.
It rallied to 6901.00, sold back off down to 6880.25 at 11:50, then rallied up to 6903.00 at 12:10. It pulled back to the VWAP at 6882.50 at 12:25, rallied again to a lower high at 6901.00 at 12:40, and sold off down to 6880.25. From there, it rallied to another lower high at 6896.75 at 1:00 and then sold off sharply down to 6836.50 at 1:50.
The market bounced up to 6849.25 at 2:00, sold off again to 6825.75 at 2:30, bounced to 6841.25 at 2:40, sold off to 6826.00, rallied to 6838.25, and then sold off sharply down to 6825.25. It traded up to 6834.25 and then made new lows at 6822.75.
The ES traded 6827.75 as the 3:50 cash imbalance showed $800 million to sell. It made a new low by one tick at 6822.50, rallied to 6833.00, retested the low, and closed at 6833.75 on the 4:00 cash close. After 4:00, the ES traded up to 6840.50 and settled at 6837.50, down 139.25 points or -2.00%.
The NQ settled at 25,142.75, down 546.25 points or -2.13%, hitting a one-month low. The YM settled at 48,730.00, down 817 points or -1.65%. The three major US index markets posted their largest drop since October 10th.
Everything Was Moving
-
US natural gas — the yield on the 10-yr note rose to a one-month high of 4.75
-
Natural gas soared to a three-week high, up more than 26% to 3.234.
-
Gold (GCG26) traded up to 4,787.80 and settled at 4,782.90, up 171.10 points or +3.71%, its highest price ever.
-
Silver (SIH26) traded up to its highest price ever at 95.780 and settled at 94.636, up 6.099 or +6.89%.
-
The dollar index (DXY) made a low at 99.01 and settled at 99.39, down 0.75 or -0.75%.
In the end, it was all about dead cat bounces and Trump’s non-stop babble late in the day. In terms of tone, both the ES and NQ were weak. As for the ES’s overall trade, volume ended up at 2.31 million — the largest since 12/16 during the rollover.
On Tap
-
8:30 AM – Trump’s speech at the World Economic Forum: World Economic Forum – Geo-Economics and Politics
-
10:00 AM – Construction Spending (delayed report) and Pending Home Sales
-
After the close – Earnings from $IBM and $TXN
Guest Posts
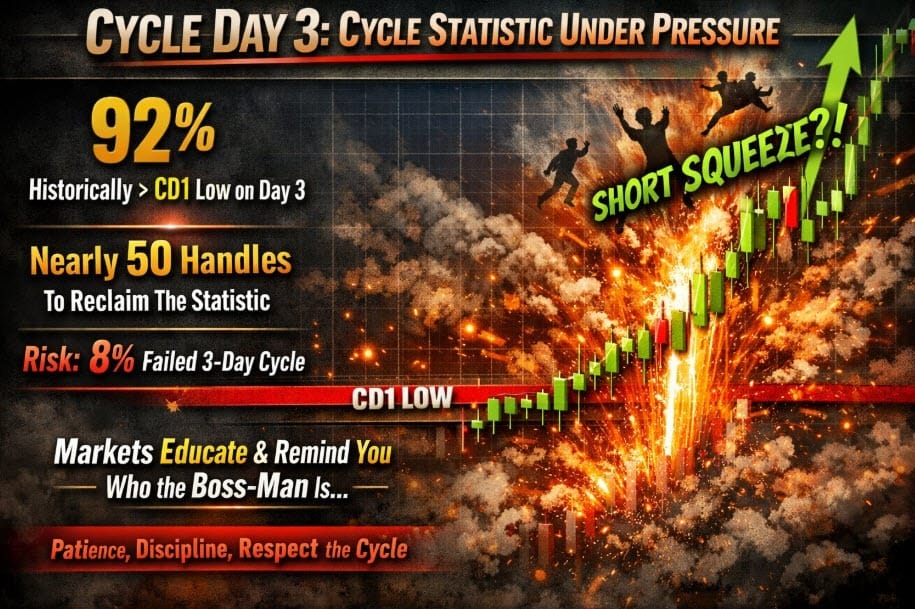
Transition into Cycle Day 3: Cycle Statistic Challenge
Currently the Three-Day Cycle Statistic stands @ 92%. Meaning Price is Greater Than (above) the Cycle Day 1 Low on Cycle Day 3.
Price will need to recover nearly 50 handles to secure the statistic or risk a rare (8%) failed 3-day cycle. Do not rule out an explosive ripper short-squeeze on this cycle day. Markets have a unique way of getting the most traders wrong-footed, then teaching them who is the “boss-man”.
Protect inventory. Let others overtrade.
There’s always another cycle coming.
— PTG
S&P 500 (ES)
🎯 Cycle Day 3 Focus
Scenarios to consider for today’s trading.
🟢 Bull Case
-
Hold north of 6845 +- 5 pts targets 6865…6875…6885
🔴 Bear Case
-
Hold south of 6845 +- 5 pts targets 6830…6825…6820
PVA High Edge = 6883 PVA Low Edge = 6822 Prior POC = 6831
Link to Full DTS Briefing Report >>> PTG Daily Trade Strategy 1.14.26
Thanks for reading, PTGDavid
From Jeff Hirsch Stock Trader’s Almanac
Seasonal Patterns Suggest choppy Upside After Mid-
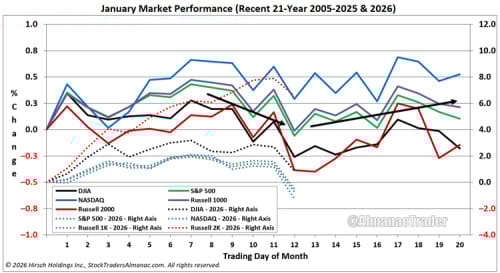
As of today’s close, Russell 2000 is still clearly leading this January, up an impressive 6.59% even after today’s decline and there are still eight trading days remaining. Due to the sizable Russell 2000 gains this month, January 2026 has been plotted on the right vertical axis in the accompanying chart. Compared to a Russell 1000 loss of 0.47%, small caps are outperforming by 7.06% for a solid “January Effect” (pages 112 & 144 of STA).
It is encouraging to see this seasonal tendency holding up even as S&P 500, NASDAQ, and Russell 1000 are now negative year-to-date as a result of today’s declines. Even today’s weakness is not uncommon for the Tuesday following Martin Luther King, Jr. holiday. However, over the last 21 years, January’s low has tended to arrive around the 12th trading day of the month. If that is the case this year, then the market could start climbing choppily higher soon.
Follow jeffhirsch.tumbler.com
Technical Edge
Fair Values for January 21, 2026:
-
SP: 31.67
-
NQ: 135.49
-
Dow: 166.58
Daily Market Recap 📊
For Tuesday, January 20, 2026
• NYSE Breadth: 27% Upside Volume
• Nasdaq Breadth: 38% Upside Volume
• Total Breadth: 36% Upside Volume
• NYSE Advance/Decline: 22% Advance
• Nasdaq Advance/Decline: 27% Advance
• Total Advance/Decline: 25% Advance
• NYSE New Highs/New Lows: 110 / 61
• Nasdaq New Highs/New Lows: 167 / 195
• NYSE TRIN: 0.68
• Nasdaq TRIN: 0.61
Weekly Market 📈
For the week ending Friday, January 16, 2026
• NYSE Breadth: 53% Upside Volume
• Nasdaq Breadth: 56% Upside Volume
• Total Breadth: 55% Upside Volume
• NYSE Advance/Decline: 63% Advance
• Nasdaq Advance/Decline: 54% Advance
• Total Advance/Decline: 57% Advance
• NYSE New Highs/New Lows: 481 / 62
• Nasdaq New Highs/New Lows: 754 / 290
• NYSE TRIN: 1.50
• Nasdaq TRIN: 0.89
Trading Room Summaries
Polaris Trading Group Summary – Tuesday, January 20, 2026
Tuesday’s trading session was a strong and action-packed Cycle Day 2, filled with technical precision, disciplined execution, and several excellent trade opportunities—particularly in ES. The day highlighted the effectiveness of sticking to predefined levels, the power of delta confirmation, and the value of tools like the DLMB (D-Level Money Box). Traders navigated market volatility with success, especially in the morning session.
Key Trades & Setups:
-
Manny’s Standout Execution:
-
Plan-Driven Trading: Manny came in with a clear plan focused on support buys around ES 6857–6861 / SPX 6825, triggered by delta flipping positive and seller failure.
-
Results:
-
+5 pts early on the first support buy setup.
-
+8 pts at ES 6971 shortly after.
-
Explosive follow-up: +10 and +15 pts from the same support zone as price retested the level.
-
-
Lesson: Manny emphasized this wasn’t knife-catching, as the bounce off 6846 already established buyer defense—excellent discipline and context awareness.
-
-
PTGDavid on Crude Oil (CL):
-
CL trade hit profit as stop trail was elected, leading to a “very nice positive outcome.”
-
Emphasis on backtest of PL 6887.50 holding beautifully, showcasing textbook level respect and planning.
-
-
Cycle Day 2 Deep Violation Reversal (NQ):
-
David identified precise CD2 reversal from Lower Violation Level (25101.29).
-
Suggested CALL options for plays off these deep tests—a great lesson in how to structure lower-risk entries on volatile CD2s.
-
Lessons & Tools:
-
DLMB (D-Level Money Box) was a hot topic:
-
David dropped a new video tip showing settings and measuring techniques.
-
Used effectively to capture stop runs above/below pivots throughout the session, especially with M&M’s triggering false breakouts.
-
Traders were encouraged to “Measure Twice…Cut Once” with DLMB.
-
-
Market Context:
-
David noted the bulls struggled with downside continuation later in the day: “No more soap bar…It’s Black Ice Slippery.”
-
MOC (Market-on-Close) imbalance games saw swings from $3B Sell → $860M Sell → $800M Buy. A reminder of late-day volatility risks.
-
-
Cycle Day Clarification:
-
With Monday closed, Friday’s low was used for CD1 references.
-
David clarified he often uses futures for cycle references and treats the missing equity day as a “ghost low.”
-
Summary:
Yesterday showcased disciplined plan execution, especially from Manny, with solid use of delta confirmation and levels. PTGDavid’s guidance on CL, NQ reversals, and the DLMB tool added significant value. The community engaged meaningfully, and key lessons on trading CD2 dynamics, stop runs, and respecting measured levels were front and center. An excellent day for learning and booking gains.
Discovery Trading Group Room Preview – Wednesday, January 21, 2026
-
Macro Focus:
Markets are fixated on President Trump’s WEF Davos speech (8:30am ET), geopolitical turmoil over his Greenland ambitions, rising Japanese debt fears, and a key Supreme Court case challenging Fed independence.-
Trump vs. Greenland: Trump’s continued push for Greenland spurred trade tensions and tariff threats, unsettling global markets. European leaders remain critical.
-
Japan Debt Crisis: Japanese sovereign debt turmoil is spilling into global markets, driving long-dated Treasuries and the USD lower. Broad fears of global debt debasement are growing.
-
Gold & Commodities Surge: In response to uncertainty, gold, silver, platinum, and copper are surging. Poland plans to purchase 150 tons of gold; Bolivia resumes gold buying.
Federal Reserve Independence in Spotlight:
The Supreme Court hears arguments today on Trump’s attempt to fire Fed Governor Lisa Cook, raising questions about the Fed’s political insulation.Earnings Season:
Despite 81% of S&P 500 companies beating Q4 expectations, market reactions are weak. Notable moves:-
3M (MMM): Beat estimates, shares -7%
-
State Street: -6.1%
-
Netflix (NFLX): -6% premarket
Premarket Earnings: HAL, JNJ, SCHW, TRV, TFC, ALLY, PLD, TEL, TDY
After the Bell: KMI, CACI
Thursday Morning: ABT, FCX, GE, PGEconomic Calendar: Light — Pending Home Sales and delayed Construction Spending (Sep/Oct) at 10:00am ET.
Market Technicals:
-
Volatility rose sharply on Tuesday amid a major equity selloff.
-
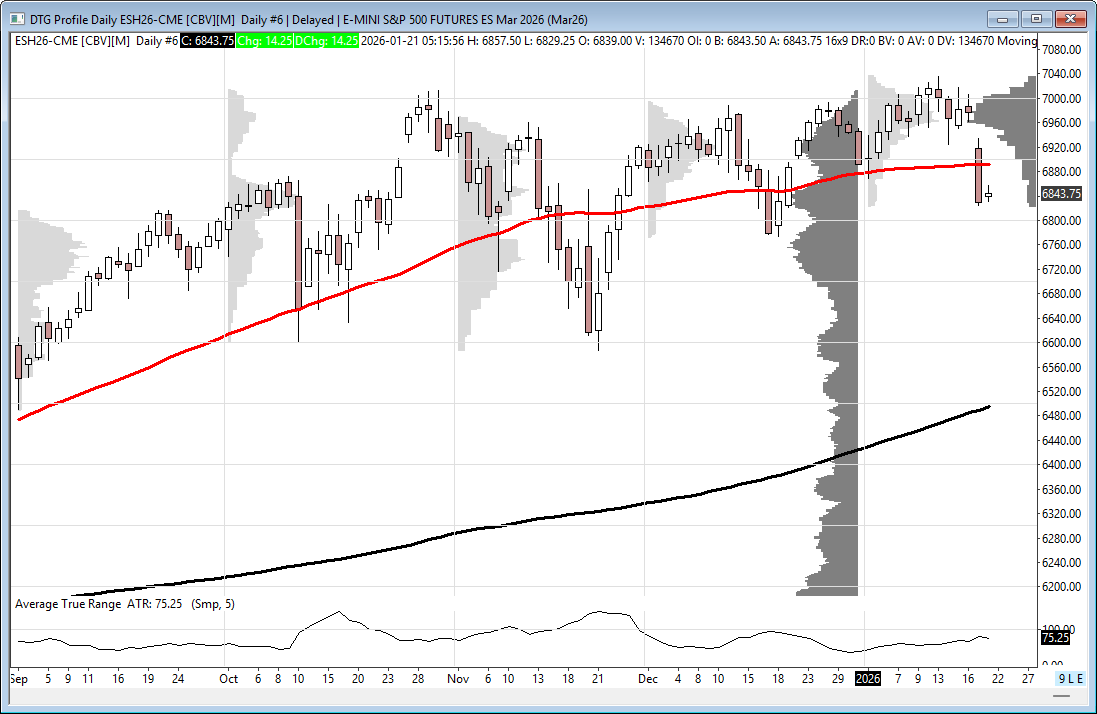
ES broke below 50MA (6891.75) and its short-term uptrend channel; trend has turned bearish.
-
Watching for potential snapback to 6935/40s.
-
Key resistance levels: 6935/40s, 7054/59s, 7187/92s
-
Key support levels: 6430/25, 6220/15s
Whale Flow: Bearish bias ahead of Trump’s WEF speech, with notable overnight volume.
-

Affiliate Disclosure: This newsletter may contain affiliate links, which means we may earn a commission if you click through and make a purchase. This comes at no additional cost to you and helps us continue providing valuable content. We only recommend products or services we genuinely believe in. Thank you for your support!
Disclaimer: Charts and analysis are for discussion and education purposes only. I am not a financial advisor, do not give financial advice and am not recommending the buying or selling of any security.
Remember: Not all setups will trigger. Not all setups will be profitable. Not all setups should be taken. These are simply the setups that I have put together for years on my own and what I watch as part of my own “game plan” coming into each day. Good luck!
This post goes out as an email to our subscribers every day and is posted for free here around 2 PM ET. To get your real-time copy, sign up for the free or premium version here: Opening Print Subscribe.
Comments are closed