This post goes out as an email to our subscribers every day and is posted for free here around 2 PM ET. To get your real-time copy, sign up for the free or premium version here: Opening Print Subscribe.
They Know the Earnings, We Know the Game
Follow @MrTopStep on Twitter and please share if you find our work valuable!
Our View
When I am wrong, I say I’m wrong — and that was the case yesterday. I concentrated on the ‘news’, and what didn’t seem to matter was the Japanese yen strengthening against the U.S. dollar. The USD/JPY exchange rate fell ~1–1.3%, closing around 153.93–154.09, with intraday lows near 153.73–153.98, marking one of its largest daily gains in recent months and pushing the yen to multi-month highs.
This rally was part of a nearly 3% two-session slide that was driven by speculation of potential coordinated U.S.-Japan intervention — the first in over 15 years — to curb excessive yen weakness. It was fueled by Japanese officials’ warnings, rate checks, close U.S.-Japan coordination signals, broad dollar weakness from trade/geopolitical risks (tariff threats), U.S. fiscal concerns (shutdown risks), and expectations of dovish Fed shifts.
I said to myself, “You would think,” but there is no thinking — because nothing matters anymore. The Fed’s switch from quantitative tightening to easing has eased the wheel.
Like the late-day drop and the $3.4 billion to sell, it just doesn’t matter.
I told the PitBull that the ES and NQ rallied big yesterday because “they” must know the earnings.
Our Lean
In most cases, when the ES rallies as much as it did over 20 hours, there is a tendency to pull back. In fact, I have a trading rule that says after a big rip, the ES tends to go sideways to lower the next day. But we live in interesting times, and I’m not sure that rule works so well anymore — and if it does, the pullback is fleeting.
Our lean: You can sell the early rallies and buy the pullbacks, or just be patient and buy the pullbacks.
We already know the probability of the Fed lowering rates this week is like 5%, so we can rule that out. But the only other thing to zero in on is Wednesday, when TSLA, META, and MSFT report after the close.
Ballooning deficits and higher rates are colliding faster than many expect
JP Morgan CEO Jamie Dimon delivered one of his bluntest warnings yet on the state of U.S. government finances, arguing that the nation’s rapidly growing debt load is simply “not sustainable.”
Speaking during a fireside chat with Carlyle cofounder David Rubenstein at a U.S. Chamber of Commerce event, Dimon cautioned that the U.S. cannot continue borrowing recklessly without serious consequences.
Key Takeaways
-
Debt is accelerating: The U.S. national debt stands near $38.4 trillion, with roughly $2 trillion added annually, putting total debt on track to exceed $40 trillion soon.
-
The pace is relentless: According to the Joint Economic Committee, debt has increased by nearly $8 billion per day over the past year — about $112,000 per person.
-
Interest is becoming a major budget strain: Analysts project interest payments alone could exceed $1 trillion by fiscal 2026, sharply limiting fiscal flexibility.
-
Economic pressure is building: Dimon warned that rising debt, higher interest costs, and market volatility are converging at a dangerous moment.
The Bigger Risk
Dimon described the U.S. economy as being squeezed by two powerful “tectonic plates”:
-
One domestic and policy-driven
-
The other global and far less predictable
If these forces collide, he warned, the impact could ripple through an already fragile financial system.
While AI-driven productivity gains may provide some long-term relief, Dimon and other experts remain cautious about whether innovation alone can offset the scale and speed of the current debt trajectory.
Guest Post: Tom Incorvia – Blue Tree Strategies
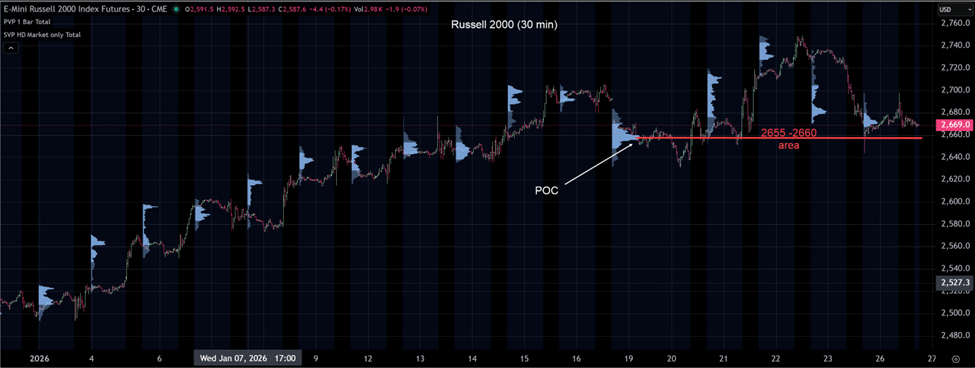
This week I’m shifting focus to the Russell 2000, which has demonstrated relative strength versus both the S&P 500 and the Nasdaq. From a technical standpoint, small caps have been leading on a comparative basis, a condition that often supports continuation rather than distribution.
On Monday, January 19th, price established a well-defined high-volume area. Technicians recognize these zones as important reference points, as they often evolve into areas of both support and resistance. Subsequent price action confirmed this, with multiple tests of the level met by responsive demand, suggesting acceptance and buyer sponsorship.
From here, the intermediate trend remains constructive, and the technical bias favors looking for long opportunities on pullbacks toward value. That said, a decisive violation of the 2655–2660 area would signal a failure of demand at a key reference point and increase the probability of a corrective phase.
You can purchase Tom’s Course on Volume Profile here.
Market Recap
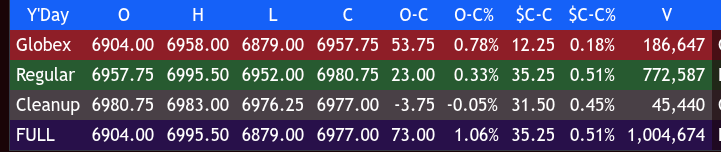
After trading down to 6880.00 on Globex, the ES rallied all the way up to 6958.00 at 9:28 and traded 6958.75 on the 9:30 ET futures open. After the open, the ES sold off down to 6952.00 and then rallied up to 6988.00 at 10:15, exactly 100 points off the Globex low.
The ES pulled back to 6976.00 at 10:40, then rallied up to a lower high at 6976.25. It pulled back again to 6975.75 at 11:20, then rallied up to a new high at 6991.00 at 12:05. After that, it did a sideways to lower back-and-fill and traded down to 6982.75 at 1:05.
From there, the ES rallied up to a new high at 6995.25 at 1:30, then pulled back to 6987.25 at 1:45. It rallied up to a lower high at 6993.50 at 2:40, pulled back to 6987.75 at 3:15, and traded back up to 6989.75 as the 3:50 cash imbalance showed $3.4 billion to sell. The ES then traded down to 6979.50 and traded 6980.75 on the 4:00 cash close. After 4:00, the ES traded down to 6977.50, rallied up to 6983.75, and settled at 6981.25, up 35.50 points or +0.51%.
The NQ settled at 25,848.50, up 110.25 points or +0.43%, the YM settled at 49,565, up 302 points or +0.61%, and the RTY settled at 2,698.30, down 51 points or 1.78% on the day.
In the end, it was a one-way freight train up. In terms of the ES and NQ’s overall tone, it was buy every little pullback. In terms of the ES’s overall trade, volume was low — the lowest in 17 sessions, with 1.005 million contracts traded.
Like I always say… everything was moving.
Gold surged to a new record above $5,100 per ounce, driven by safe-haven demand amid geopolitical tensions — including President Trump’s threat of 100% tariffs on Canada if it finalizes a limited trade deal with China, which Ottawa downplayed as narrow and not a full FTA.
Silver also hit all-time highs around $109–$113, while natural gas futures spiked above $6 per MMBtu, roughly doubling recently due to Winter Storm Fern causing widespread outages, flight disruptions, and heating demand across much of the U.S.
Despite these macro risks, the ES rallied 115 points from Sunday night’s Globex low at 6880.00.
On Tap today is Consumer Confidence at 10:00 am and earnings from Applied Industrial Technologies (AIT) after the bell.
MiM
Market-on-Close Recap – MiM
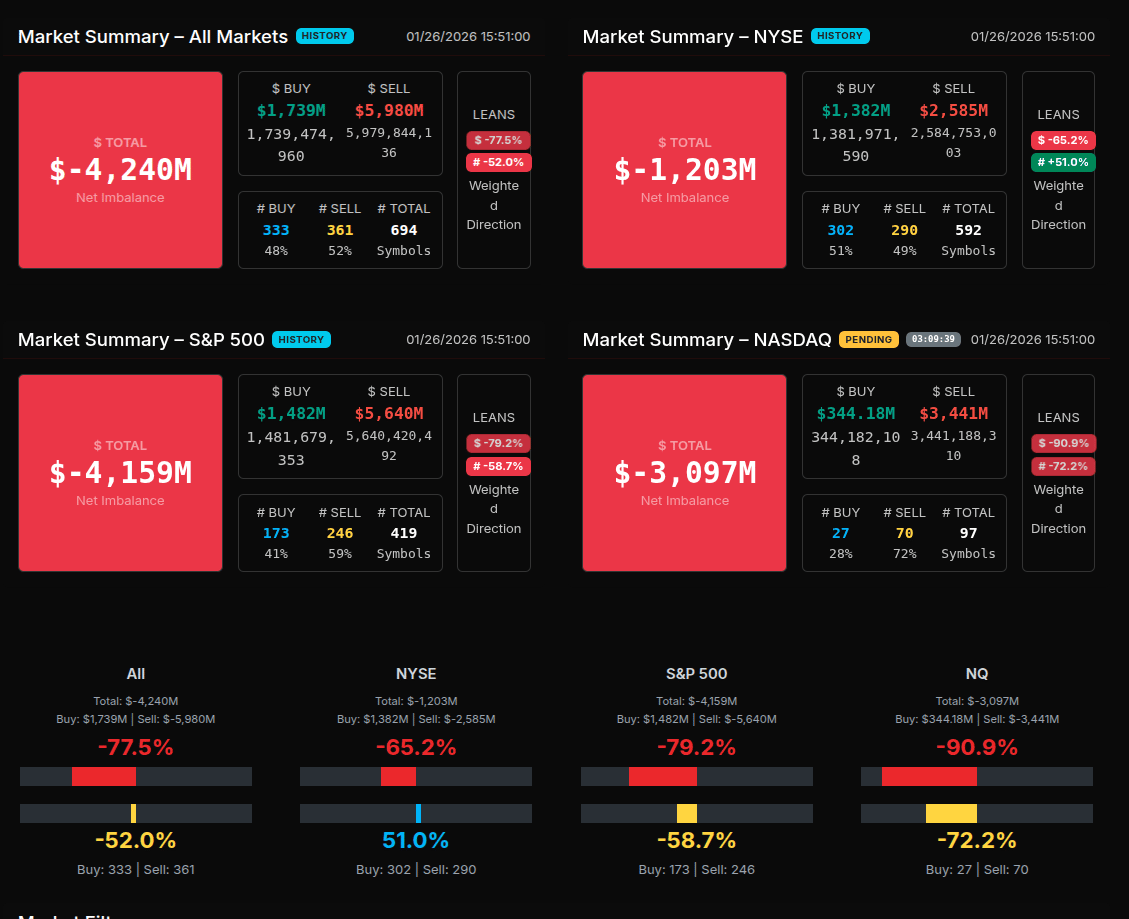
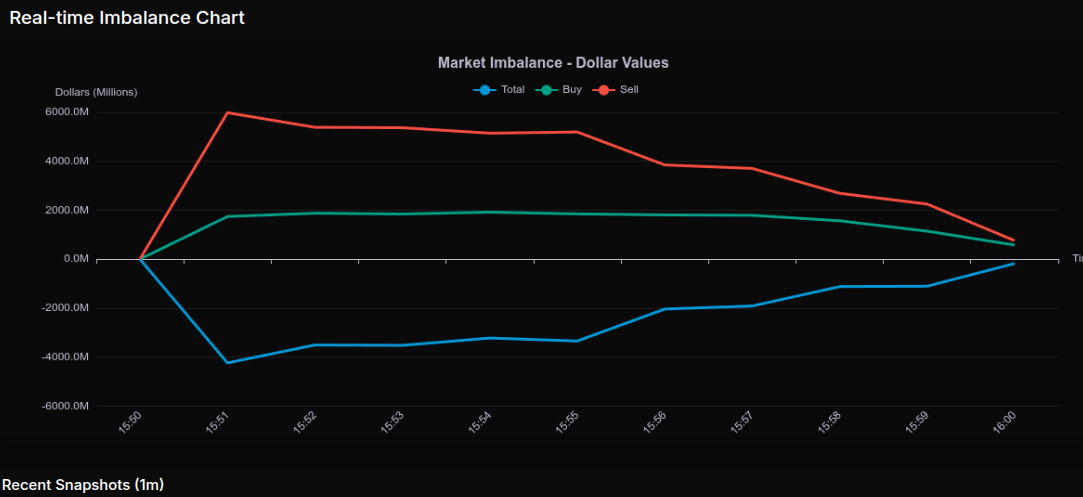
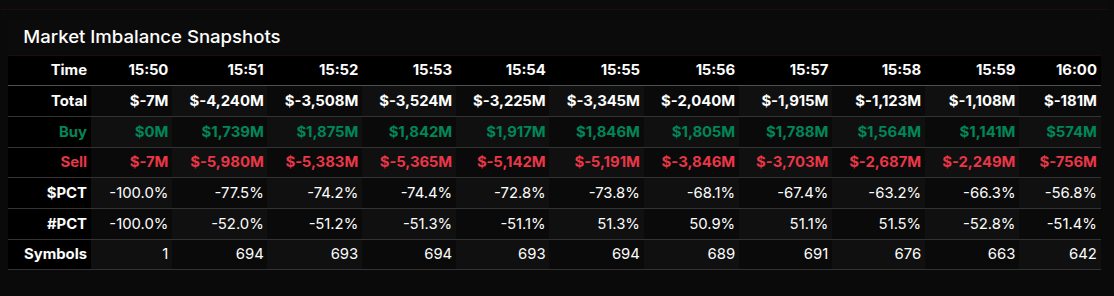
The January 26 Market-on-Close auction opened with a heavy sell imbalance and never truly escaped it, even as late-stage pressure moderated into the 4:00 pm print. Early snapshots showed net sell imbalances exceeding $4.2 billion, with sell programs overwhelming buy interest across nearly 700 symbols. While buy flow did increase incrementally into the final ten minutes, it was largely a function of sellers stepping back rather than aggressive dip-buying.
From a timing perspective, the imbalance peaked shortly after 15:51, when sell dollars surged near $6.0 billion against $1.7 billion in buys. The dollar lean remained decisively negative through 15:58, with the percentage imbalance holding well below -66% for most of the window — a clear signal of wholesale institutional selling rather than rotational repositioning. Only into the final two minutes did the dollar imbalance compress toward the -50% zone, suggesting some rebalancing but no real reversal.
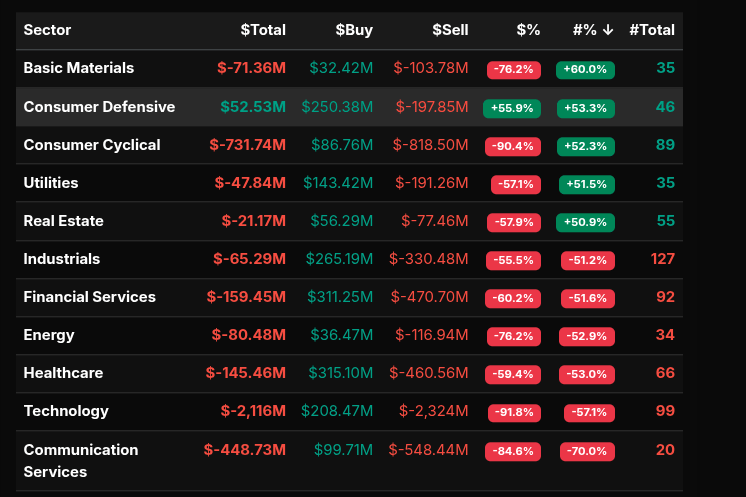
Sector data reinforced the defensive tone. Technology was the dominant pressure point, posting a -91.8% dollar lean, led by outsized sell programs in mega-cap names. Communication Services and Consumer Cyclical also showed extreme negative leans, confirming risk-off behavior rather than isolated profit-taking. Financial Services, Industrials, and Healthcare followed with consistent sell dominance, while Energy and Basic Materials remained firmly offered.
On the buy side, Consumer Defensive was the lone standout, finishing with a positive dollar lean near +56%, consistent with late-day capital rotation rather than broad risk appetite. Utilities saw modest buy participation but still closed net negative on the dollar.
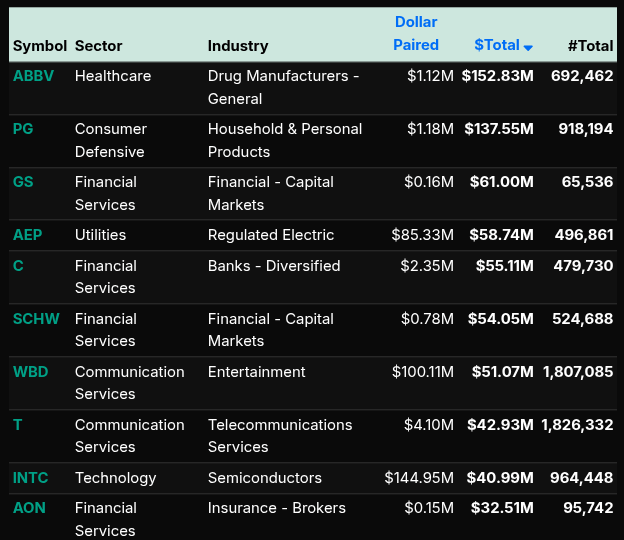
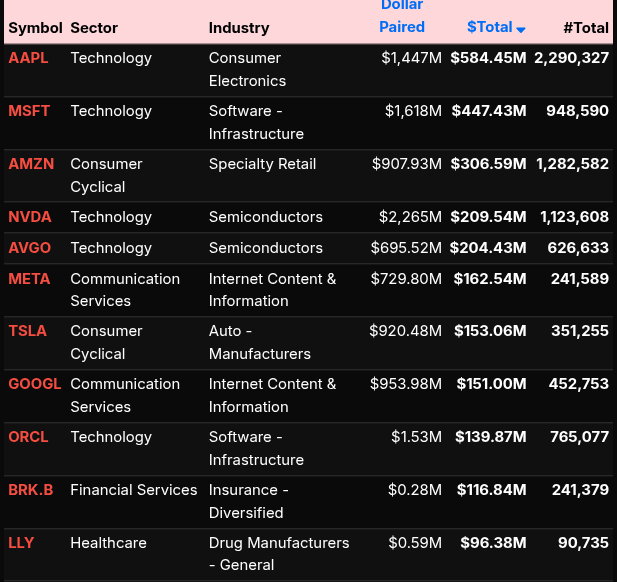
Single-stock activity echoed the sector picture. Heavy sell pressure was concentrated in high-beta and index-weighted names, while selective buying appeared in defensive healthcare and staples. Overall, the MOC reflected institutional de-risking into the close, with only light offsetting demand. The structure of the imbalance points to positioning adjustments rather than forced liquidation, but the breadth and persistence of selling keep the short-term tone cautious.
Technical Edge
Fair Values for January 27, 2026:
-
SP: 29.5
-
NQ 126.29
-
Dow: 151.08
Daily Market Recap 📊
For Monday, January 26, 2026
-
NYSE Breadth: 50% Upside Volume
-
Nasdaq Breadth: 45% Upside Volume
-
Total Breadth: 46% Upside Volume
-
NYSE Advance/Decline: 51% Advance
-
Nasdaq Advance/Decline: 49% Advance
-
Total Advance/Decline: 49% Advance
-
NYSE New Highs/New Lows: 185 / 18
-
Nasdaq New Highs/New Lows: 290 / 119
-
NYSE TRIN: 1.13
-
Nasdaq TRIN: 1.16
Weekly Breadth Data 📈
For Week Ending Friday, January 23, 2026
-
NYSE Breadth: 53% Upside Volume
-
Nasdaq Breadth: 55% Upside Volume
-
Total Breadth: 54% Upside Volume
-
NYSE Advance/Decline: 50% Advance
-
Nasdaq Advance/Decline: 51% Advance
-
Total Advance/Decline: 51% Advance
-
NYSE New Highs/New Lows: 437 / 76
-
Nasdaq New Highs/New Lows: 742 / 335
-
NYSE TRIN: 0.86
-
Nasdaq TRIN: 0.83
ES & NQ Levels (Premium only)

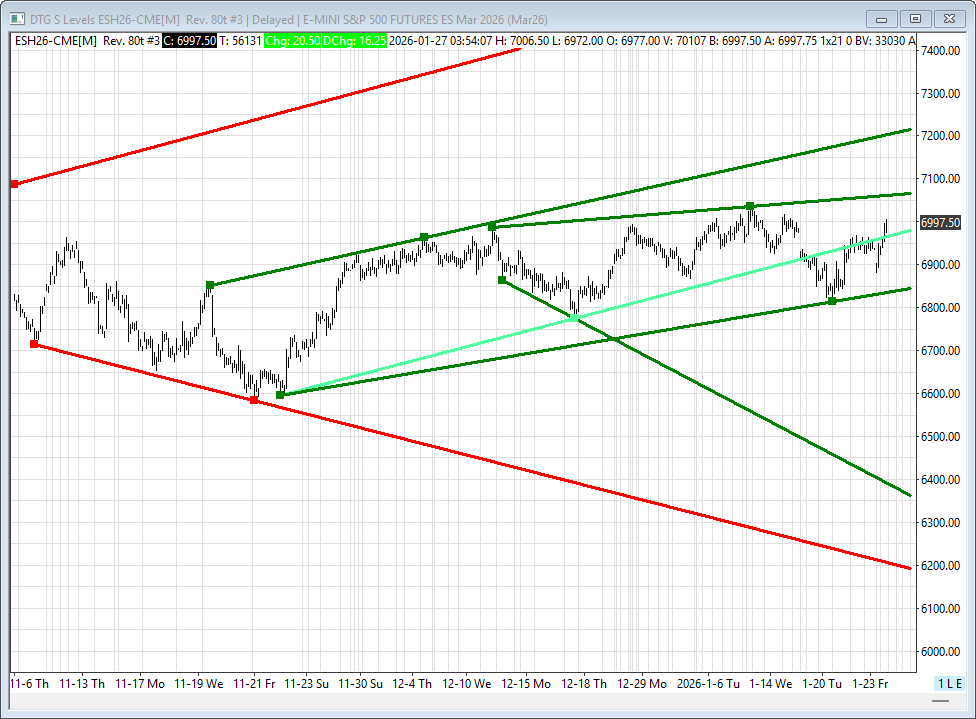
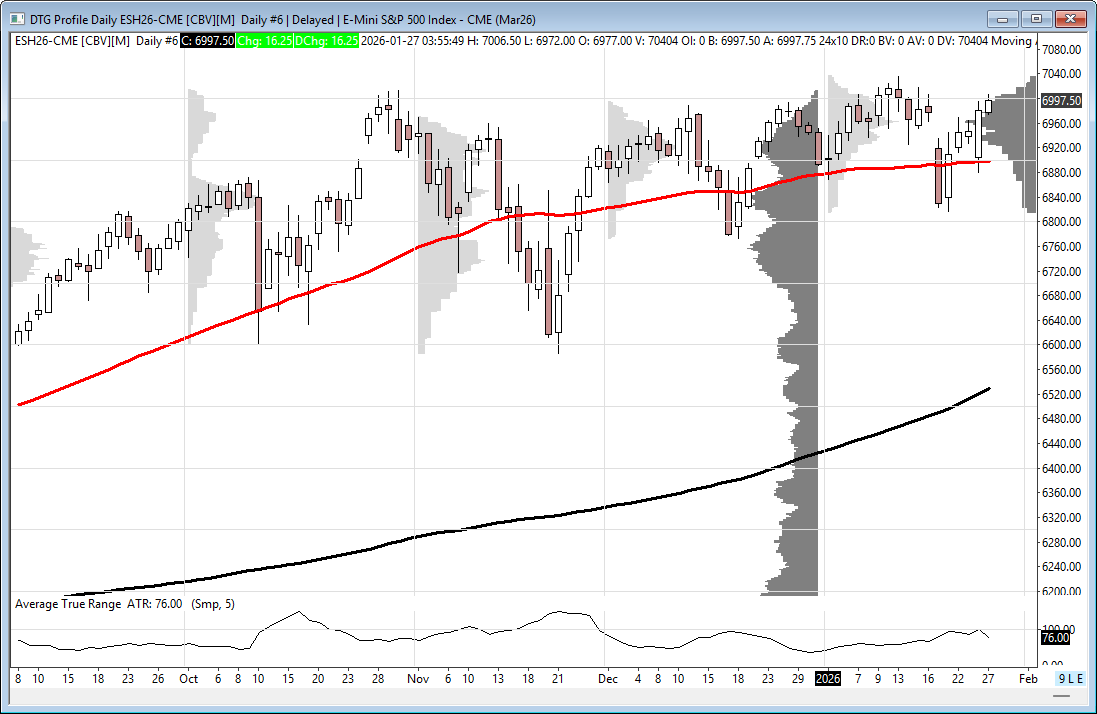
ES – H26 Levels
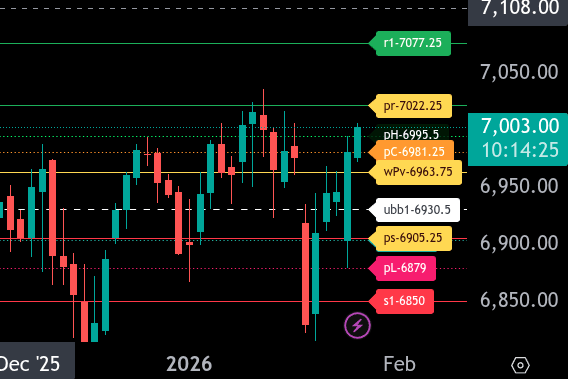
The bull/bear line is at 6965.00. This remains the key pivot for today. Holding above keeps the tone constructive; acceptance below shifts control back to sellers.
ES is currently trading around 7002.75 after a sharp rebound off the lower end of the range. As long as price holds above 6981.00–6965.00, buyers have room to press higher.
Upside resistance is layered at 7022.00, followed by 7077.75. A clean push through 7022.00 opens the door for a rotation toward the upper target. Acceptance above 7077.75 would confirm renewed upside momentum.
On the downside, first support sits near 6905.00. Failure there puts 6879.00 back in play, with a deeper downside extension toward 6850.00 if selling accelerates.
Overall, the bias is neutral-to-bullish above 6965.00, with range expansion potential if 7022.00 is reclaimed and held. Loss of 6965.00 shifts focus back to the lower supports quickly.
NQ – H26 – Levels
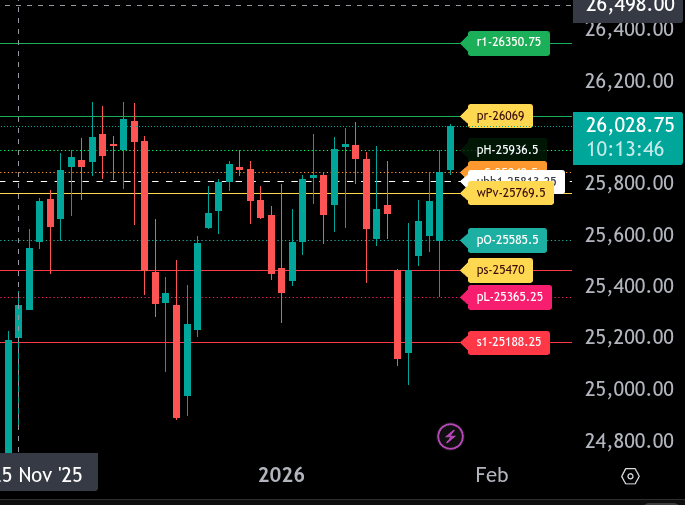
The bull/bear line for the NQ sits at 25,769.50. This is the key pivot for today. Holding above this level keeps the bias constructive, while acceptance below it shifts control back to sellers.
NQ is currently trading near 26,028.75, well above the bull/bear line, showing early strength. As long as price holds above 25,936.50, buyers remain in control and dips into that zone can attract responsive buying.
On the upside, the first resistance comes in near 26,069. A clean push and hold above that level opens the door to a continuation higher, with the upper range target at 26,350.75. That area is where sellers are expected to show up with size.
If the NQ fails to hold 25,769.50, downside targets come into play at 25,585.50 and then 25,470. A break and acceptance below 25,365.25 would increase the odds of a deeper test toward 25,188.25.
Overall, the tone is bullish above 25,769.50. Below it, trade turns two-sided with downside pressure increasing quickly if sellers gain acceptance.
Calendars
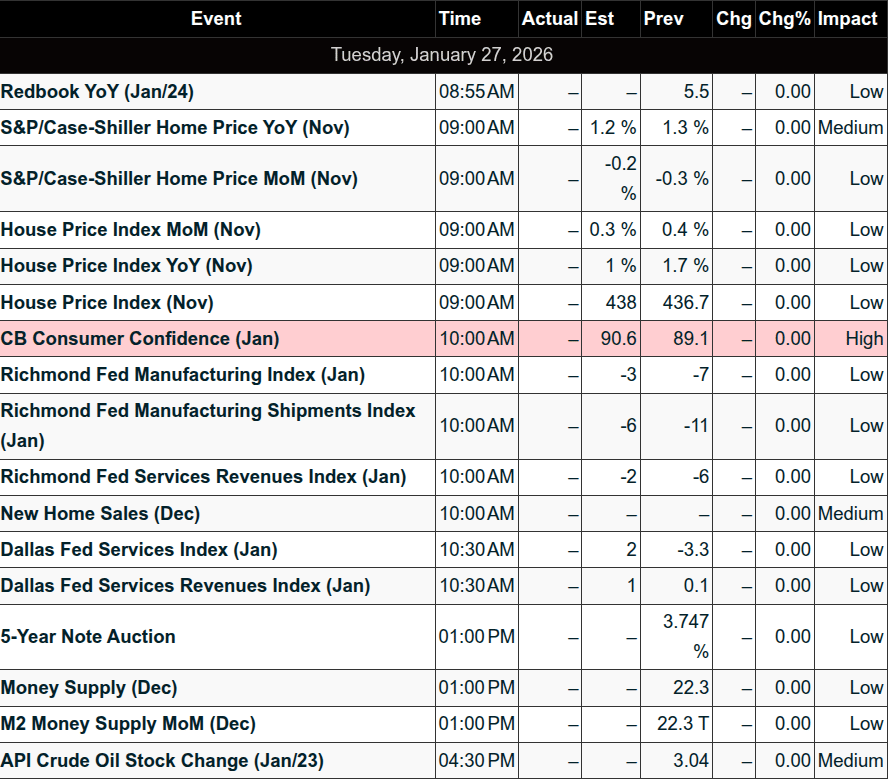
Economic Calendar
Today
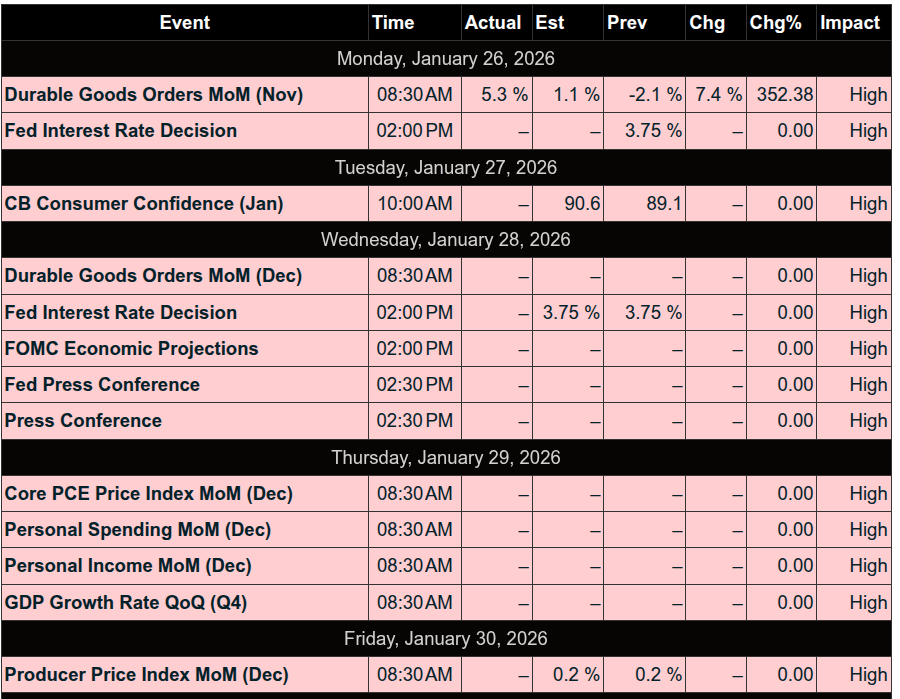
Important Upcoming
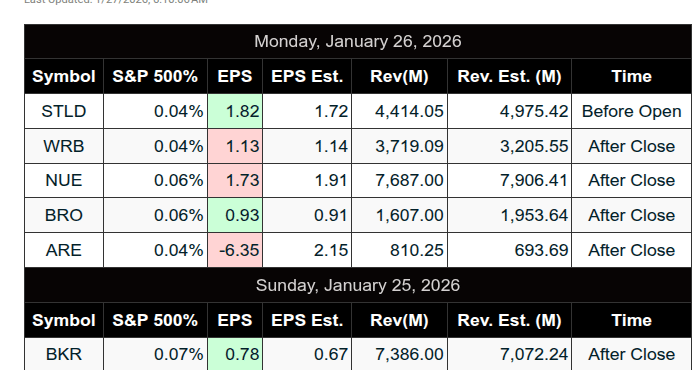
Earnings
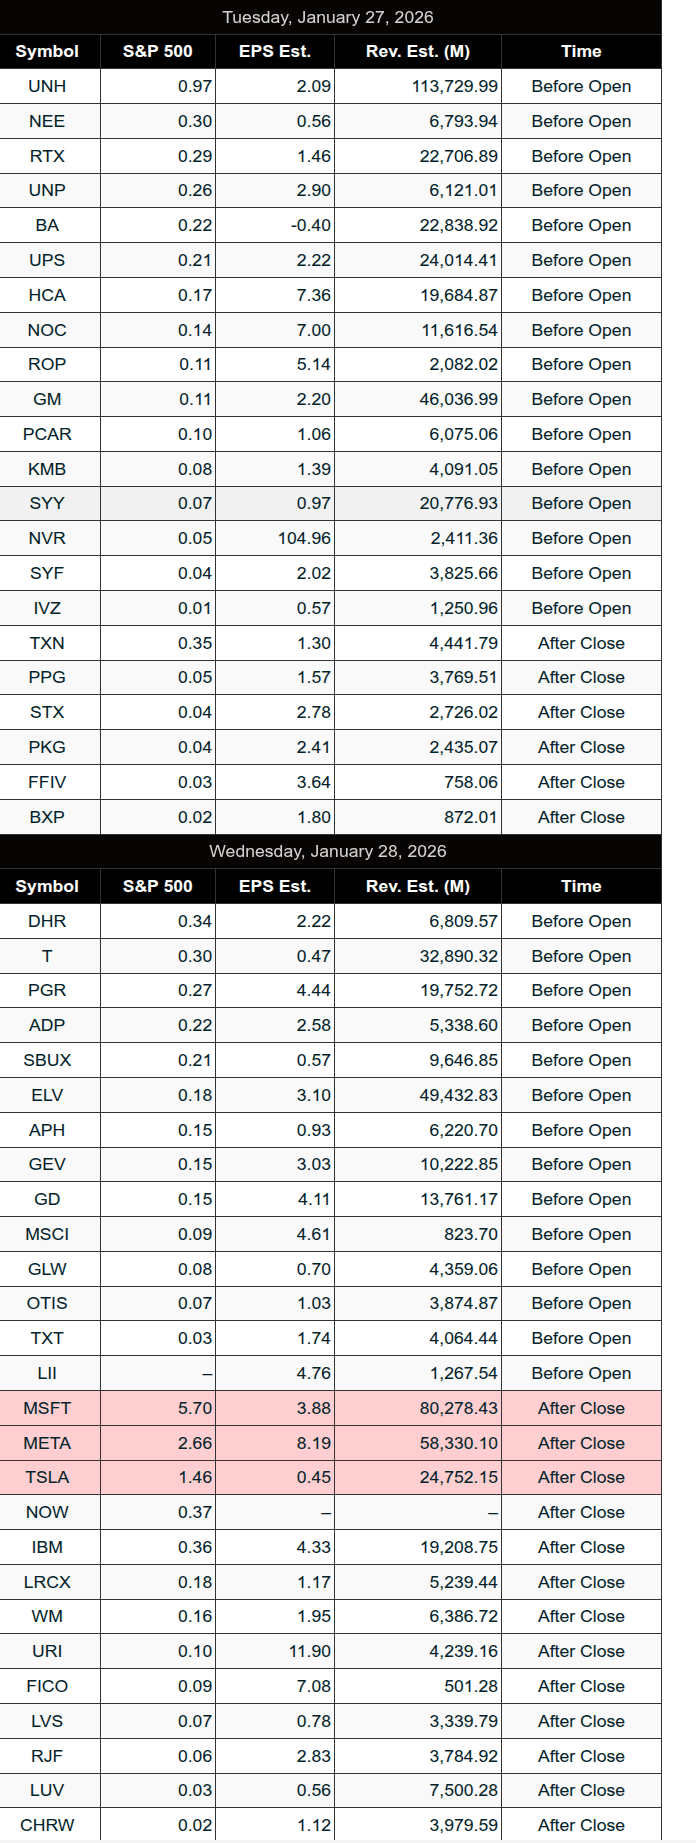
Recent
Trading Room Summaries
Polaris Trading Group Summary – Monday, January 26, 2026
The session on Monday showcased a clean, disciplined execution of the premarket plan, with the PTG room capitalizing on several high-probability trade opportunities—especially in the morning session.
Morning Action – Plan Executed to Perfection
-
The day began with a precise tag and reversal off the 6890 CD3 Violation target, followed by a successful reclaim and retest of the 6825 Line in the Sand, which sparked a rally to fulfill the upper Bull Case target of 6955.
-
PTGDavid noted that the session perfectly executed the outlined plan, with price staying above the CD1 Low at 6911.25, locking in the positive 3-Day Cycle, which maintained a 92% historical success rate.
-
The 3-Day Cycle target at 6958.85 was fulfilled, confirming the cycle structure and validating the strategy.
-
Bruce F called out a solid A4 setup, giving traders a great start to the week.
Key Trades & Lessons
-
Manny continued providing valuable premarket zones, including a 6947–6951 continuation long that aligned perfectly with the LOD at 6952. His work highlighted the importance of pre-planning and confluence.
-
Discussions around chart enhancements like Heikin-Ashi candles brought educational value to the group. PTGDavid added these to his tick chart for smoothing visual clarity.
-
PTGDavid marked the 6970–75 zone as structural support, which became the “sandbox” for mid-session activity.
-
ES traded within the expected range, and volume confirmed key levels, reinforcing the strategy’s validity.
Afternoon Slowdown – NQ Target Hit
-
Action slowed after lunch. The NQ hit its CD3 Penetration Target (25902.32) and tagged its D-Level Money Box Zone, rounding out a successful session for both indices.
-
PTGDavid summed it up well: “Morning opportunities, afternoon snoozing.”
-
The session ended with a notable $4.3B MOC sell imbalance, which created a bit of late-session movement but didn’t negate the buyers’ control throughout the day.
Key Takeaways
-
Premarket Planning Paid Off: Major targets were hit with precision.
-
High Probability Cycle Played Out: The 3-Day Cycle pattern once again delivered.
-
Community Collaboration: Traders helped each other navigate technical issues while maintaining focus on the setups.
-
Educational Elements: Discussions around charting tools and visual indicators enriched the group’s trading IQ.
A strong and focused Monday for the PTG room—clear setups, effective follow-through, and valuable lessons.
Discovery Trading Group Room Preview – Tuesday, January 27, 2026
Markets are focused on earnings, Trump’s new tariffs, a possible U.S. government shutdown, and the Fed’s January meeting.
-
Tariffs & Trade: Trump announced South Korean tariffs will rise to 25% (from 15%) on autos, pharma, and lumber. Meanwhile, the EU and India struck a major free trade deal, cutting tariffs on 99.5% of Indian imports over 7 years.
-
U.S. Government Shutdown Risk: Budget talks are in flux after weekend protests turned violent. Senate Democrats vow to block DHS funding, though 5 of 6 bills may still pass, limiting shutdown scope.
-
Fed Watch: No rate changes expected today, but markets will closely monitor Powell’s press conference for forward guidance.
-
Micron (MU): Shares rally premarket on $24B investment in a Singapore NAND chip plant. AI-driven chip demand expected to outpace supply through 2027.
-
Earnings on Deck:
-
Premarket: BA, GM, HCA, KMB, NEE, NOC, NVR, PCAR, RTX, SYF, SYY, UNP, UPS, UNH
-
After Close: STX, TXN, BXP, FFIV, MANH, NXT, PKG, PPG
-
Wed AM: ASML, T, ELV, GEV, GD, SBUX, PGR, UMC
-
-
Economic Data Today: HPI, S&P/CS HPI at 9:00am ET; Consumer Confidence and Richmond Manufacturing at 10:00am ET.
-
ES Futures Update: After testing 6966–6969 support, ES broke higher. Next resistance at 7062–7067 above ATH (7036.25). Light overnight volume; no strong whale presence.
-
Key TL Resistance: 7062/67, 7213/18
-
Key TL Support: 6966/69, 6840/43, 6337/32, 6192/87
-
50-day MA at 6898.75 as loose support.
-
Affiliate Disclosure: This newsletter may contain affiliate links, which means we may earn a commission if you click through and make a purchase. This comes at no additional cost to you and helps us continue providing valuable content. We only recommend products or services we genuinely believe in. Thank you for your support!
Disclaimer: Charts and analysis are for discussion and education purposes only. I am not a financial advisor, do not give financial advice and am not recommending the buying or selling of any security.
Remember: Not all setups will trigger. Not all setups will be profitable. Not all setups should be taken. These are simply the setups that I have put together for years on my own and what I watch as part of my own “game plan” coming into each day. Good luck!
This post goes out as an email to our subscribers every day and is posted for free here around 2 PM ET. To get your real-time copy, sign up for the free or premium version here: Opening Print Subscribe.
Comments are closed