This post goes out as an email to our subscribers every day and is posted for free here around 2 PM ET. To get your real-time copy, sign up for the free or premium version here: Opening Print Subscribe.
End-of-Month Games, Dead-Cat Bounces, and Sellers Waiting at 7000
Follow @MrTopStep on Twitter and please share if you find our work valuable!
Our View
I know the ES and NQ rallied back up, but when they were at their lows, and despite me saying I thought they were at or near the lows, they could have easily fallen a lot more. When Bitcoin was falling, all I could think of was MicroStrategy, which is the largest corporate owner of Bitcoin, with an estimated average price of $76,037. There are so many fires in the woods, it’s hard to keep up with.
Our Lean
This is Crazy Town, USA. Was I surprised by the stock market selloff? Yes, but when I saw MSFT go from down 8% to down over 12.5%, you could see the tech sector melting down, and there was almost zero bounce in the NQ. The MSFT fall wiped out $360 billion in market capitalization and marked its worst single-day decline since July 2013, while oil jumped to $70.71—up almost 5% to its highest level since July 2025.
Trump was on TV last night and said he will name his choice for the new Fed chairman next week. He talked about averting the government shutdown, and said he has “blessed” an emerging deal to stave off a partial government shutdown scheduled for Saturday. He also warned Iran that “time was running out” for a new nuclear deal, talked about the “great healthcare plan,” ordered the immediate reopening of all commercial airspace over Venezuela, and suggested that Representative Ilhan Omar may have “staged” a recent assault against herself.
As I said, the PitBull—who is a staunch Trump supporter and told me Trump had just gone on TV—said he is concerned about the president’s health. Can you imagine, as of today, there are 746 trading sessions remaining in his second term?
Our lean: Today is the last trading day of January, week 5 options expiration, and the end-of-month rebalance, which is historically a semi-bullish day. My guess is that, with the big jump after Apple reported and the ES’s late-day drop from the highs, we could see lower prices on Globex.
Like I said yesterday, it seems like when the NQ and ES gap higher, the sellers show up on the open. I can’t rule out another drop-and-pop, but there is still a lot of negative risk. Other than that, all I can say is: expect the unexpected.
Also, if you look back to three weeks ago—01/09/26—the ES settled at 7005.00. Unless I’m missing something, it seems like there’s a lot of resistance above 7000.00. If the ES and NQ gap lower on oversized Globex volume, we could see some early buyers, but they could end up being dead cat bounces.
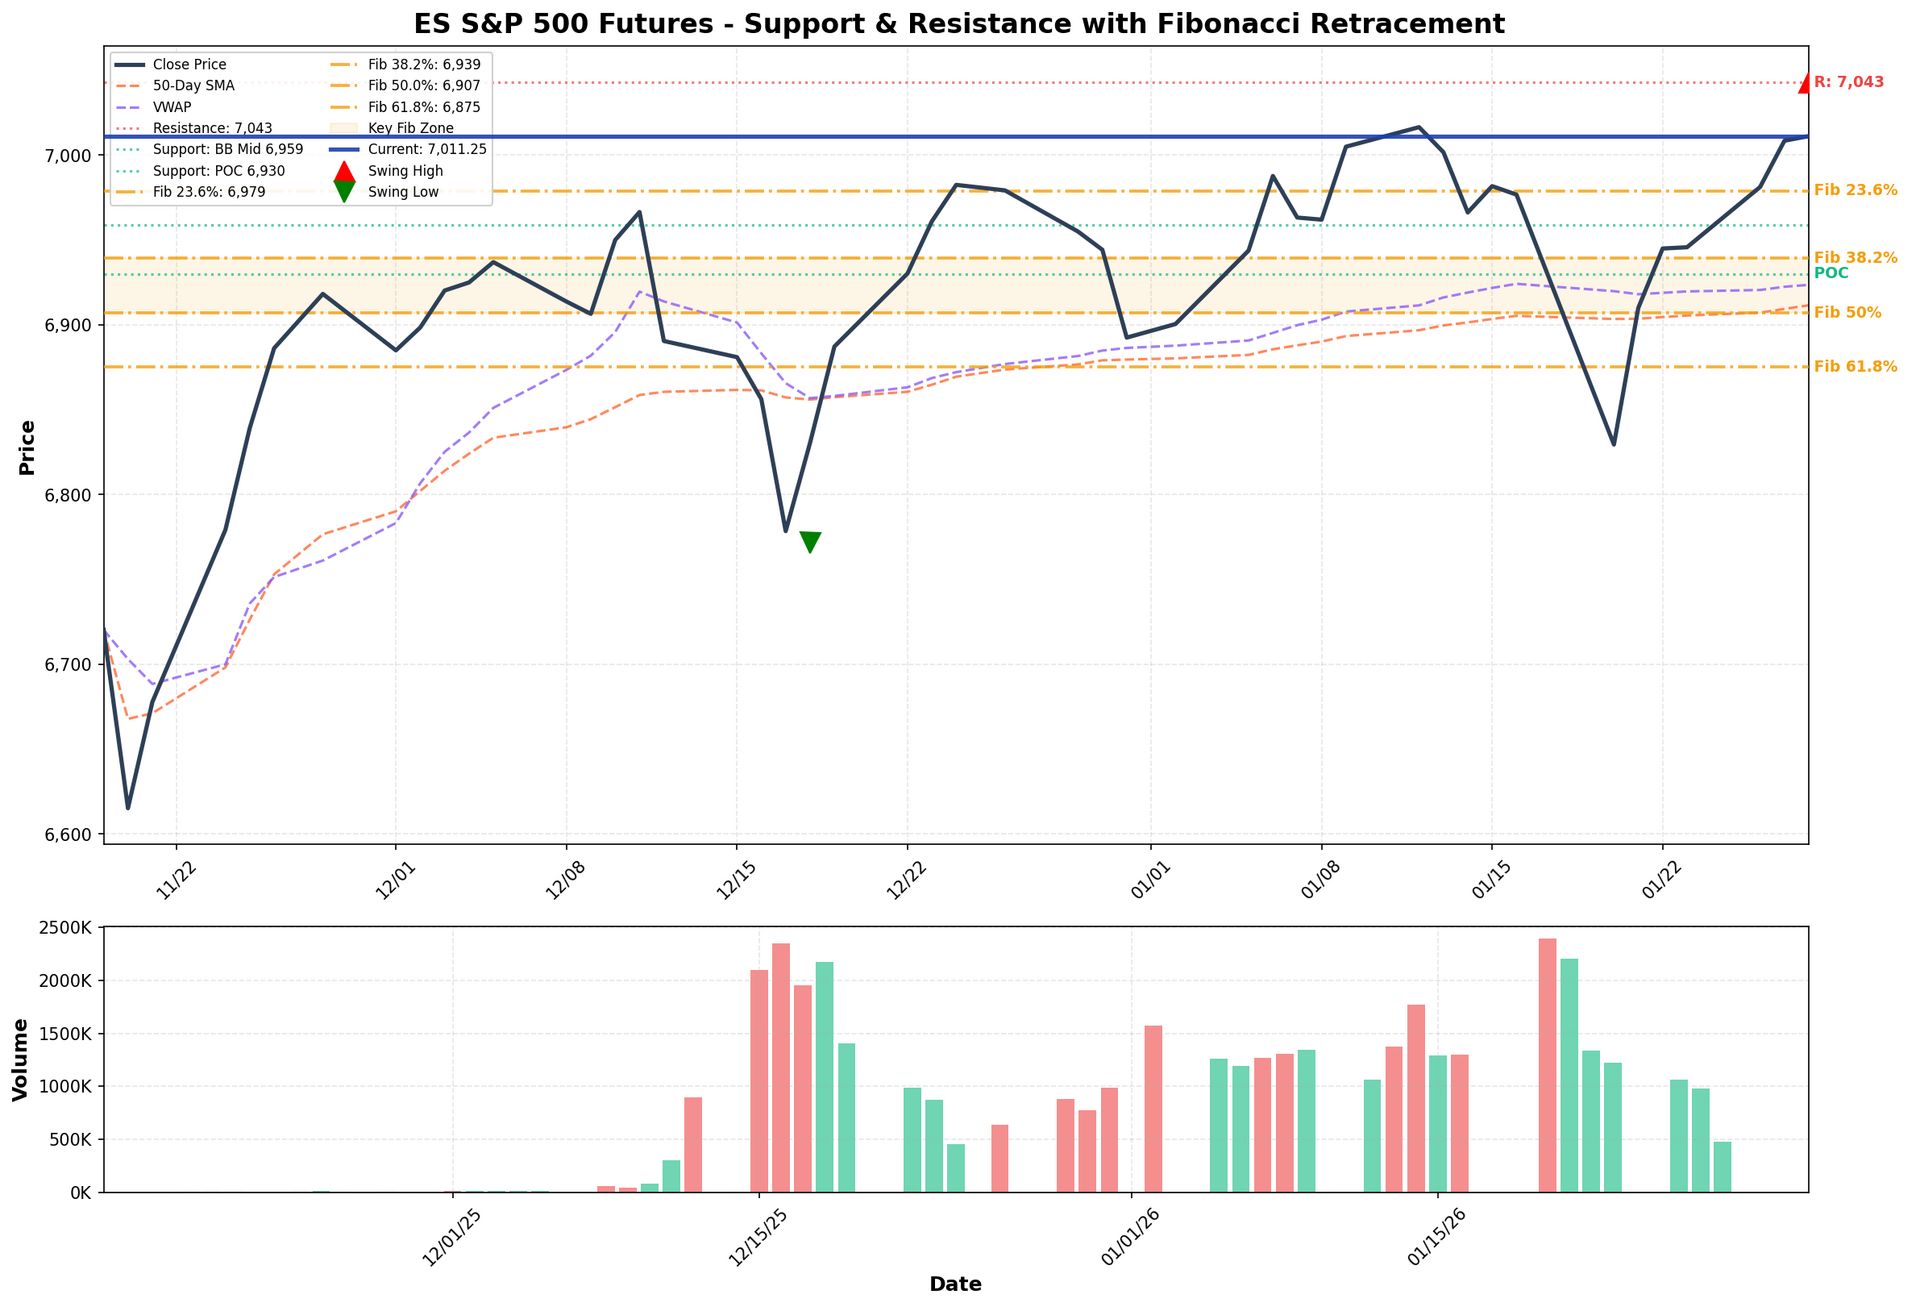
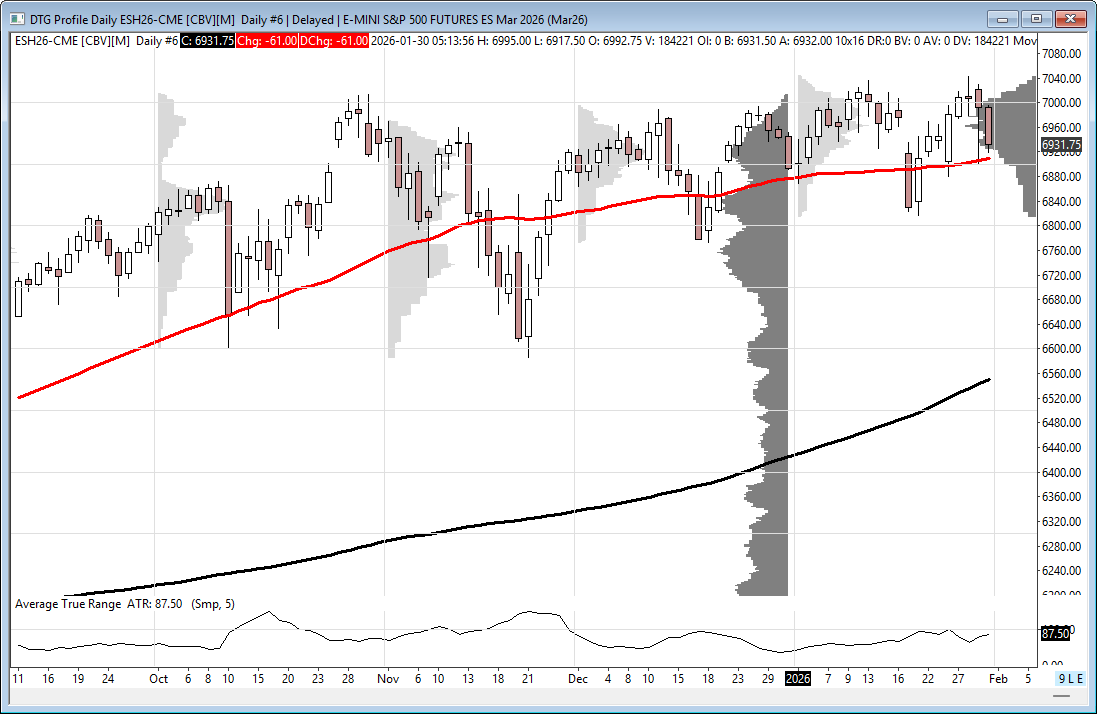
The first levels I made from AI Claude levels included Market Profile, VWAP, and the 50-day and 200-day moving averages. Today I added the 5-minute Bollinger Bands and Fibonacci Retracements.
Key Support Levels:
-
6,959 – Bollinger Middle Band (nearest support)
-
6,930 – Market Profile Point of Control
-
6,924 – VWAP
-
6,912 – 50/200-Day SMAs (clustered support zone)
-
6,860 – Market Profile Value Area Low
Key Resistance Levels:
-
7,043 – Recent Swing High (immediate resistance)
-
7,053 – Bollinger Upper Band
The market is in a bullish configuration, with ES trading above all major support levels. The strongest support zone is clustered around 6,910–6,960, making this an ideal area for potential long entries on pullbacks.
📊 COMPLETE COMBINED MAP
SUPPORT LEVELS (18 levels organized by zones)
🟢 PRIMARY ZONE: 6,930–6,980 ⭐⭐⭐ STRONGEST
6,979 → 6,939 → 6,934 → 6,930 (POC)
5 indicators align here – highest probability support
🟢 SECONDARY ZONE: 6,860–6,920
Includes 50/200 SMA, Fib 50%, Fib 61.8% Golden Ratio, VAL
🟢 DEEP SUPPORT: 6,810–6,830
Critical swing low area
RESISTANCE LEVELS (21 levels organized by distance)
🔴 IMMEDIATE: 7,025–7,080 (First Barrier)
7,025 (tested 4x) → 7,043 → 7,050 ⭐ → 7,053
🟣 NEAR-TERM: 7,100–7,180 (Primary Upside)
7,100 ⭐⭐⭐ MAJOR TARGET
7,117 → 7,147 → 7,150 → 7,179
🟠 EXTENDED: 7,200–7,330 (Momentum Continuation)
7,200 ⭐⭐ → 7,211 (Golden) → 7,300 ⭐⭐
📈 TRADING ROADMAP
Clear upside/downside ladders showing:
-
Upside: +32 pts to 7,043 → +39 to 7,050 → +89 to 7,100 → +189 to 7,200
-
Downside: -32 pts to 6,979 → -72 to 6,939 ⭐ → -100 to 6,912 → -136 to 6,875
💡 QUICK TRADE SETUPS
Three complete strategies with entries, stops, and multi-target exits:
-
Aggressive: momentum play
-
Conservative: pullback to 6,930–6,950
-
Deep Value: 6,905–6,915
Plus breakout strategies for 7,055+ and 7,100
Remember … this is a work in progress.
Guest Posts:

Get instant access to our partners’ real-time market data and insights not available anywhere else. Here is last night’s Founder’s note getting you ready for today’s market and explaining the constraints in yesterday’s market. – MrTopStep
Founder’s Note:
Futures are off 28bps – which is a strong recovery from overnight lows near SPX 6,900.
TLDR: Resistance is in the 6,940 to 6,960 positive gamma band (yellow box). With the SPX below the 6,950 Risk Pivot, we remain on the lookout for spasm-y downside a la yesterday. Not only did the dynamics that drove yesterday’s spasm not improve – they seemed to have gotten worse. Further, no one is on to these dynamics (see below), and so we think that the next spasm may not have such big mean reversion. And if you as an SG sub was questioning what happened yesterday then please tender your resignation!
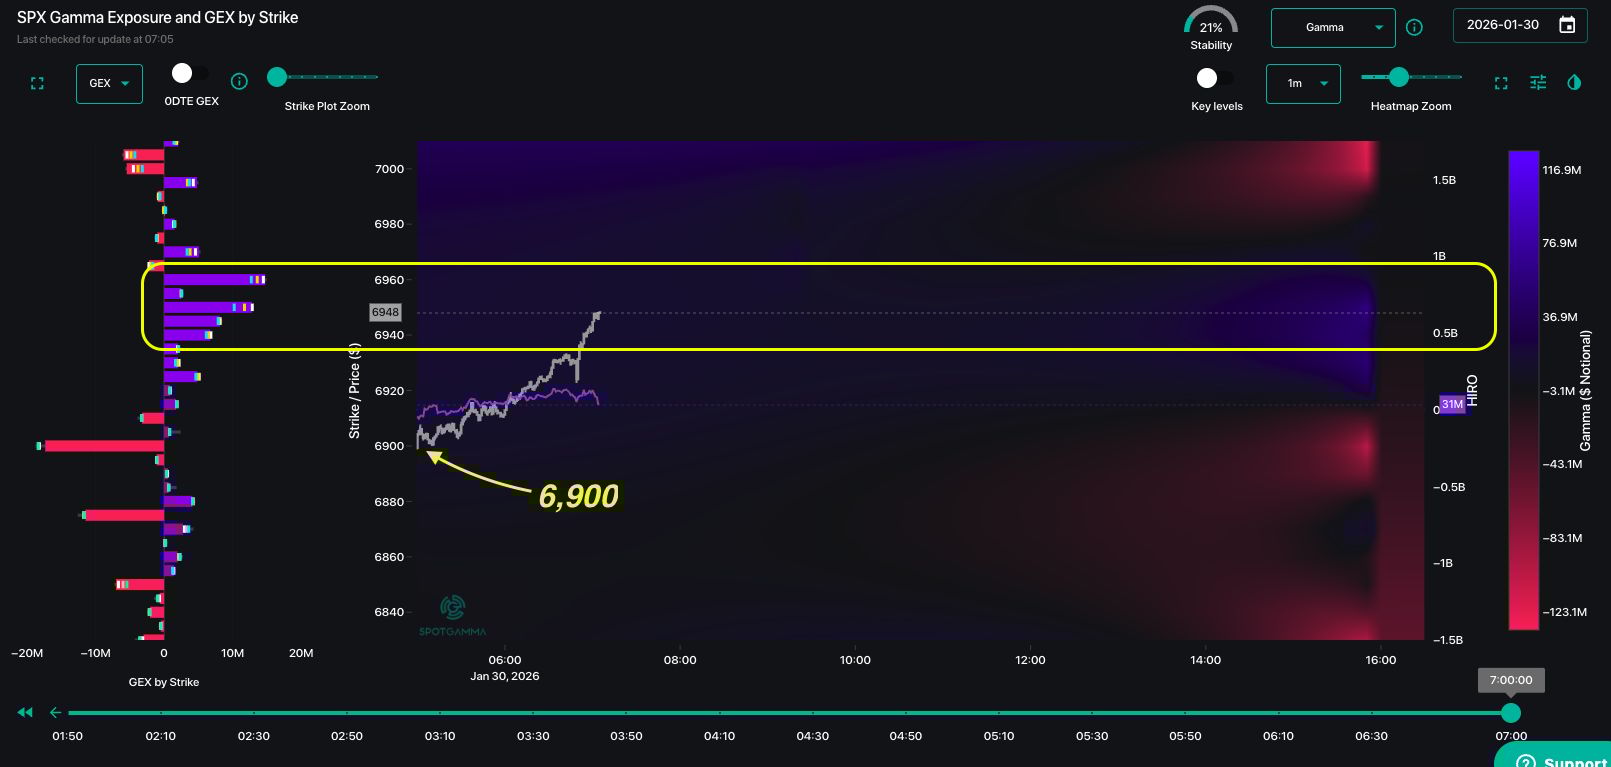
We yesterday moved our Risk Pivot to 6,950 on account of the chunky buyside long puts at ~6,900 and below (shows as dealer short, red bars). We also went into today being one of the only voices out there hand-waving about the potential for volatility spasms into the low correlation/low 0DTE IV environment. We don’t bring up this review to be self-congratulatory, but instead to note:
-
There are now bigger dealer short puts below – that suggests faster downside due to more negative gamma <=6,900
-
Today’s 0DTE straddle is pricing in just $42/60 bps of movement for today. To quote Mugatu: “I feel like im taking crazy pills!” So…the SPX yesterday dropped 1.7% intraday before rallying back 1.4%, and futures were down 1.15% before rallying back 0.75%…and your pricing in 40 bps? With PPI on deck at 8:30?
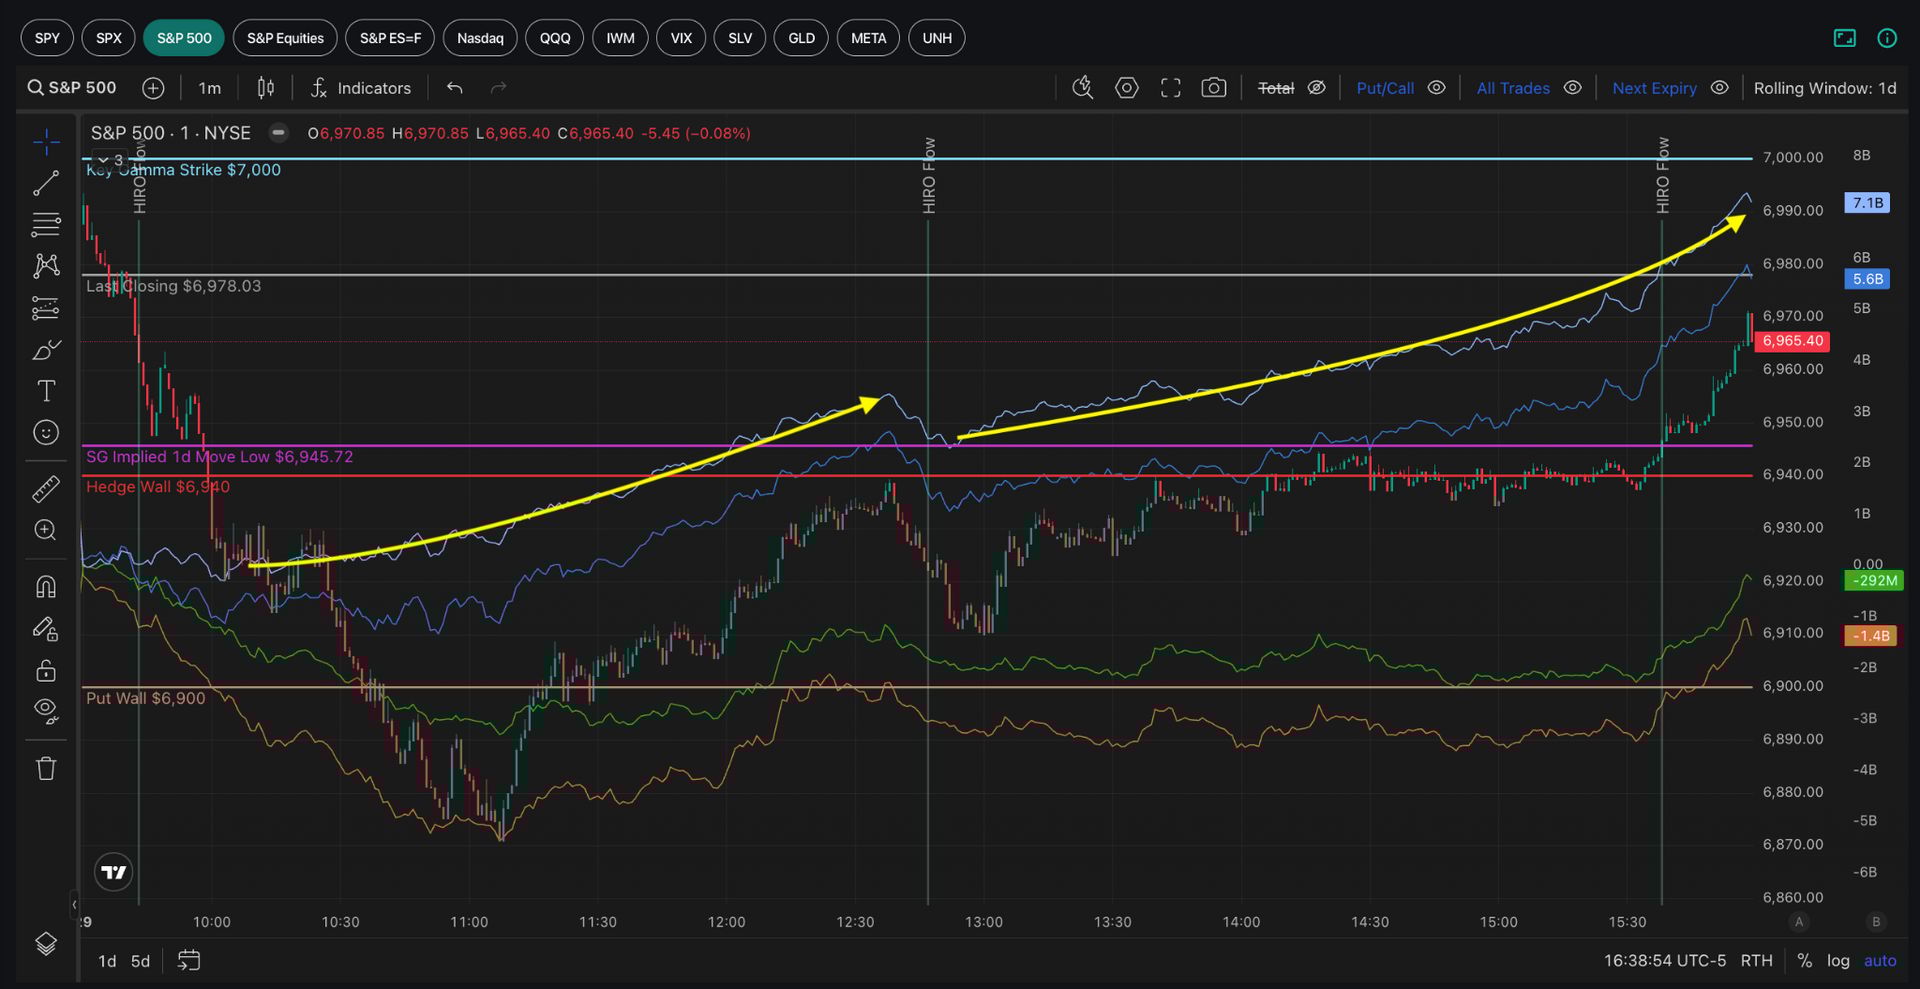
Before we move on we need to be clear on what may saved the markets yesterday: 0DTE puts (light blue), with about $7bn notional of them being sold (see y’days great PM note). Those puts get sold, helping to put the floor in, triggering traders into other mean reversion positions “buy the stock dip” and “sell the 20 VIX”. What you don’t see in HIRO was long dated calls being bought… There was one bank suggesting massive dealer S&P500 positive gamma as a reason for the mean reversion. We don’t see that….the gamma thats in play is largely 0DTE and subject to getting blown out quickly, making that implied support quite transient (see here).
Looking ahead, if there was one small change/improvement to the dynamic its that single stock calls suddenly went from bid up to “yours”, as shown in Compass. Most stocks were middle right on the Compass yesterday (leaning in to calls), and now have dispersed to the left (in favor of puts).
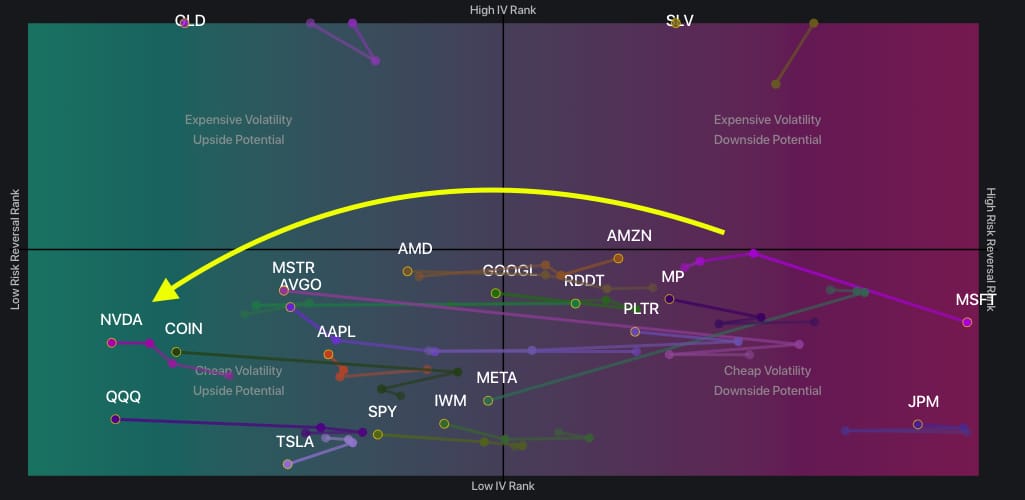
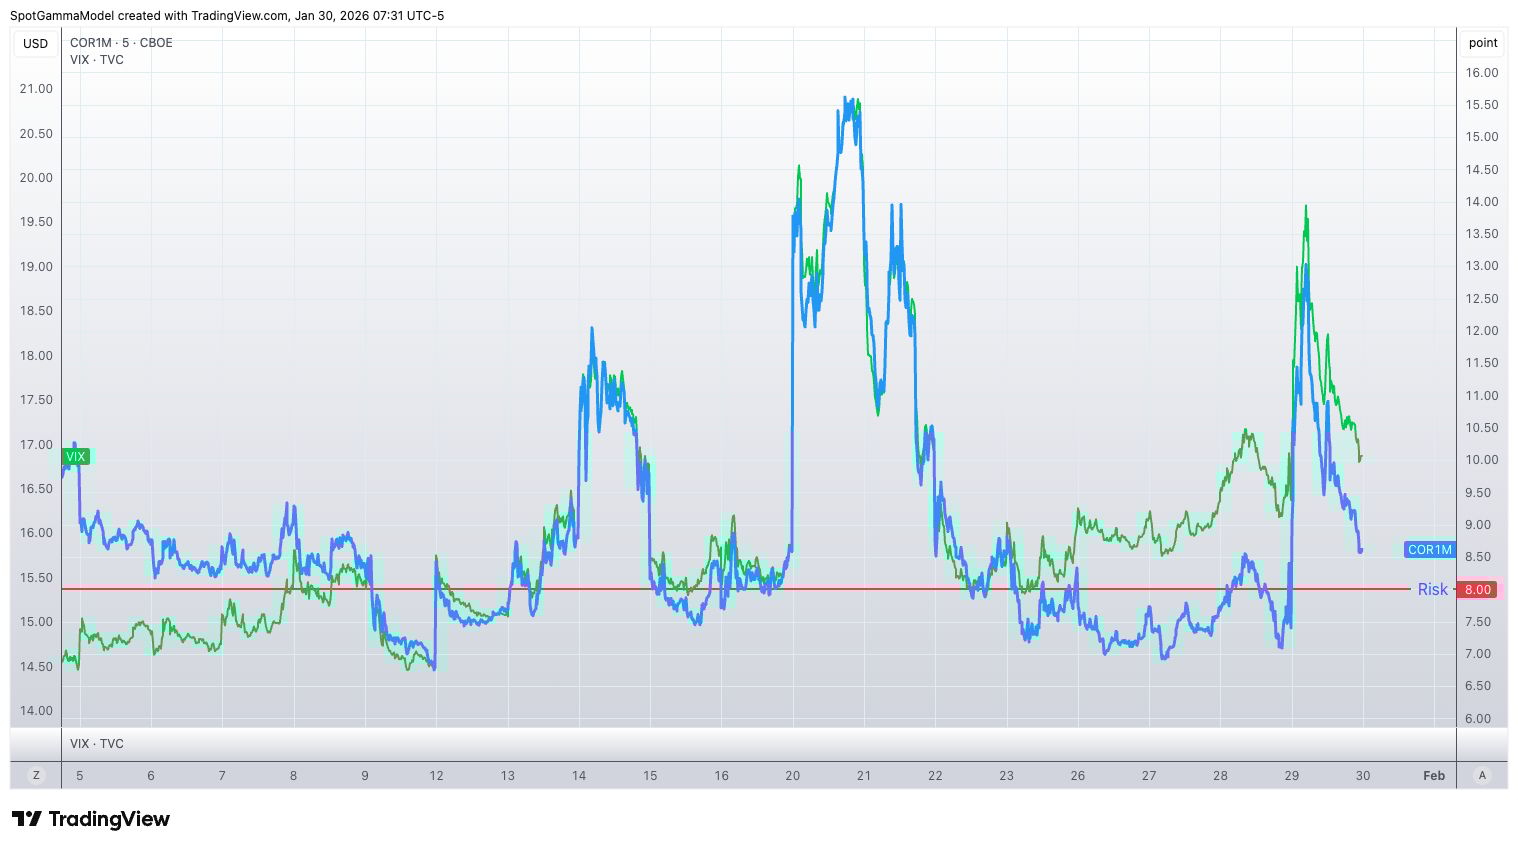
This is a small improvement, but note what COR1M (blue) did yesterday during the spasm – it spiked. COR1M read as back in the “risky 8’s” by the close, but that is likely to shift when the single stock options market opens. We also want to flag something else: the VIX is in green. Both COR1M & VIX tracked perfectly into that intraday drop which saw the VIX go to 20. Remember: VIX measures ~1-month to exp SPX options, and COR1M measures ~1-month single stock vol vs SPX vol. There is an intrinsic link there, obviously, but we think of COR1M as a vol turbocharger because it highlights dispersion trade unwinds: sell single stock vol (which is usually bid up on the call side) and buy index vol.
What’s the point? The underbelly of this market is very soft, and we are very concerned about the next spasm being one that sticks. Tread lightly.
©2025 TenTen Capital LLC DBA SpotGamma
All TenTen Capital LLC DBA SpotGamma materials, information, and presentations are for educational purposes only and should not be considered specific investment advice nor recommendations. Futures, foreign currency and options trading contains substantial risk and is not for every investor. An investor could potentially lose all or more than the initial investment. Risk capital is money that can be lost without jeopardizing one’s financial security or lifestyle. Only risk capital should be used for trading and only those with sufficient risk capital should consider trading. Past performance is not necessarily indicative of future results. VIEW FULL RISK DISCLOSURE https://spotgamma.com/model-faq/disclaimer/
Market Recap
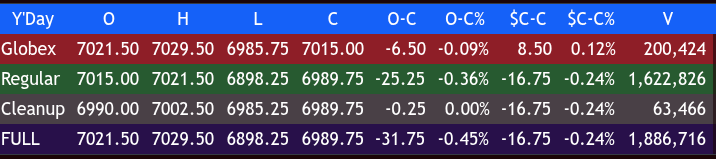
The ES traded up 70 to 7029.50 on Globex with a total of 218k contracts traded and opened Thursday’s regular session at 7015.00. After the open, the ES traded up to 7021.75 and then sold off down to 6898.00 at 11:08, a 119.25-point drop in 90 minutes. After the low, the ES rallied up to 6967.75 at 12:35, sold off down to 6937.25 at 12:55, rallied up to 6962.25, pulled back to 6952.25 at 1:30, rallied up to 6968.75 at 1:40, sold back off down to 6952.75, rallied back up to 6973.00 at 2:30, pulled back to the VWAP at 6961.00 at 3:00, traded up to 6979.00.00 at 3:35, and traded 6979.50 as the 3:50 cash imbalance showed $3.2 billion to buy and rallied up to 6999.00 at 3:55 and traded 6989.75 on the 4:00 cash close.
After 4:00, the ES traded down to 6985.25 at 4:25, rallied all the way up to 7002.25 at 4:30 after APPLE reported strong earnings, pulled back to 6988.00 at 4:50, and settled at 6989.75, down 17.50 points or -0.25%. The NQ settled at 25,982.50, down 173.75 points or -0.66%, the YM settled at 49,107.00, down 60 points or -0.15%, and the RTY at 2,657.80, down 5.30 points or -0.20%.
From the ES’s 7029.50 high to its 6898.25 low, the ES sold off 131.25 points, and from its low to its late high at 7002.25, the ES rallied 104.25 points. In percentage terms, the drop was 1.87%, and the rally back was a jump of 1.51%. From the NQ’s 26,296.00 high to its 25,536.00 low, it dropped 760 points, and from the low to the rally back up 26,039.50, it rallied 464 points.
In the end, the markets got spooked and were hit by one of the largest waves of sell programs in a long time, but after the low, the ES reversed, and the buy programs kicked in. In terms of the ES’s overall tone, it improved greatly but remained somewhat suspect. In terms of the ES’s overall trade, volume was high — 218k ES traded on Globex and 1.671 million contracts traded on the day session, for a total of 1.889 million contracts traded.
Tech led the selloff, driven by Microsoft’s 10% plunge, which pushed the Nasdaq down over 0.7%, as investors reacted poorly to slowing cloud growth and a massive 89% surge in AI infrastructure spending. While enterprise software stocks like Salesforce and ServiceNow followed Microsoft lower, Meta Platforms managed a double-digit rally following its own strong earnings.
Beyond tech, gold and copper hit historic record highs, while oil prices jumped over $70 on reports that President Trump is considering strikes on Iran and criticized the Federal Reserve’s decision to hold rates steady, renewing his public calls for the U.S. to maintain the world’s lowest borrowing costs. I don’t think there is ever going to be a quiet period for Trump, and despite the rally after the big drop, the futures remain clouded, with the DXY down 4 of the last 5 sessions or -2.31%.
Bitcoin dropped as much as 6.4% to an intraday low of $83,259, its lowest level in over two months, with massive ETF outflows in spot Bitcoin ETFs, which saw over $1.1 billion in net outflows over the past five trading days, marking a heavy weekly exodus.
And last but not least, the ZBH — the 30-Year T-Bond — has fallen sharply, dropping 0.68 points to 114.66 (-0.59%) as its yield increased from 4.832% to 4.868%, the highest since September 2, 2025.
MiM
Market-On-Close Recap
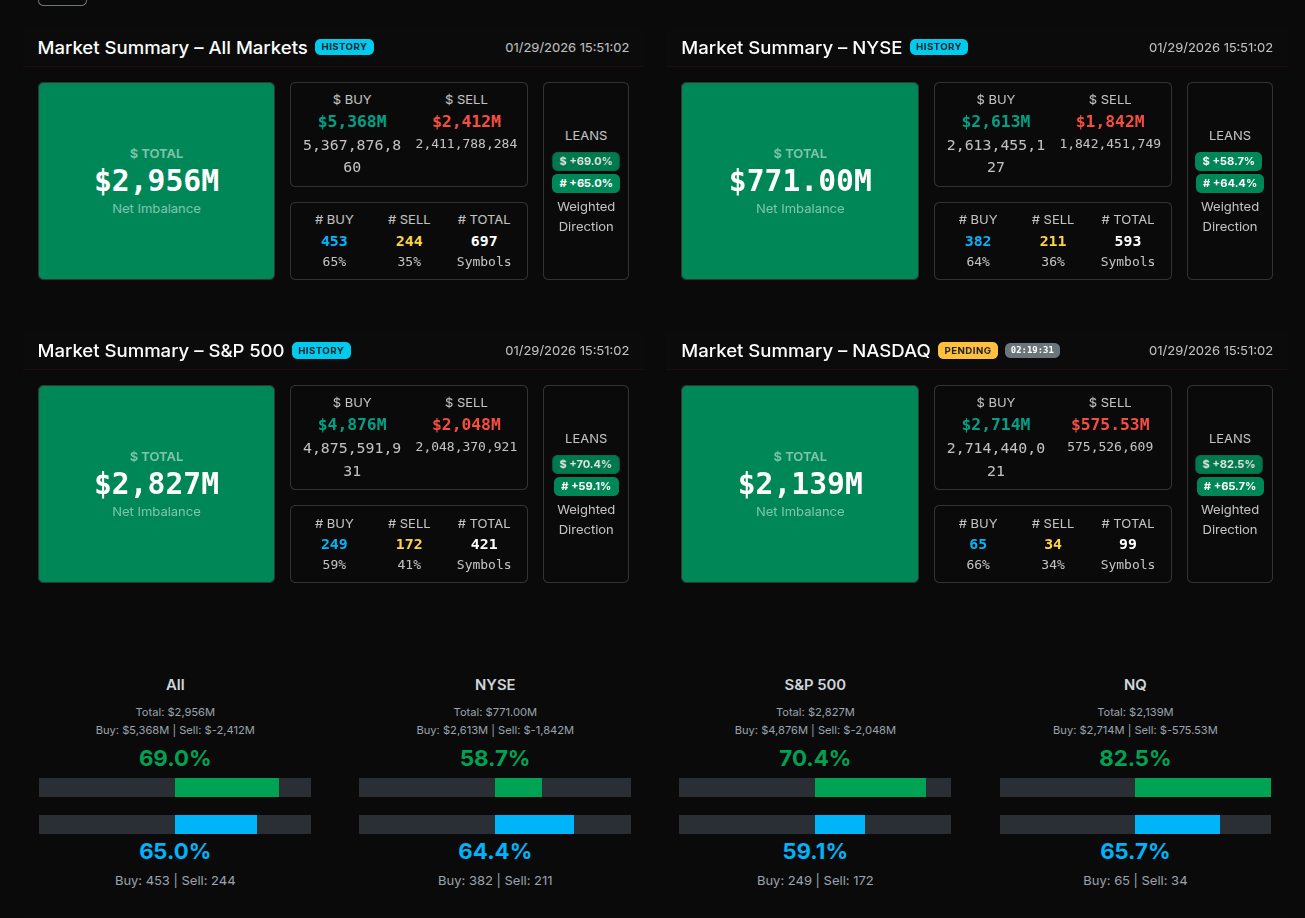
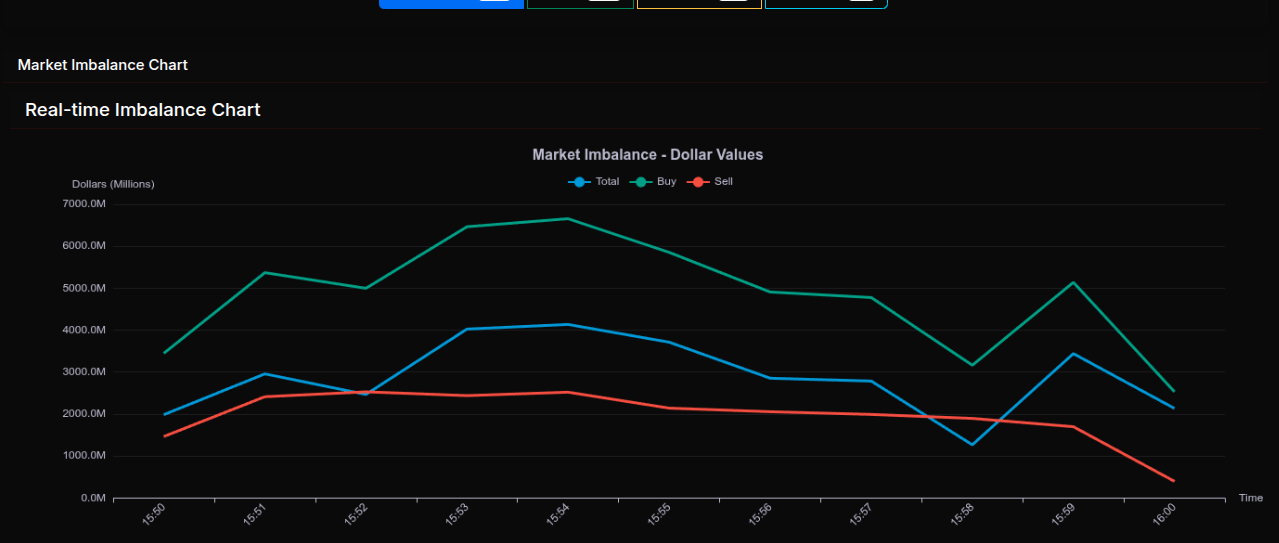
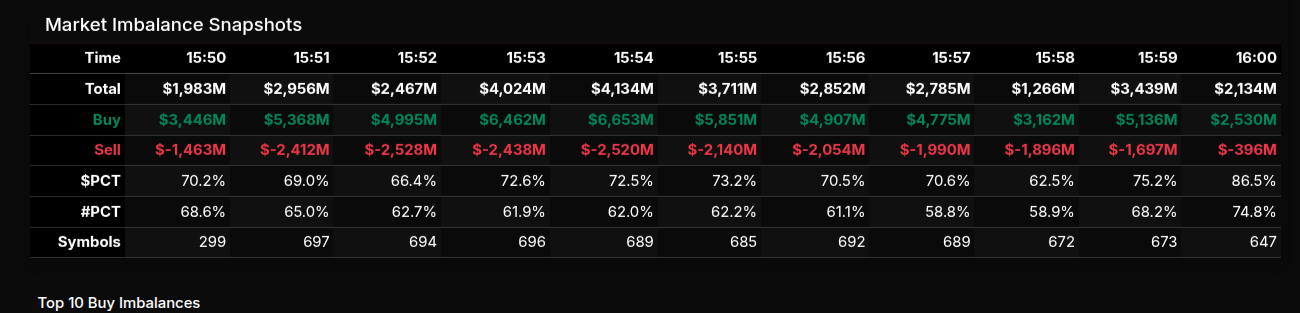
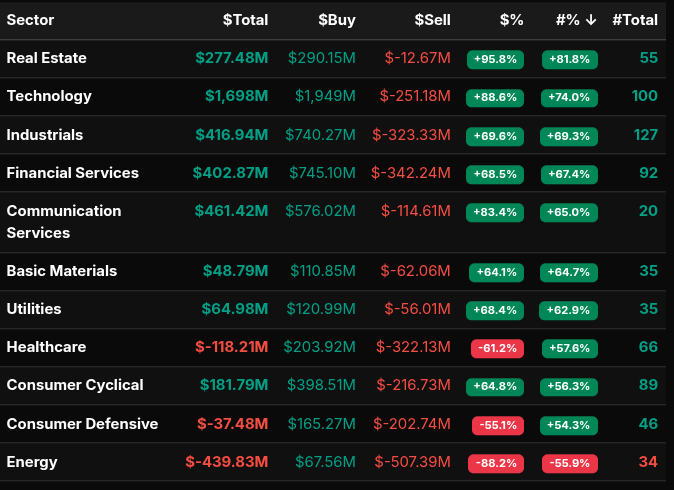
The Market-on-Close auction developed into a decisively buy-skewed session, but the internal structure showed clear rotation beneath the surface. Early snapshots saw steady accumulation, with total imbalances building from just under $2.0B at 15:50 to a peak above $4.1B around 15:54. Buy interest consistently dominated, holding near or above 70% of dollar flow for most of the window, confirming institutional participation rather than late retail noise. Although sell pressure remained elevated in absolute terms, it failed to overwhelm demand, and the auction ultimately resolved with a strong net buy imbalance into the 16:00 close.
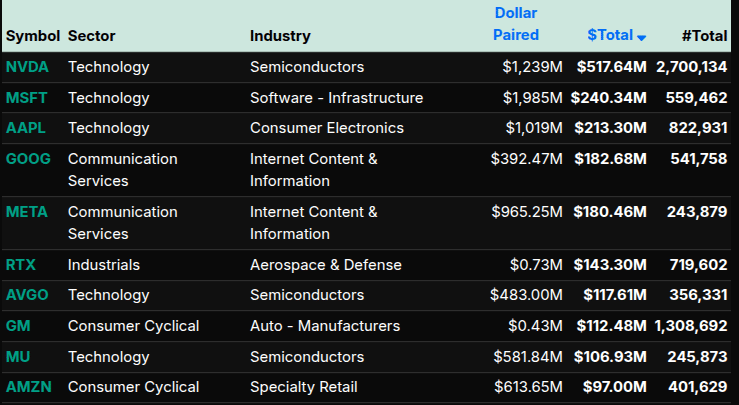
Sector activity highlighted where that demand was concentrated. Technology led the tape with a substantial net buy and a +88.6% dollar skew, signaling broad accumulation rather than narrow stock-specific flows. Industrials and Financial Services followed closely, both posting dollar leans near +70%, a level that reflects coordinated buying across multiple names. Communication Services also leaned strongly positive, reinforcing the risk-on tone. Real Estate stood out with one of the highest percentage skews at +95.8%, indicating near-wholesale buying despite more modest total dollars.
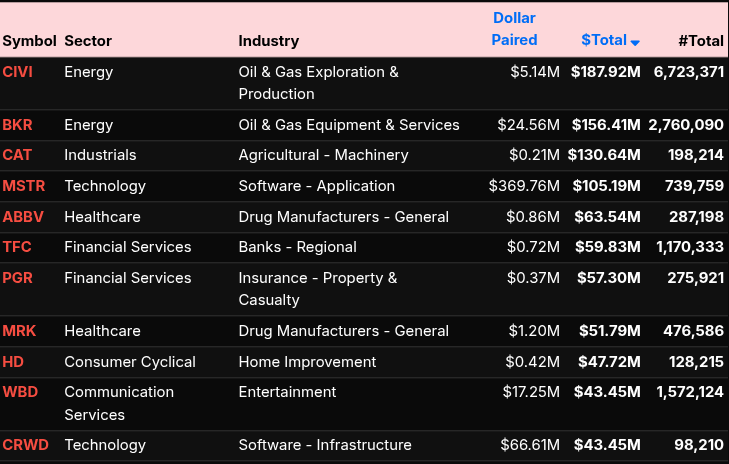
On the opposite end, Energy was the clear outlier. A deeply negative net imbalance and an -88.2% dollar skew marked it as a wholesale sell program, not simple rotation. Healthcare and Consumer Defensive also printed negative totals, but with percentage readings closer to the mid-50s to low-60s range, suggesting rotational selling rather than outright liquidation.
At the single-stock level, large-cap technology dominated buy imbalances. Semiconductors and mega-cap software names absorbed heavy demand, reinforcing the sector-level read. Meanwhile, Energy names populated the top sell lists, aligning cleanly with the sector data.
Taken together, the MOC told a coherent story: strong institutional buying into growth and cyclicals, selective but aggressive liquidation in Energy, and rotational trimming elsewhere. With many sector leans clustering near the 50–70% range, the auction reflected active rebalancing rather than indiscriminate risk-on chasing, even as the closing print favored the bulls.
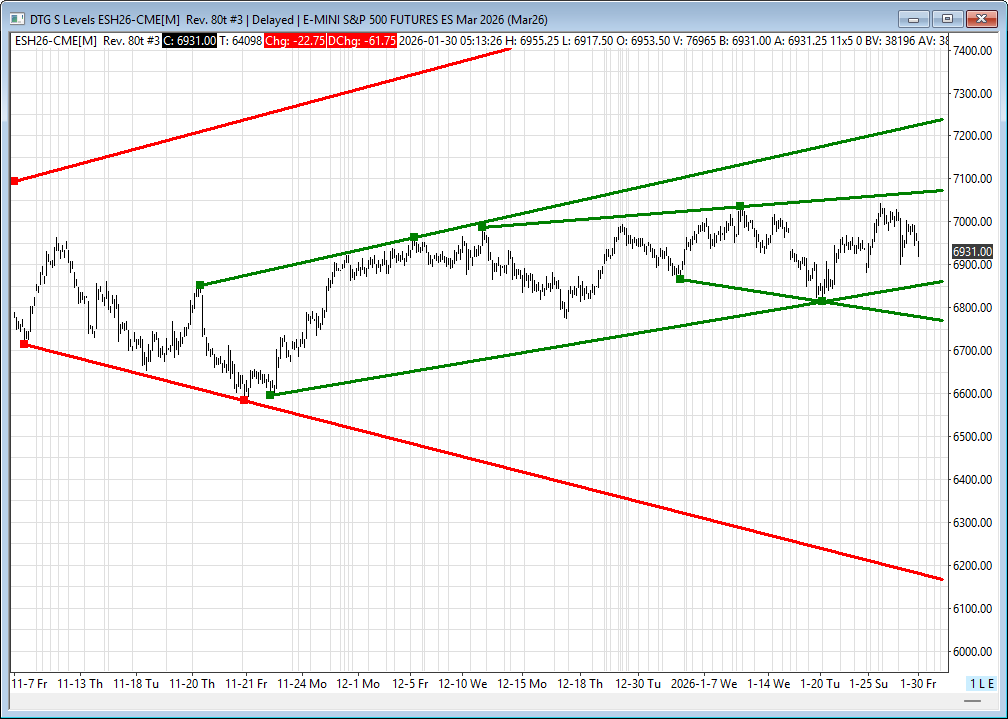
ES Levels
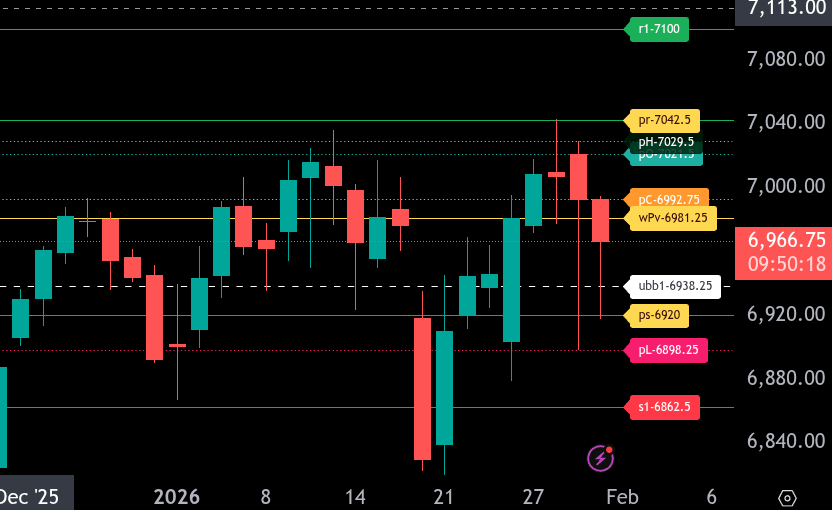
The bull/bear line for the ES is at 6981.25. This is the key level for today and defines the short-term directional bias.
ES is currently trading below the bull/bear line, keeping the tone bearish early in the session. As long as price remains below 6981.25, rallies are expected to encounter selling pressure.
On the downside, initial support is at 6920.00, followed by 6898.25. A break below these levels opens the door to 6862.50, which is the lower range target for today. Acceptance below 6862.50 would suggest expanding downside momentum.
On the upside, resistance sits at 6992.75 and then 7021.50. Above that, price can work toward 7029.50, with the upper range target at 7042.50. Bulls need a reclaim and hold above 6981.25 to neutralize the bearish bias.
Overall, ES remains bearish below 6981.25, with sellers favored unless buyers can reclaim that level and build acceptance higher.
NQ Levels
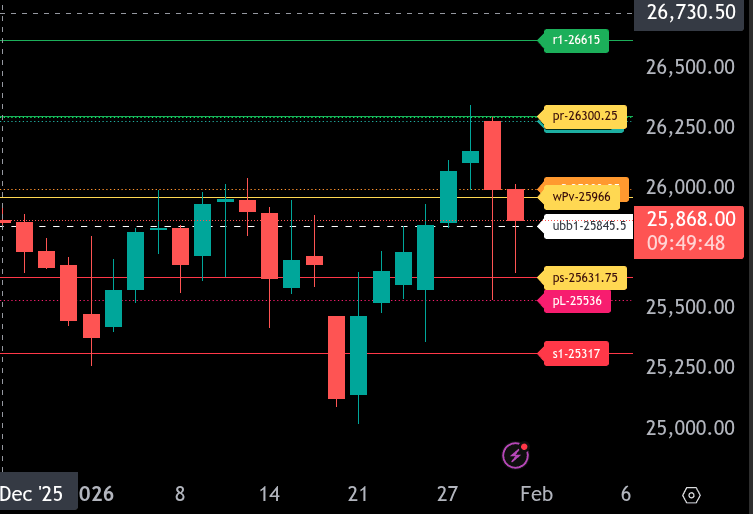
The bull/bear line for NQ is at 25,966. This remains the key pivot for today’s session. Acceptance above this level would shift intraday tone back to the upside, while continued trade below keeps pressure on sellers to defend lower support.
NQ is currently trading around 25,862, well below the bull/bear line, signaling continued weakness after the sharp rejection from the upper range. As long as price holds below 25,966, rallies are likely to be sold.
On the downside, initial support sits at 25,845.50, followed by 25,631.75, which marks the lower intraday range target. A clean break below 25,631.75 opens the door to 25,536 and potentially 25,317 if selling accelerates.
On the upside, first resistance comes in at 25,999.25. Above that, 26,300.25 is the upper range target and the key level bulls must reclaim to regain control. A sustained move above 26,300.25 would put 26,615 back in play.
Overall, the trend remains bearish below 25,966. Bulls need a strong reclaim and hold above this level to negate the current downside structure.
Technical Edge
Fair Values for January 30, 2026
-
SP: 25.88
-
NQ: 114.82
-
Dow: 118.3
Daily Breadth Data 📊
For Thursday, January 29, 2026
• NYSE Breadth: 55% Upside Volume
• Nasdaq Breadth: 36% Upside Volume
• Total Breadth: 39% Upside Volume
• NYSE Advance/Decline: 58% Advance
• Nasdaq Advance/Decline: 42% Advance
• Total Advance/Decline: 48% Advance
• NYSE New Highs/New Lows: 254 / 80
• Nasdaq New Highs/New Lows: 289 / 291
• NYSE TRIN: 1.25
• Nasdaq TRIN: 1.30
Weekly Breadth Data 📈
Week Ending Friday, January 23, 2026
• NYSE Breadth: 54% Upside Volume
• Nasdaq Breadth: 56% Upside Volume
• Total Breadth: 55% Upside Volume
• NYSE Advance/Decline: 50% Advance
• Nasdaq Advance/Decline: 51% Advance
• Total Advance/Decline: 51% Advance
• NYSE New Highs/New Lows: 437 / 76
• Nasdaq New Highs/New Lows: 742 / 335
• NYSE TRIN: 0.86
• Nasdaq TRIN: 0.83
Calendars
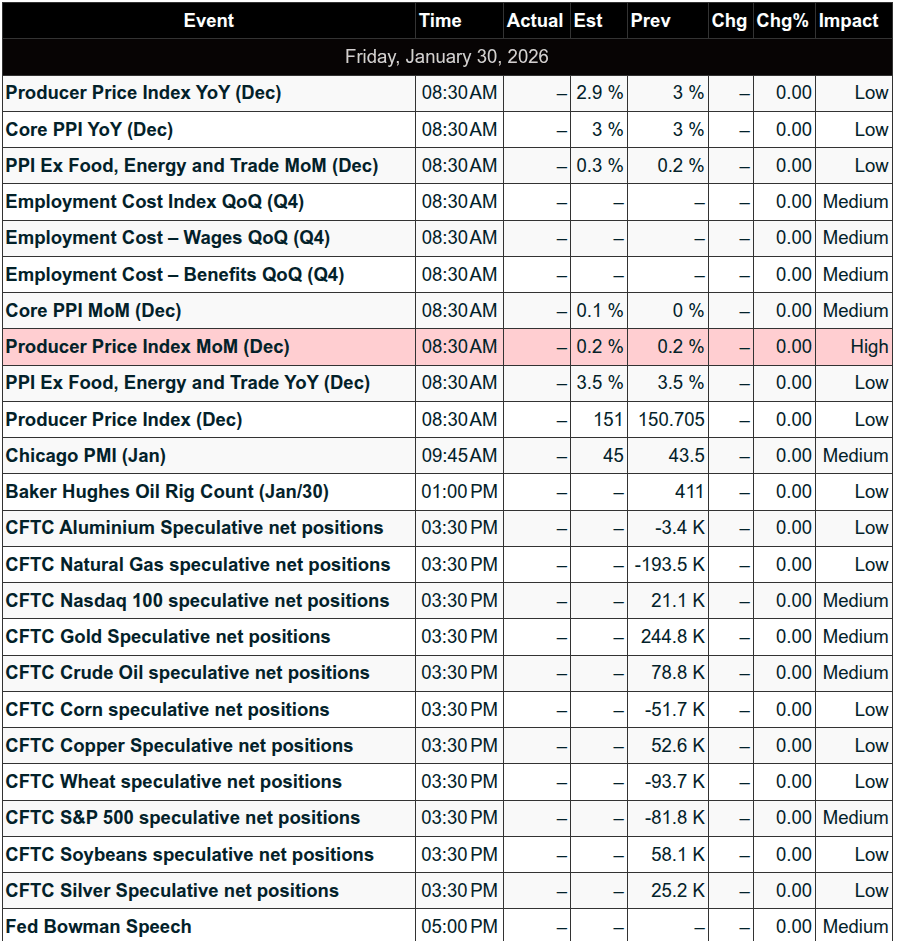
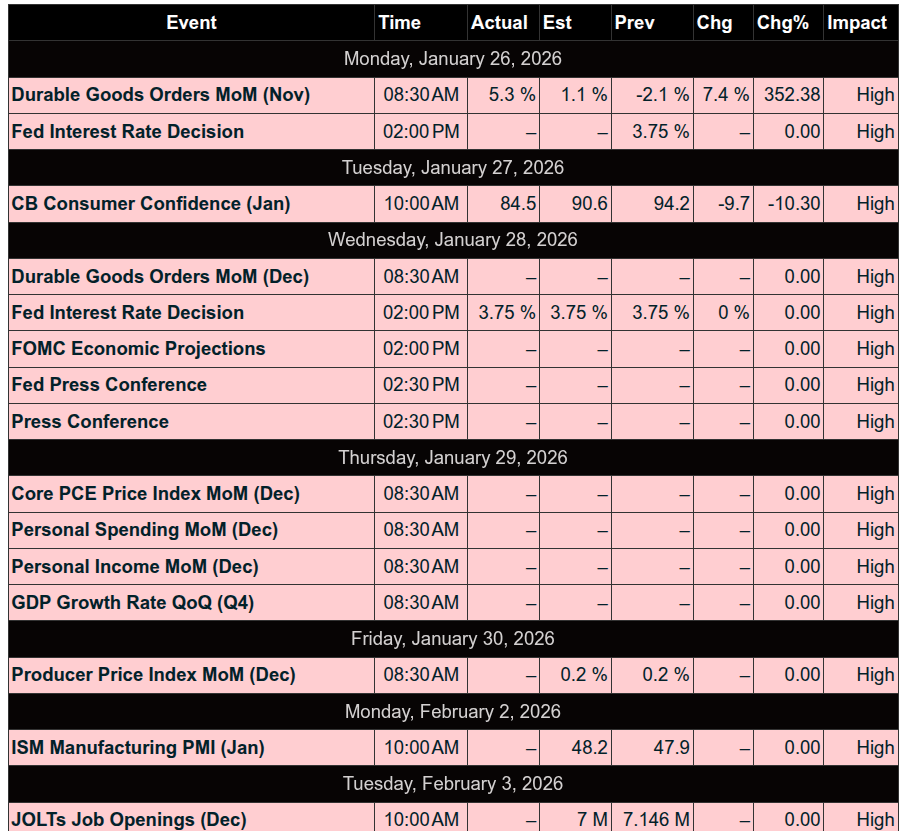
Economic Calendar Today
This Week’s High Importance
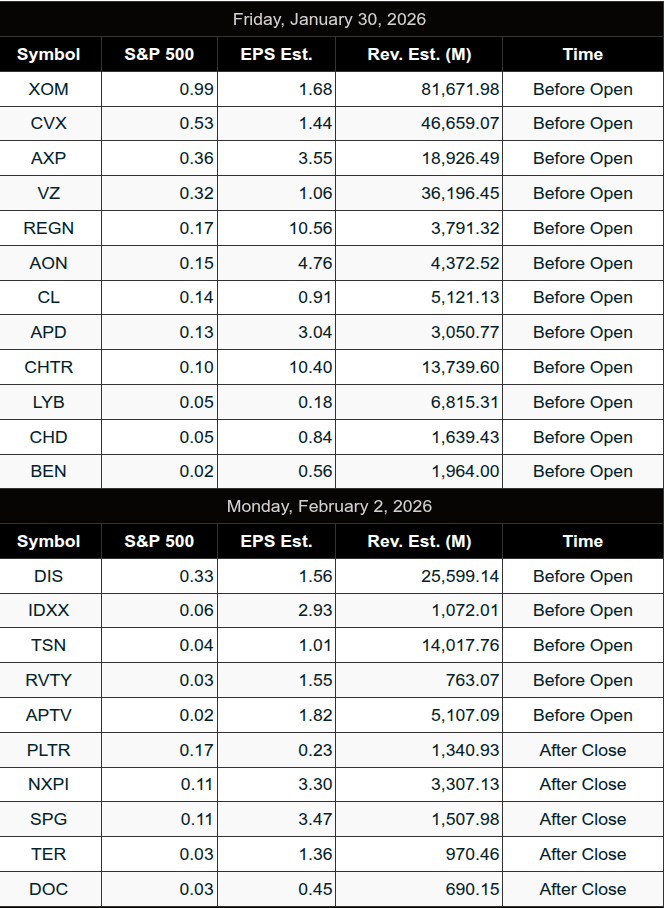
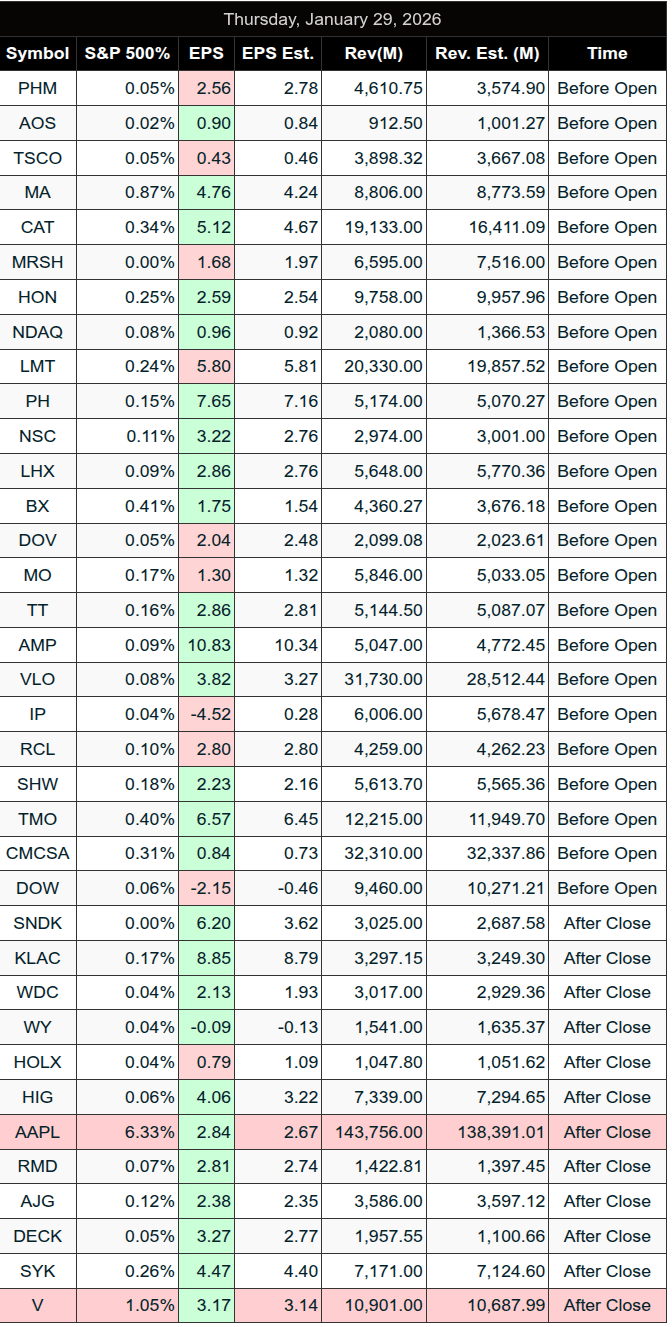
S&P 500 Earnings:
Upcoming:
Recent:
Trading Room News:
Polaris Trading Group Summary – For Thursday, January 29, 2026
Yesterday’s session delivered a textbook bearish playbook, with PTGDavid leading the room through a series of sharp, well-structured trades. The market leaned heavily to the short side from the open, and traders were rewarded for staying disciplined and aligned with the dominant cycle structure.
Key Highlights & Positive Trades:
-
Bearish Lean Confirmed Early:
David marked 6995 as the Line in the Sand (LIS), which was tested and rejected early on. This set the tone for the downside targets that followed.
He outlined the Bear Case with targets at 6985…6980…6975 — and each was quickly fulfilled, confirming the short bias. -
Open Range “Trifecta” Success:
The Open Range Strategy on ES, NQ, and CL all hit their targets early in the session. David declared it a “TRIFECTA”, which underscored the alignment across markets. -
Cycle Day Levels Hit:
-
The CD1 Average Decline Projection (6940.44) was met precisely.
-
Later, the session aligned with the Cycle Day 3 “Wild Card” behavior, showing extended volatility and deep downside action.
-
David noted that the CD3 Violation Level at 6940 was tagged, adding further confirmation to the pattern.
-
-
A10 Short Trade Executed Successfully:
David called a short from the 53 handle, scaled down with a final exit at 18.75, and managed the position using an A4 flip exit guide.
His colorful commentary — “When they pull the drain plug… all the sewage comes spewing out” — reflected the heavy selling pressure that unfolded. -
Afternoon Recovery & MOC Action:
While the afternoon offered little in terms of fresh setups, price recovered the prior low at 6977.25, which David called an “accomplishment” for the bulls.
A $4.5B MOC buy imbalance emerged into the close, suggesting institutional accumulation and setting the tone for a bullish Cycle Day 1 ahead.
Lessons & Takeaways:
-
Let the Market Lead:
David’s early rejection of longs and commitment to the short side reinforced the importance of respecting the tape and structure. -
Timing Matters:
Once again, most of the opportunity was in the morning, with David confirming that he trades the afternoon less than 10% of the time. -
Cycle Awareness Is Key:
Traders benefited from understanding Cycle Day dynamics, particularly how CD3 “Wild Card” behavior can lead to extreme price movement. -
End-of-Day Clues:
The MOC imbalance provided valuable information for planning the next day’s session, helping traders anticipate potential strength into Cycle Day 1.
End-of-Day Reflection:
-
David noted a “YUGE Range Runner” pattern played out, offering generous short-side opportunities throughout the morning.
-
Despite a slow afternoon, the late-day recovery and bullish closing momentum set the stage for a buy-the-dip approach into Friday.
Summary: Thursday was a strong day for PTG traders who stayed short-biased, followed the structure, and executed the plan. With multiple targets hit, cycle levels fulfilled, and a solid A10 short trade in play, it was a clear example of trading with discipline and context.
Looking ahead: Friday (Cycle Day 1) was expected to offer dip-buying opportunities after Thursday’s deep CD3 decline.
DTG Room Preview – Friday, January 30, 2026
Market Focus:
-
Eyes on corporate earnings and potential Fed chair nomination.
-
President Trump expected to nominate Kevin Warsh, seen as the most hawkish of the candidates.
-
Result: USD up 0.3%, gold down 10%, silver down 20%.
-
Market Action:
-
After Thursday’s wild swing, ES futures tumbled overnight, pressured by:
-
Apple earnings call comments.
-
Fed chair speculation.
-
Apple (AAPL) Earnings:
-
Revenue: $85.3B (vs. $69.1B YoY).
-
China sales up 38% YoY to $25.5B.
-
CEO warns of margin pressure from global memory chip crunch due to AI data center demand.
Political News:
-
Trump & Senate Democrats reach deal on ICE/Border Patrol restrictions after fatal protest incident.
-
Homeland Security funding still pending but expected to resolve soon.
Earnings Today (Premarket):
-
AXP, AON, CHTR, CVX, CL, XOM, VZ, ADP, CNI, CHD, LTM, LYB, NMR, REGN, SOFI
Monday Earnings Preview:
-
Walt Disney (DIS)
-
Tyson Foods (TSN)
Economic Calendar:
-
PPI @ 8:30am ET
-
Chicago PMI @ 9:45am ET
-
Fed’s Musalem speech @ 12:30pm ET
ES Futures Overview:
-
Thursday: 130-pt range, volatility rising.
-
5-day ATR at 80 points.
-
Overnight: ES dropped again, retesting 50-day MA (6906.25).
Key Technical Levels:
-
Support:
-
6906.25 (50-day MA)
-
6856/61 (TL support)
-
6775/80
-
-
Resistance:
-
7070/75 (inside TL)
-
7236/41
-
Summary:
-
Volatility remains elevated.
-
Watch for key levels to hold — bulls eyeing 7070/75 breakout, bears pressing for 6856/61 test.
Affiliate Disclosure: This newsletter may contain affiliate links, which means we may earn a commission if you click through and make a purchase. This comes at no additional cost to you and helps us continue providing valuable content. We only recommend products or services we genuinely believe in. Thank you for your support!
Disclaimer: Charts and analysis are for discussion and education purposes only. I am not a financial advisor, do not give financial advice and am not recommending the buying or selling of any security.
Remember: Not all setups will trigger. Not all setups will be profitable. Not all setups should be taken. These are simply the setups that I have put together for years on my own and what I watch as part of my own “game plan” coming into each day. Good luck!!
Follow @MrTopStep on Twitter and please share if you find our work valuable!
This post goes out as an email to our subscribers every day and is posted for free here around 2 PM ET. To get your real-time copy, sign up for the free or premium version here: Opening Print Subscribe.
Comments are closed