This post goes out as an email to our subscribers every day and is posted for free here around 2 PM ET. To get your real-time copy, sign up for the free or premium version here: Opening Print Subscribe.
Nothing Goes Up Forever — ES Hits Another High While the NQ Takes It on the Chin
Follow @MrTopStep on Twitter and please share if you find our work valuable!
Our View
There has been a lot of talk about Tech / AI losing some of its glimmer. I’m not sure about that, but what I am sure about is that there have been a lot of big rotations — especially last week. The Dow and S&P made new all-contract highs, while the Nasdaq is 1.4% off its 52-week high, and the Russell 2000 closed up 0.8% and up 4.6% on the week.
I saw a lot of rotations at my S&P desk for above futures repositioning for pension hedge funds, but it was much more defined for the portfolio managers, AIG, and Bank of America business. But it’s a whole different story today, as there is some type of rotation literally going on every day. It’s also something I believe can — and should — be tracked.
Our View
It’s Saturday at 6:30 p.m. The temperature in Delray has dropped below 40 degrees and is heading into the 30s. Tomorrow, it could dip into the 20s. But it’s not the temperature that concerns me. It’s a story I wrote about in the Opening Print two weeks ago about MicroStrategy’s Michael Saylor and his multi-billion-dollar holding of Bitcoin.
Bitcoin dropped to 76,037, and Saylor’s $54 billion Bitcoin bet has come under scrutiny, with just an 11% unrealized gain following a significant market drawdown. Despite the decline, the firm doubled down with a $264.1 million purchase at an average price of $90,061, bringing its total holdings to 712,647 BTC. Meanwhile, gold surged toward $5,500, sparking debate over Saylor’s refusal to diversify into traditional safe-haven assets, like silver and gold. When margin requirements are raised—which they have been—it tends to set up highs or correction phases. But Saylor’s concentrated bet has caused both concern and scrutiny among some of the top traders in the world. All you have to do is Google it or use an AI tool and ask if there’s concern over his holdings.
I’ve always had my doubts about Bitcoin. First, it was all the customer funds that had been stolen. Then, it was the lack of regulation. And for the last several months, I’ve heard that at some point Saylor could be pushed out of the position, and that liquidation would cause panic selling and large public losses,just like it did when BTC dropped from 70K to under 20K.
As I’ve said many times, we live in an ever-changing world where nothing stays the same. Here are some BTCG25 futures levels to watch:
75,000–74,000, 72,000–70,000, 68,000–65,000, 62,000–60,000, and 56,000.
File for Levels Here
Our Lean
I want to start by saying that no one knows for sure what the markets will do next. But as I’ve written, there seems to be something going on under the surface—namely, liquidation.
Gold plunged 11%, with GCG26 (gold futures) making a high on Wednesday at $5,586.50, then selling off to $4,700.00 on Friday—a drop of $886.50. Silver dropped 31%, with SIG26 (silver futures) hitting a high on Thursday at $121.300, before falling to $76.025—a $45.275 decline, which equals a $226,375 loss for one futures contract. Both metals suffered their worst one-day slides since 1980.
Meanwhile, the Dollar Index rose 0.9%—its sharpest increase since May—while longer-term bond yields edged higher. NVIDIA and OpenAI have paused their $100 billion mega deal.
I think the markets have entered a period of extreme anxiety and hyper-volatility. My guess is that Trump has backed himself into another corner with Iran. A lot of people think an attack is coming, and think negotiations are being used as a delay tactic. Others believe it’s just posturing and no strike will occur, citing CIA briefings on Iran’s missile threats and the risks to U.S. interests.
My gut says he doesn’t attack, and when the posture is lowered, the markets will rally. But this continues to be a very fluid situation.
Additionally, it’s not just the ES and NQ that have seen a pickup in volatility—gold, silver, and the crypto markets have as well.
Our lean: I can’t rule out a breakthrough between Trump and Iran, but until then, I still think the play is selling the dead cat rips.
I’m sorry I can’t be more specific, but based on the current price action… less is more.
Market Recap
The ES and NQ had a very volatile trade during the overnight Globex session. The ES made an early high at 6995.00 and sold off down to 6917.50 on oversized volume of 314K. It then opened Friday’s regular session at 6966.25, traded 6964.25, and raced up to 6981.75 before selling off down to 6981.50 at 9:32.
After the drop, the ES rallied to a new high at 6985.50 at 9:40, covering a lot of ground in the first 10 minutes. Following the new high, the ES sold off to 6960.25, traded up to 6989.00, then sold off down to 6957.00 at 10:30. It rallied all the way back up to 6990.75 at 10:45, dropped again to the prior low of 6957.00, traded back up to 6972.50, and then sold off to a new daily low at 6935.00 at 12:06.
From there, the ES rallied back up to the VWAP at 6963.50, traded down to 6943.50, and then rallied to a lower high at 6959.50 at 12:45. It sold off again to 6936.50 at 1:00, bounced to another lower high at 6950.50 at 1:15, and then dumped to a new daily low at 6918.75 at 1:15—just 1.24 points above the 6917.50 Globex low.
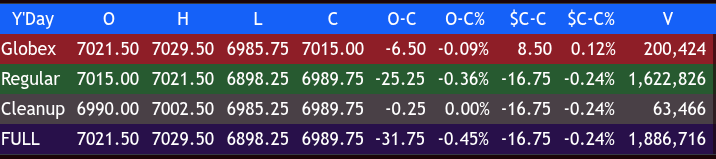
After that low, the ES rallied back up to 6975.25 at 2:05, sold off to 6953.50, traded up to 6971.00 at 2:55, sold off again to 6940.75 at 3:20, bounced to 6974.25, pulled back and traded 6970.00 as the 3:50 cash imbalance showed $3.2 billion to buy, which was the driver behind the rally, and ultimately settled at 6964.00, down 27 points or -0.39%.
The NQ settled at 25,670.00, down 325.25 points or -1.27% (down 1.78% over the last two sessions). The YM settled at 49,008, down 162 points or -0.33%, and the RTY settled at 2,607.50, down 39.50 points or -1.48% on the day.
In terms of the ES and NQ’s overall tone, it was a rocky week for the indices, marked by an excess of buy and sell programs and elevated volumes. It was clear that the NQ was the weaker of the two. For the ES’s overall trade, total Globex volume came in at 314K (high), with 1.611 million traded during the day session, for a combined daily total of 1.927 million contracts.
There’s an old saying: nothing goes up forever. From the ES’s March 9, 2009 credit crisis low to its new contract high at 7043.00, the ES has gained 941%. From its March 23, 2020 COVID-19 low at 2237 to its new high, it has gained 214%.
On Tap – Upcoming Week (February 2–6)
Monday, Feb 2
Before Open: Disney (DIS), Tyson (TSN), IDEXX (IDXX)
Data: Auto Sales, 9:45 S&P Mfg PMI, 10:00 ISM Mfg
After Close: Palantir (PLTR), NXP Semi (NXPI), Simon Property (SPG)
Tuesday, Feb 3
Before Open: Pfizer (PFE), Eaton (ETN)
Data: 9:45 S&P Services PMI, 10:00 JOLTS / ISM Services
After Close: AMD (AMD), PayPal (PYPL), Super Micro (SMCI)
Wednesday, Feb 4
Before Open: Eli Lilly (LLY), AbbVie (ABBV), Boston Scientific (BSX)
Data: 8:15 ADP Employment
After Close: Alphabet (GOOGL), Qualcomm (QCOM), Uber (UBER), Snap (SNAP)
Thursday, Feb 5
Before Open: Merck (MRK), ConocoPhillips (COP)
Data: 8:30 Jobless Claims, 10:50 Fed’s Bostic
After Close: Amazon (AMZN), ARM Holdings (ARM), MicroStrategy (MSTR)
Friday, Feb 6
Before Open: PepsiCo (PEP), Biogen (BIIB)
Data: 8:30 Jobs Report, 10:00 Sentiment, 3:00 Credit
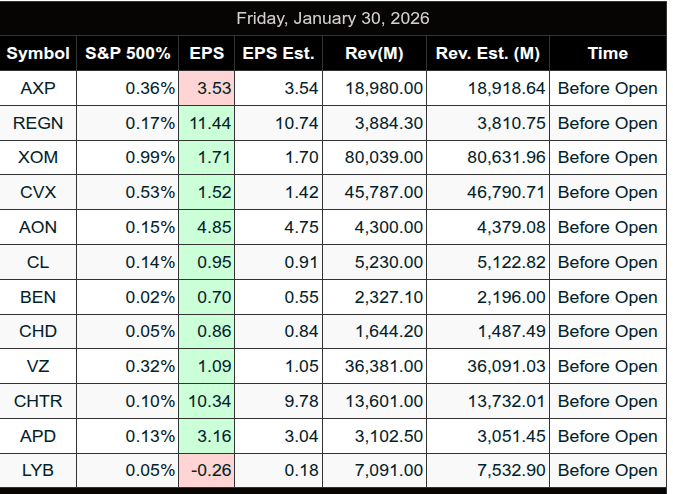
According to @TrimTabs, as of January 30, 2026, approximately 33% of S&P 500 companies have reported their actual results for the Q4 2025 earnings season. I’ve always been a big fan of TrimTabs, and here’s the link to read more about the Q4 2025 earnings season: S&P 500 Earnings Season Update

MiM
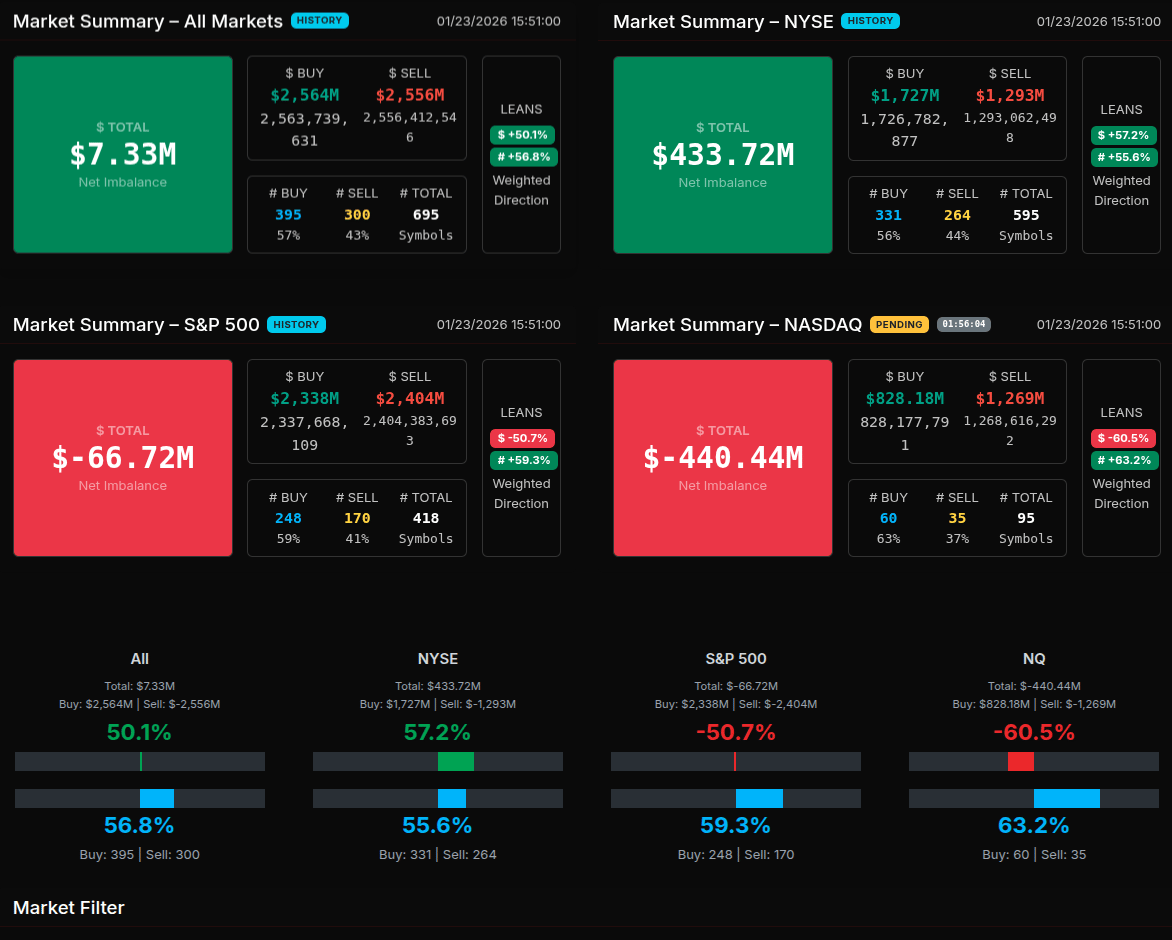
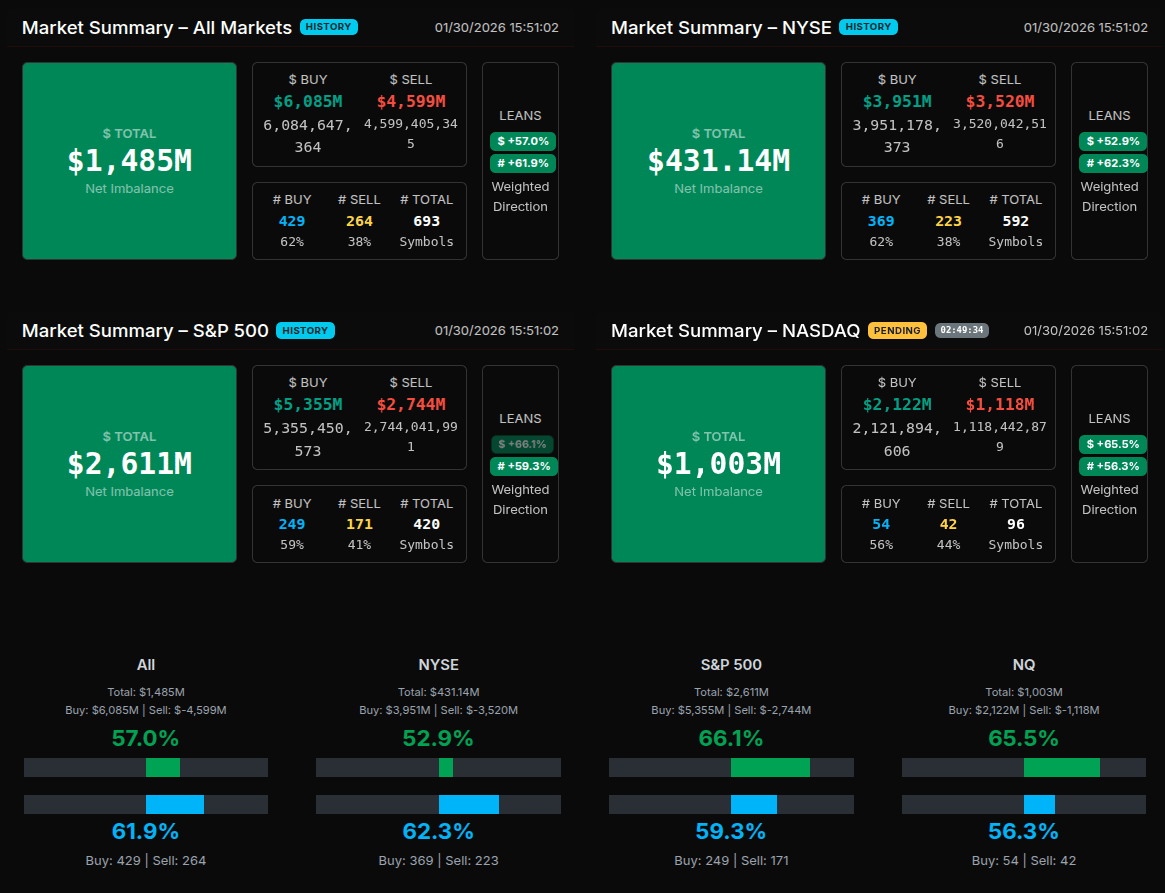
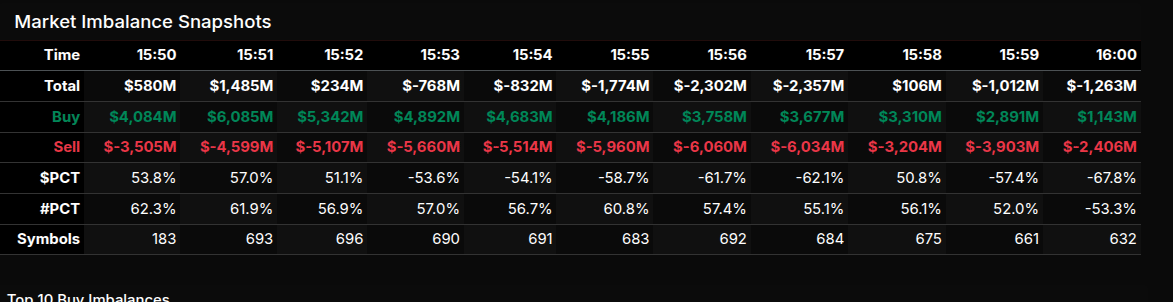
The Market-on-Close auction opened with a clear buy-side bias that quickly set the tone for the final ten minutes of trade. Early snapshots around 15:50–15:51 showed net imbalances flipping decisively positive, peaking near +$1.5B as buy programs overwhelmed sell interest. This initial strength reflected broad participation, with symbol counts expanding rapidly and buy percentages pushing into the high-50s to low-60s range—more rotational than wholesale, but firmly constructive.
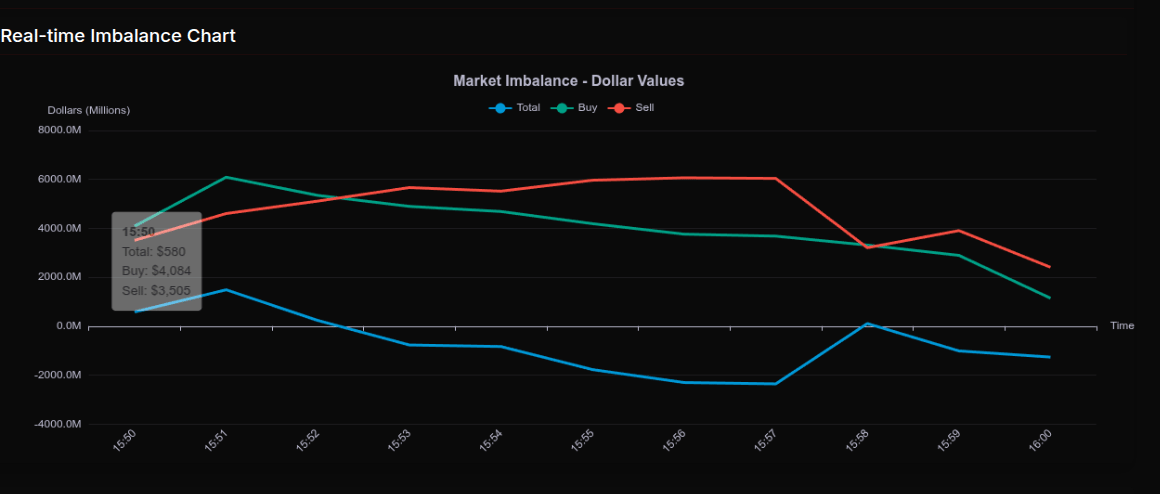
As the auction progressed, the character shifted. From roughly 15:53 through 15:57, sell pressure accelerated sharply, dragging the net imbalance deeply negative and signaling active distribution rather than passive rotation. Dollar-weighted selling intensified even as symbol counts stayed elevated, suggesting institutional sellers leaning into liquidity rather than a simple unwind. Notably, several readings pushed past the -60% threshold, a level that typically reflects wholesale selling rather than two-way trade.
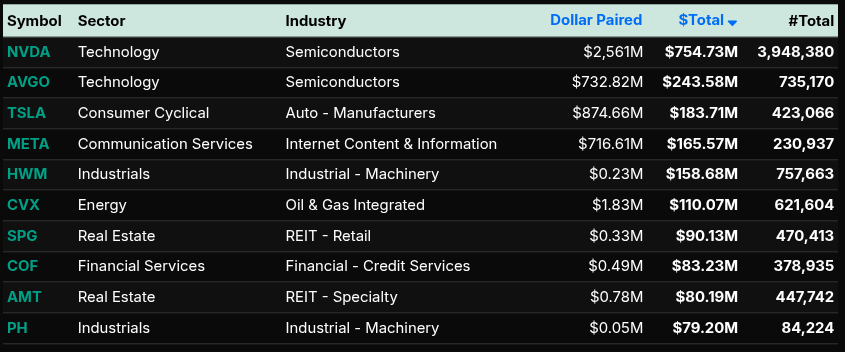
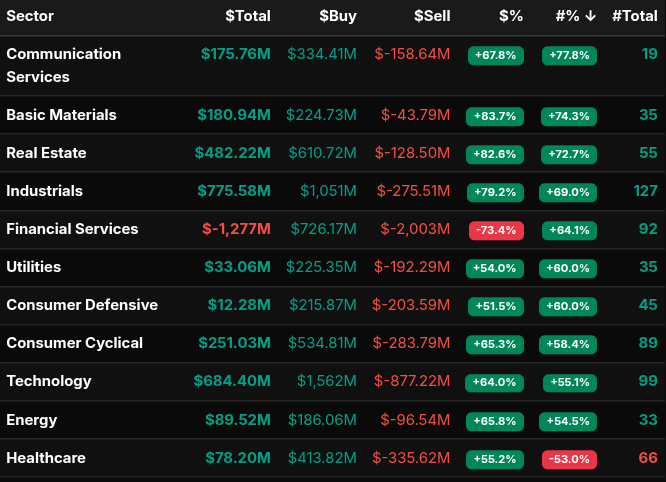
Sector flows told a more nuanced story. Industrials, Technology, Real Estate, and Consumer Cyclical all posted strong positive dollar totals, each with buy leans north of 64%, indicating sustained demand beneath the surface. Technology stood out as both highly active and strongly bid, reinforcing its leadership role into the close. Basic Materials and Communication Services also leaned decisively higher, consistent with risk-on allocation.
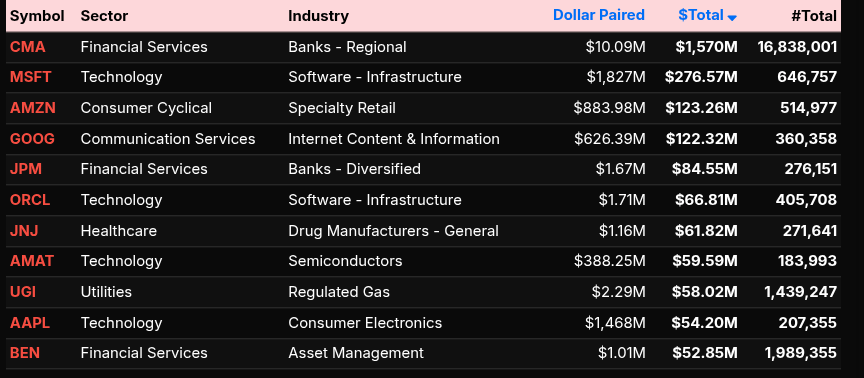
In contrast, Financial Services was the clear outlier, registering a deeply negative net imbalance and a -73% sell lean—an unmistakable wholesale sell signal. Healthcare also saw notable selling pressure, with a negative symbol skew suggesting sector-specific de-risking rather than market-wide weakness.
At the single-stock level, large-cap tech and momentum names dominated the buy side, while select financials absorbed concentrated sell programs. By 16:00, the tape settled with a negative net imbalance, but the late rebound attempts hinted at tactical buyers stepping back in.
Overall, the MOC reflected a market rotating aggressively across sectors, punctuated by targeted institutional selling—especially in financials—rather than a uniform risk-off exit.nsive and industrial accumulation into the close.
Technical Edge
Fair Values for January 26, 2026
-
SP: 28.61
-
NQ: 123.17
-
Dow: 144.46
Daily Breadth Data 📊
For Friday, January 30, 2026
• NYSE Breadth: 37% Upside Volume
• Nasdaq Breadth: 34% Upside Volume
• Total Breadth: 35% Upside Volume
• NYSE Advance/Decline: 42% Advance
• Nasdaq Advance/Decline: 33% Advance
• Total Advance/Decline: 36% Advance
• NYSE New Highs/New Lows: 95 / 70
• Nasdaq New Highs/New Lows: 137 / 280
• NYSE TRIN: 1.36
• Nasdaq TRIN: 0.95
Weekly Breadth Data 📈
For Week Ending January 30, 2026
• NYSE Breadth: 46% Upside Volume
• Nasdaq Breadth: 46% Upside Volume
• Total Breadth: 46% Upside Volume
• NYSE Advance/Decline: 47% Advance
• Nasdaq Advance/Decline: 35% Advance
• Total Advance/Decline: 39% Advance
• NYSE New Highs/New Lows: 452 / 119
• Nasdaq New Highs/New Lows: 667 / 458
• NYSE TRIN: 0.99
• Nasdaq TRIN: 0.64
Today’s BTS Levels:
ES H
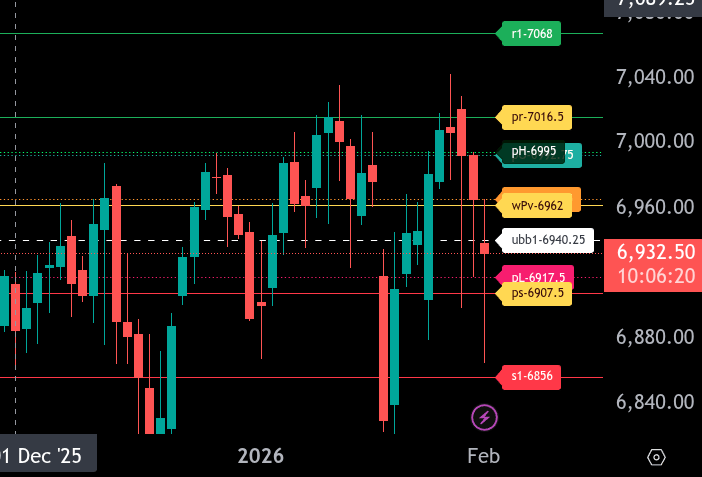
The bull/bear line for the ES is at 6962.00. This level defines the tone for the session. Acceptance above it keeps the market in a neutral-to-bullish posture, while sustained trade below it favors sellers.
ES is currently trading around 6931.75, firmly below the bull/bear line, indicating short-term weakness coming out of the overnight session. As long as price remains below 6962.00, rallies should be treated as corrective.
Immediate resistance above the 6962 is found at 6992.75, followed by 7016.50. These levels represent key upside checkpoints where sellers are likely to respond. A clean reclaim and hold above 7016.50 would open the door to a rotation toward 7068.00.
On the downside, initial support comes in at 6917.50. Failure to hold this level increases the risk of a move toward 6907.50, which is the lower range target for the session. A break below 6907.50 exposes further downside risk toward 6856.00.
Overall, the ES remains bearish below 6962.00. Bulls need a decisive reclaim of this level to stabilize the tape, while continued trade below it keeps pressure on the downside with lower targets in play.
NQ H
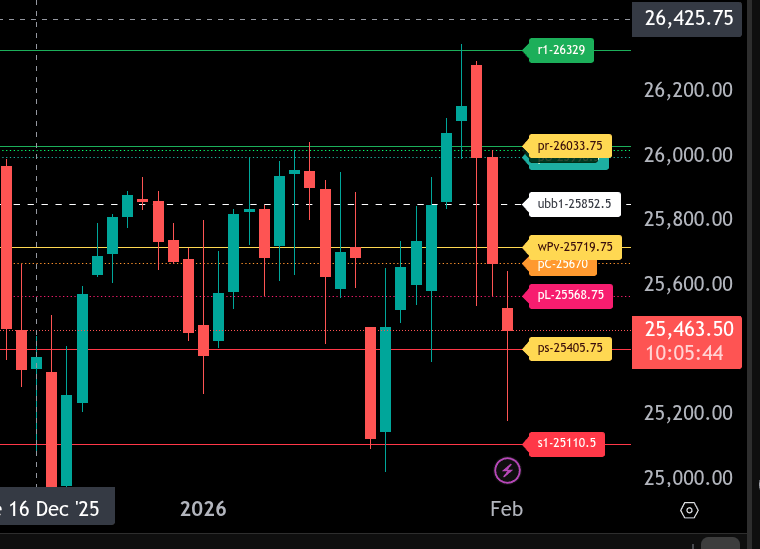
The bull/bear line for the NQ is at 25719.75. This remains the key pivot for directional bias heading into the session.
Overnight trade showed extreme volatility, with a sharp push higher into the 26200–26329 area followed by an aggressive selloff. Current price is trading well below the bull/bear line, keeping near-term pressure to the downside.
As long as NQ holds below 25719.75, sellers remain in control. Initial downside support sits at 25568.75. A failure to capture that by the open puts eyes on 25405.75, which is the lower range target for the session. Acceptance below 25405.75 would suggest continuation selling and weak auction structure.
On the upside, the first resistance zone is 25998.50 to 26020. A reclaim and hold above this area would put 26033.75 in play, followed by the upper resistance band near 26329. Bulls would need acceptance back above 25719.75 to stabilize conditions and shift momentum.
Overall, the tone remains bearish below the bull/bear line, with sharp two-way rotations likely given the size of the overnight range. Expect fast moves and limited follow-through unless price can reclaim and hold above key resistance.
Calendars
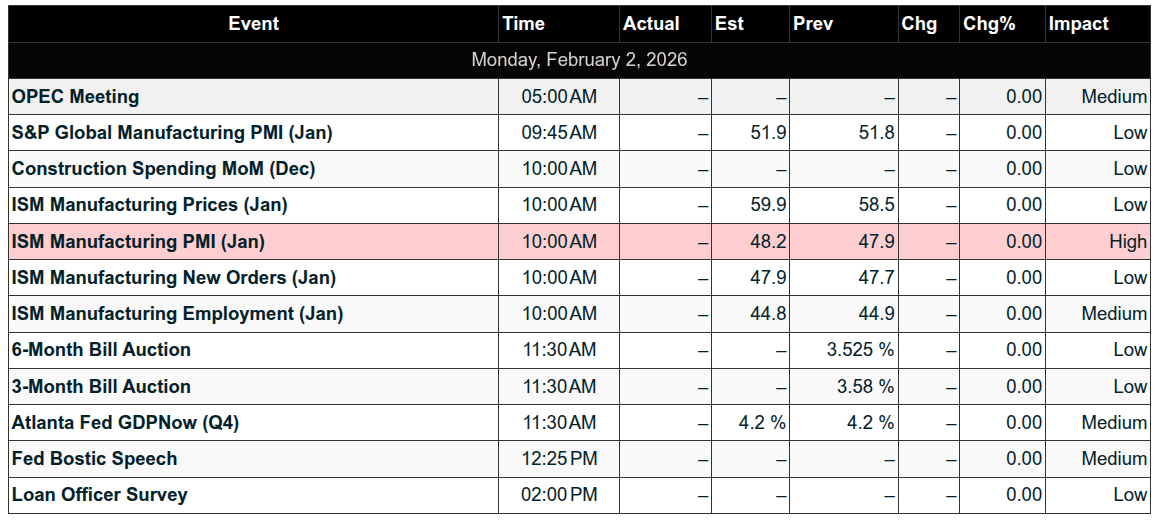
Today’s Economic Calendar
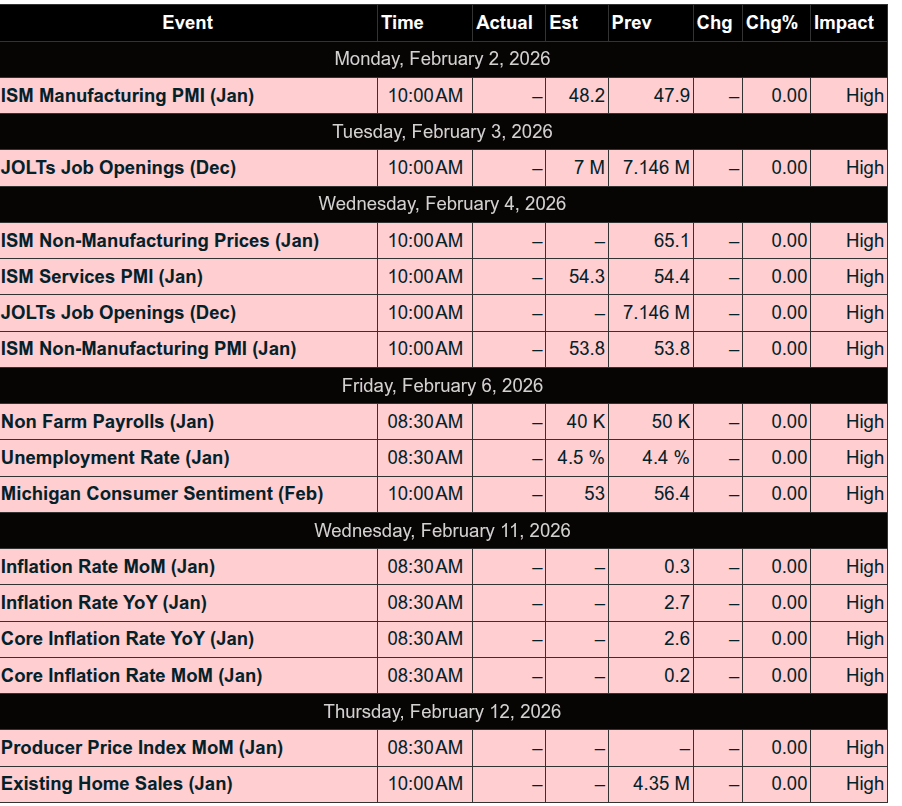
This Week’s Important Economic Events
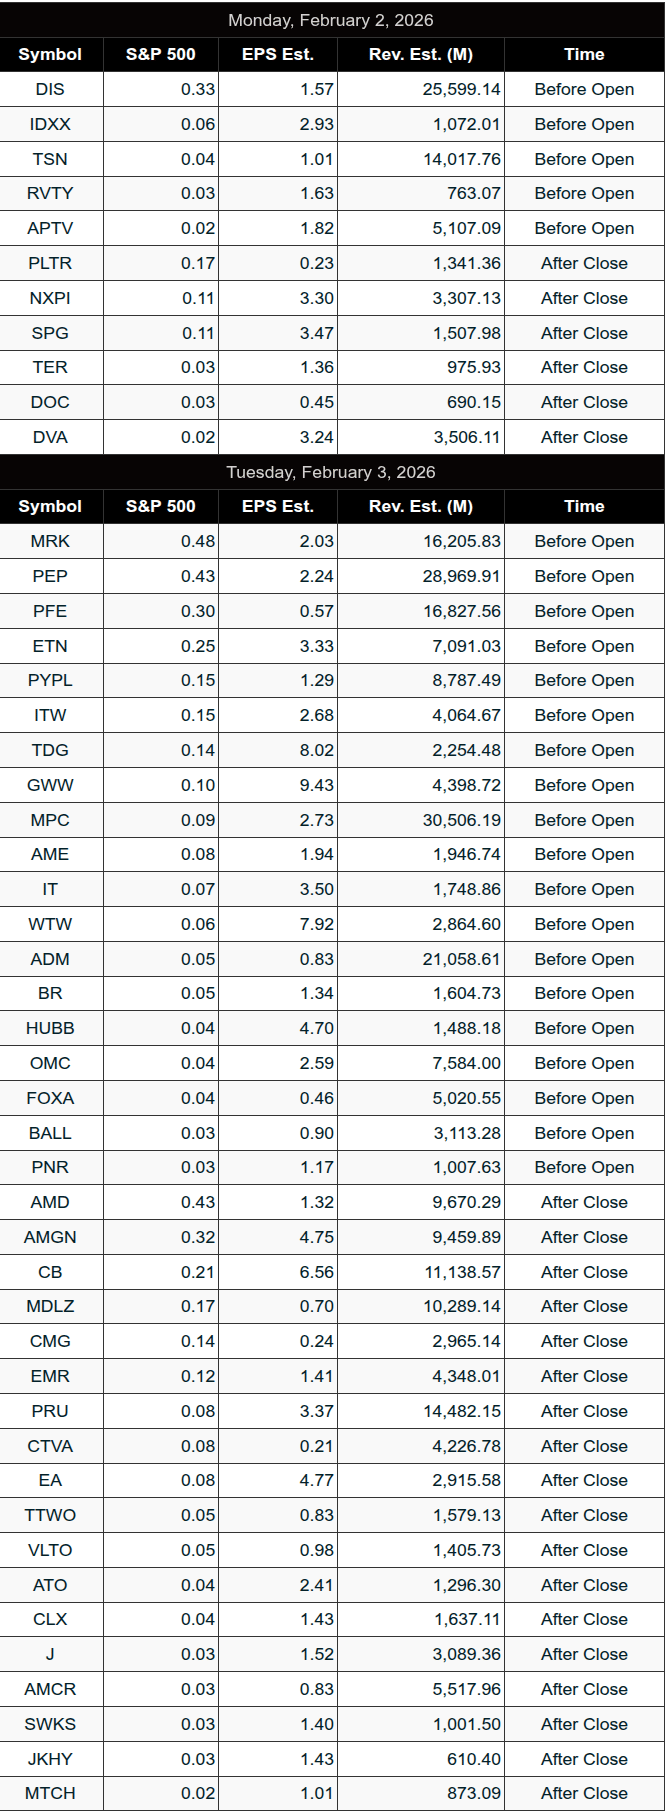
Upcoming Earnings – SP500
Recent Earnings
Room Summaries:
Polaris Trading Group Summary – Friday, January 30, 2026
Theme of the Day: FRYday, Cycle Day 1, and Capital Preservation
Despite PTGDavid being under the weather and limiting interaction, the PTG trading room executed a disciplined and profitable session — emphasizing preparation, patience, and capital preservation.
Pre-Market Highlights
-
Manny set the tone early, sharing his pre-market plan in The Pit.
-
PTGDavid confirmed it was Cycle Day 1 (CD1) with an early neutral bias and a classic “buy weakness, not chase strength” playbook.
-
The CD1 decline target of 6922–6905 was already hit overnight — a key setup milestone ✅.
Trade Highlights & Executions
Manny’s Precision Pays Off
-
+5 pts from Setup #2: Support Buy 6948–6952 ➝ 6965.75 fill.
-
+10 pts from same level — trade paid twice, both long and short.
-
Execution charts posted, showing clear alignment with the setups.
Setup #5 Breakdown Short
-
Pre-market level (6948–6952) once again respected.
-
Manny pulled +5pts and +10pts from shorts off that same zone.
-
Key lesson: even if a setup isn’t taken, mark the level — it paid both directions.
Lessons & Takeaways
-
Patience Pays: CD1 emphasized waiting for price to come to you, not chasing strength.
-
Level Respect: Zones from pre-market setups triggered twice, reinforcing the value of preparation.
-
Capital Preservation: As PTGDavid reminded, “FRYday is about survival” — protect your week’s gains.
Technical Notes
-
LIS tested at 6990
-
Central Pivot: 6970
-
Gamma Risk Pivots: SPX 695 / ES 6978
-
DLMB Zones updated dynamically and observed in real-time.
Wrap-Up
-
PTGDavid signed off mid-morning, reminding traders to keep warm and stay disciplined.
-
Charts remained live but with no further commentary.
-
Manny kept momentum going into the noon hour with clear execution and thoughtful reflections.
DTG Room Preview – Monday, February 2, 2026
Markets are under pressure to start February, with a broad selloff across U.S. stock futures, precious metals, and crypto. Hawkish expectations surrounding Fed Chair nominee Kevin Warsh are driving a stronger dollar and triggering reassessments across asset classes, including potential rate cut outlooks.
Gold and silver reversed their 2026 gains in one session Friday, but dovish signals from Warsh could quickly reignite momentum in metals.
AI Sector Volatility
The AI trade remains volatile. While earnings beats are common in the sector, market reactions have varied — META surged, MSFT fell. Small-cap AI names are outperforming as Big Tech pours billions into infrastructure. High demand for AI-related memory and storage continues to benefit Micron (MU) and Sandisk (SNDK).
Earnings Week Highlights
Over 100 S&P 500 names report this week, including:
-
Today Premarket: DIS, TSN, APTV, FN, IDXX, MFG, RVTY
-
After the Bell: PLTR, NXPI, DOC, RMBS, SPG, TER, WWD
-
Tuesday AM: ADM, ETN, FOX, MPC, MRK, OMC, PYPL, PEP, PFE
Economic Data & Fed Speakers
Key events:
-
Today: S&P Global Manufacturing PMI (9:45am), ISM Manufacturing PMI & Prices (10:00am), Fed’s Bostic (12:30pm)
-
Friday: January Jobs Report
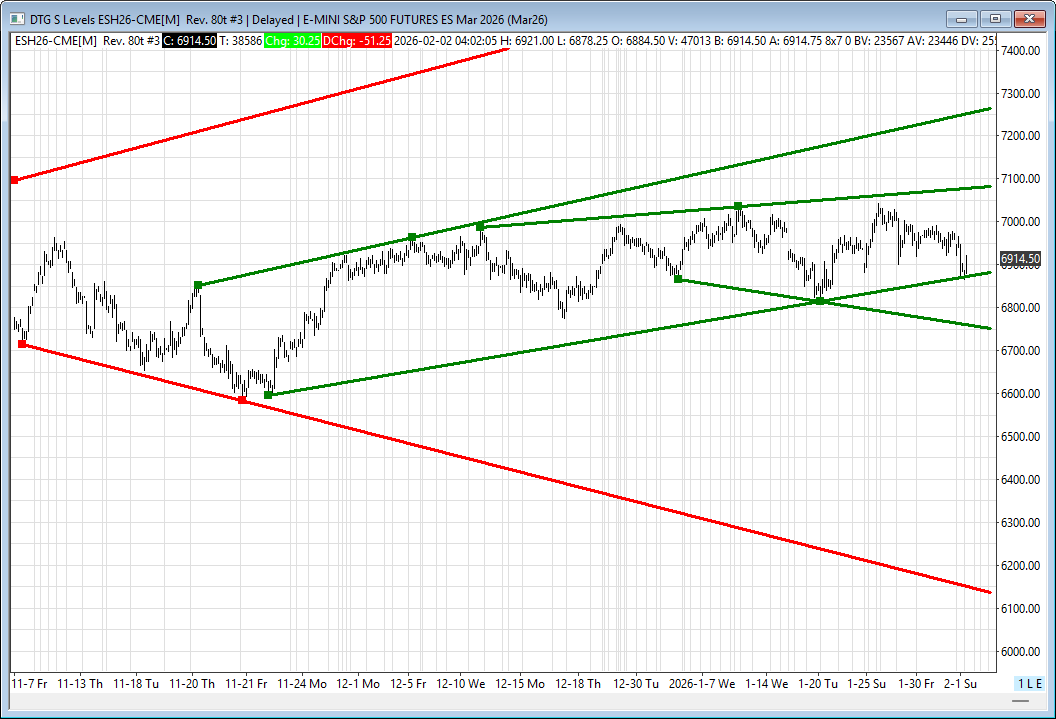
Futures Technicals – ES Levels
-
Price has broken below the 50-day MA (6914.50) but bounced at short-term uptrend support (6873/78s). A break below could trigger a slide into the mid-6700s.
-
Upside potential on hold: watch for retests of 7000+, 7080/85s, and 7264/69s.
-
Downside support to monitor: 6873/78s, then 6755/50s.
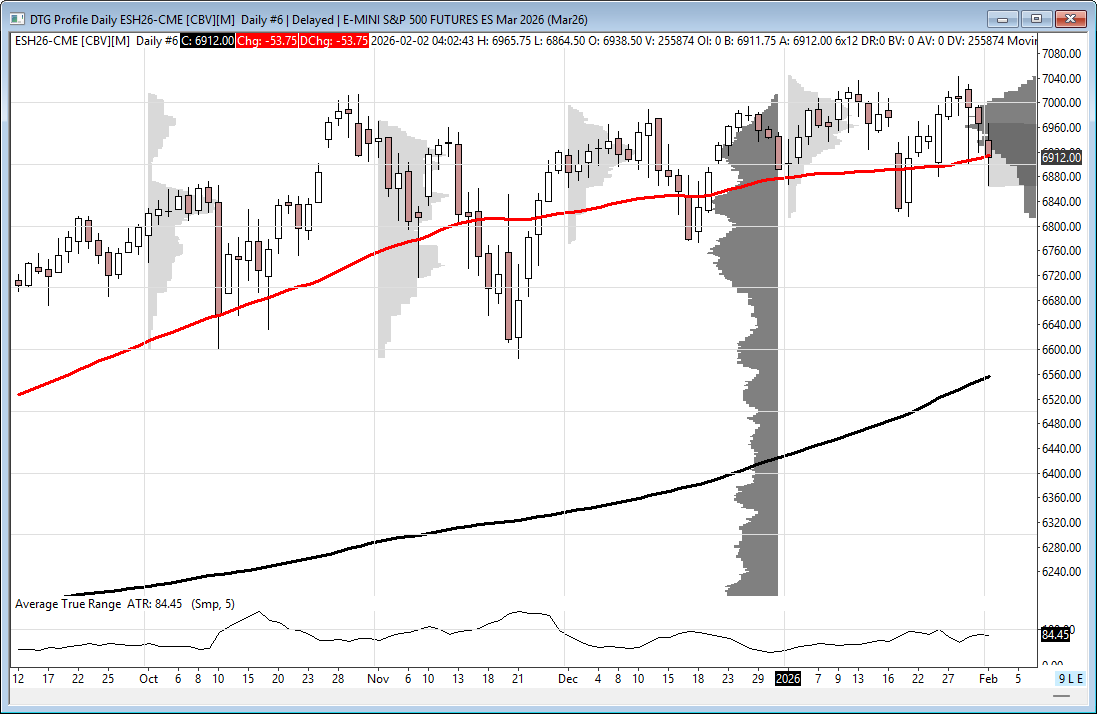
Volatility Rising
The ES 5-day average range has increased to 87.5 points — signaling elevated volatility.
Large overnight volumes suggest whale bias is short into the U.S. session open.
Affiliate Disclosure: This newsletter may contain affiliate links, which means we may earn a commission if you click through and make a purchase. This comes at no additional cost to you and helps us continue providing valuable content. We only recommend products or services we genuinely believe in. Thank you for your support!
Disclaimer: Charts and analysis are for discussion and education purposes only. I am not a financial advisor, do not give financial advice and am not recommending the buying or selling of any security.
Remember: Not all setups will trigger. Not all setups will be profitable. Not all setups should be taken. These are simply the setups that I have put together for years on my own and what I watch as part of my own “game plan” coming into each day. Good luck!
This post goes out as an email to our subscribers every day and is posted for free here around 2 PM ET. To get your real-time copy, sign up for the free or premium version here: Opening Print Subscribe.
Comments are closed