This post goes out as an email to our subscribers every day and is posted for free here around 2 PM ET. To get your real-time copy, sign up for the free or premium version here: Opening Print Subscribe.
205 Handles Off the Lows and Still Heavy — Feels Like a Rally on Borrowed Time
Follow @MrTopStep on Twitter and please share if you find our work valuable!
Our View
I guess this is the new normal, but Friday’s big rally didn’t stop bond yields from moving higher. The 2-year Treasury yield rose more than 1 basis point to around 3.495%–3.50%, the 10-year yield generally ticked higher by roughly 3–4 basis points to close around 4.206%–4.22%, while the 30-year yield saw minimal change or a slight uptick to around 4.85%.
Despite the big rallies, the ES dropped in three out of the last four weeks, and the NQ logged its fourth straight losing week, falling nearly 3%. Is all forgiven? I’m not quite sure about that. Can the ES and NQ keep going up? I do think they can, but this week has a lot of economic reports, and there is still ongoing friction between Iran and Trump’s armada.
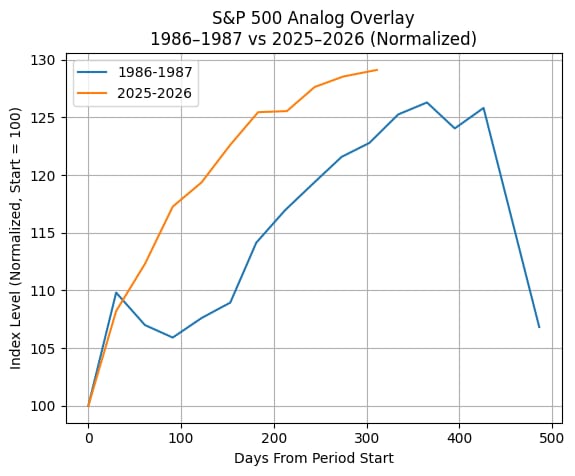
Dax Trader, who is a prolific chartist, told me to run an S&P comparison chart from September 1, 1986, to the end of December 1987, and from April 7, 2025, to February 6, 2026. I have seen him make incredible calls in the past, and he calls this his retirement trade.
I took his idea and ran it on ChatGPT—below is what I came up with. I think this could be done better in a weekly chart. If the ES and NQ are at their all-time highs on March 16, 2026, you buy some puts or sell a call spread. He thinks if it works, we could go back to the April 7, 2025 lows.
Our Lean
The YM didn’t fall as much over the last month and roared through 50,000 on Friday. I think if there was any rotation, it was buy YM (up 2.46%) and Russell (up 3.52%), with the ES (up 1.94%) and NQ (up 2.08%). All four markets moved sharply higher, but as I showed you above, the ES is basically back to where it closed on 12/29 and is still facing a lot of resistance above 7000.00.
Our lean: I’m not sure this will apply, but I think this goes back to how the ES tends to go sideways to lower after a big rally. I do think the ES is going to new highs, but it rallied 205 points from Thursday’s Globex low and closed up 106.50 points on Friday. That is a lot of wood to chop.
I also think it’s important to keep an eye on the rotations. At the end of the day, I am a cautious bull.
And lastly, while it is a ways off, there is going to be a lot of thrashing as the November 3 midterm elections near.
Here are today’s #Claude ES levels:
RESISTANCE LEVELS (highest to lowest, nearest at bottom):
-
7,065.81 – BB Upper Band – extreme resistance
-
7,039.27 – VWAP +2SD – strong resistance
-
7,000.00 – VAH – major resistance
-
6,990.48 – VWAP +1SD – immediate resistance
-
6,957.89 – BB Middle – just 5 points away (NEAREST) ← Bottom
KEY SUPPORT LEVELS (nearest first):
-
6,950.00 – POC (Market Profile) – Point of Control, strongest support (only 3 points below!)
-
6,941.69 – VWAP – critical support
-
6,892.90 – VWAP -1SD – strong support zone
-
6,860.00 – VAL (Market Profile) – Value Area Low
-
6,849.97 – BB Lower Band – extreme support
CURRENT MARKET CONTEXT:
-
Bullish bias – Price is above VWAP (6,941.69)
-
Fair value zone – Price trading within Value Area (6,860–7,000)
-
Neutral momentum – Price in middle of Bollinger Bands
-
Sitting on POC – Price hovering right at the highest volume node (6,950), which acts as a magnet
TRADING IMPLICATIONS:
-
Immediate support at 6,950 (POC) and 6,942 (VWAP) – watch these closely
-
First resistance at 6,990 and 7,000 – breaking above could trigger momentum
-
Price is in the equilibrium zone – could swing either direction
-
The tight proximity to POC suggests a potential breakout setup
One of the things I’ve said quite often is that President Trump has a lot to say about everything, but he never says anything about the $38.6 trillion deficit: US Debt Clock
Right now the US pays $90.1 billion a month—or roughly $3 billion a day on interes. Interest payments have become the second-largest expense in the federal budget, trailing only Social Security. As of early 2026, interest costs have surpassed spending on both National Defense ($267 billion) and Medicare ($254 billion) for the same quarterly period.
For real-time updates and detailed historical data, you can visit the U.S. Treasury Fiscal Data portal or track specific debt components via the Committee for a Responsible Federal Budget.
Elon Musk warns the U.S. is ‘1,000% going to go bankrupt’ unless AI and robotics save the economy from crushing debt

Tesla CEO Elon Musk doubled down on his warnings about U.S. debt, predicting financial doom will be guaranteed without the transformative effects of AI and robotics on the economy.
Tesla CEO Elon Musk doubled down on his warnings about U.S. debt, predicting financial doom will be guaranteed without the transformative effects of AI and robotics on the economy.
In a lengthy, wide-ranging interview with podcaster Dwarkesh Patel alongside Stripe co-founder and president John Collison on Thursday, the tech billionaire was asked why he pushed for aggressive spending cuts while leading the Department of Government Efficiency if technology will supercharge GDP growth and ease the debt burden.
Here is the link to the interview : https://www.youtube.com/watch?v=BYXbuik3dgA
Market Recap
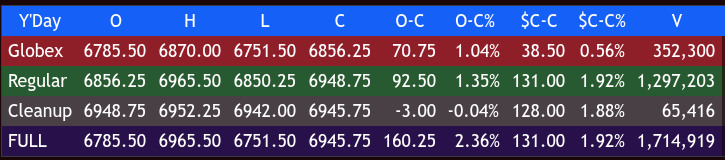
The ES traded down to 6751.50 on Globex with Bitcoin leading the way and opened FRYday’s regular session at 6856.25, down 35.50 points or -0.56%.
As you know, I don’t mind writing, but there is no way I can do all the swings. After the open, the ES traded 6850.00 and went straight up. By 9:50 it traded 6907.25, pulled back to the 6872.25 level at 10:15, rallied up to 6912.75 at 12:45, pulled back to the 6885.25 level at 10:55, traded up to 6937.75 at 12:50, pulled back to 6928.00, traded up to 6938.75 at 1:50, pulled back to 6929.50 at 2:15, rallied up to 6953.75, and traded 6952.50 as the 3:50 cash imbalance showed $3.4 billion to buy.
It bee-lined up to 6965.60, dropped down to 6947.50 at 3:55, and traded 6948.75 on the 4:00 cash close. After the 4:00 cash close, the ES traded down to 6942.75 and settled at 6952.75, up 132 points or +1.94%, up 205 points from its 6751.50 Globex low and up 106.50 points from its day session low.
The NQ settled at 25,163.25, up 512.25, up 2.08%. The YM settled at 50,205, up 1207 points or +2.46%; from its Globex low to day session high it rallied 1503 points. The RTY settled at 2677.90, up 91.10 points or +3.52%, and up 117.30 points from its 2566.60 Globex low. Bitcoin rose 10%, retaking much of Thursday’s losses to trade near $70,000.
While you may not have seen this, I went into our free MrTopStep Pit Room chat after 10:30 and posted this:
PIT:Dboy:[10:58:14 AM]: there is a big tendency for the ES and NQ after a sell off to reverse during the FRYday expos
PIT:Dboy:[10:58:22 AM]: it’s always been that way
PIT:Dboy:[10:59:06 AM]: people get too short futures, they roll option positions lower and then they do a gamma squeeze
PIT:Dboy:[10:59:56 AM]: I’m not saying the ES and NQ can’t fall again but this type of option rolling happens when the firms put out margin calls
PIT:Dboy:[11:00:31 AM]: then… if they go back up then they roll up the option positions
In the end, it was like a battlefield—charging down and then charging up.
In terms of the ES’s and NQ’s overall tone, the rally was decided after Thursday’s close and during the plunge on Globex. In terms of the ES’s overall trade, 1.78 million contracts traded—the lowest volume in the last 7 sessions.
As you all know, when the ES and NQ move up or down sharply, I like to point out how many points and the percentage moves and how many days up or down. Sure, there were some extreme moves, but at the end of the day, the ES and NQ have remained within their respective trading ranges.
On 1/23/26, the ES settled at 6945.75. On 1/30/26, the ES settled at 6965.75. And on 02/03/26, it settled at 6961.50. I don’t want to make this sound easy—because it’s not—but there was a clear signal after Friday’s gap-up open. They gapped higher and went straight up. To me, that meant the crowd was short.
Earnings have been a clear tailwind for stocks this quarter, although market reactions have been mixed. On the upside, Nvidia gained 7.9%, Caterpillar added 7.1%, and 3M rose 4.6%. On the downside, Amazon.com fell more than 5% after announcing plans to spend roughly $200 billion this year on data centers and AI infrastructure, renewing concerns over rising capex.
The Magnificent Seven mega-cap tech stocks, which shed nearly $3 trillion in market value over the prior week amid worries about AI spending and delayed returns, rebounded sharply on Friday, surging almost $1 trillion as some recovery took hold.
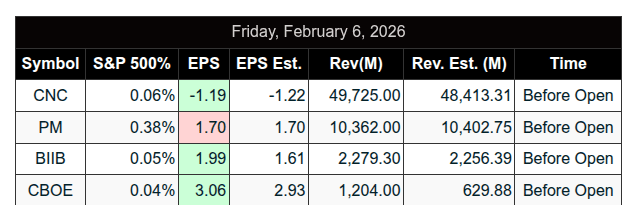
Q4 2025 earnings season for the S&P 500 is well underway. As of February 6, 2026, about 59% of the index—more than 150 companies—have reported results. Of those companies, 76% beat EPS expectations, in line with the 10-year average, pushing blended year-over-year EPS growth to 13.0%, up significantly from the pre-season estimate of 8.3%. This marks the fifth consecutive quarter of double-digit earnings growth and the tenth straight quarter of positive year-over-year growth.
On the revenue side, results have also been strong. 73% of reporting companies beat revenue estimates, driving blended revenue growth to 8.8% year over year. Profit margins remain elevated, with some analyses placing net margins near 13.2%, reflecting resilient corporate fundamentals.
Excluding the Magnificent Seven, earnings growth is more moderate—around +4.6%, according to Bloomberg Intelligence—but participation has broadened across sectors such as Information Technology, Industrials, and Communication Services. Forward estimates remain constructive, with projections calling for roughly ~14.1% EPS growth in calendar year 2026.
For the detailed FactSet data (including the February 6, 2026 update by John Butters), check:
https://www.factset.com/earningsinsight
https://insight.factset.com/sp-500-earnings-season-update-february-6-2026
On Tap
Monday, Feb 9
-
Raphael Bostic speaks at 10:50 am
-
Fed Governor Christopher Waller at 1:30 pm
-
Fed Governor Stephen Miran at 2:30 pm
-
Podcast with Stephen Miran at 5:00 pm
-
ON Semiconductor (ON): Expected to report after the market closes
Tuesday, Feb 10
-
Coca-Cola (KO): Expected to report before the bell
-
NFIB Optimism Index at 6:00 am
-
Employment Cost Index, Import Price Index, and U.S. Retail Sales at 8:30 am
-
Business Inventories at 10:00 am
-
Cleveland Fed President Beth Hammack at 12:00 pm
-
Dallas Fed President Lorie Logan at 1:00 pm
Wednesday, Feb 11
-
McDonald’s (MCD) reports before the bell
-
Delayed January U.S. employment report, unemployment rate, and hourly wages at 8:30 am
-
Kansas City Fed President Jeff Schmid at 10:10 am
-
Monthly U.S. federal budget at 2:00 pm
Thursday, Feb 12
-
Initial Jobless Claims at 8:30 am
-
Existing Home Sales at 10:00 am
-
Cisco Systems (CSCO) reports after the bell
-
Fed Governor Stephen Miran speaks again at 7:05 pm
Friday, Feb 13
-
Consumer Price Index (CPI) and Core CPI at 8:30 am

MiM
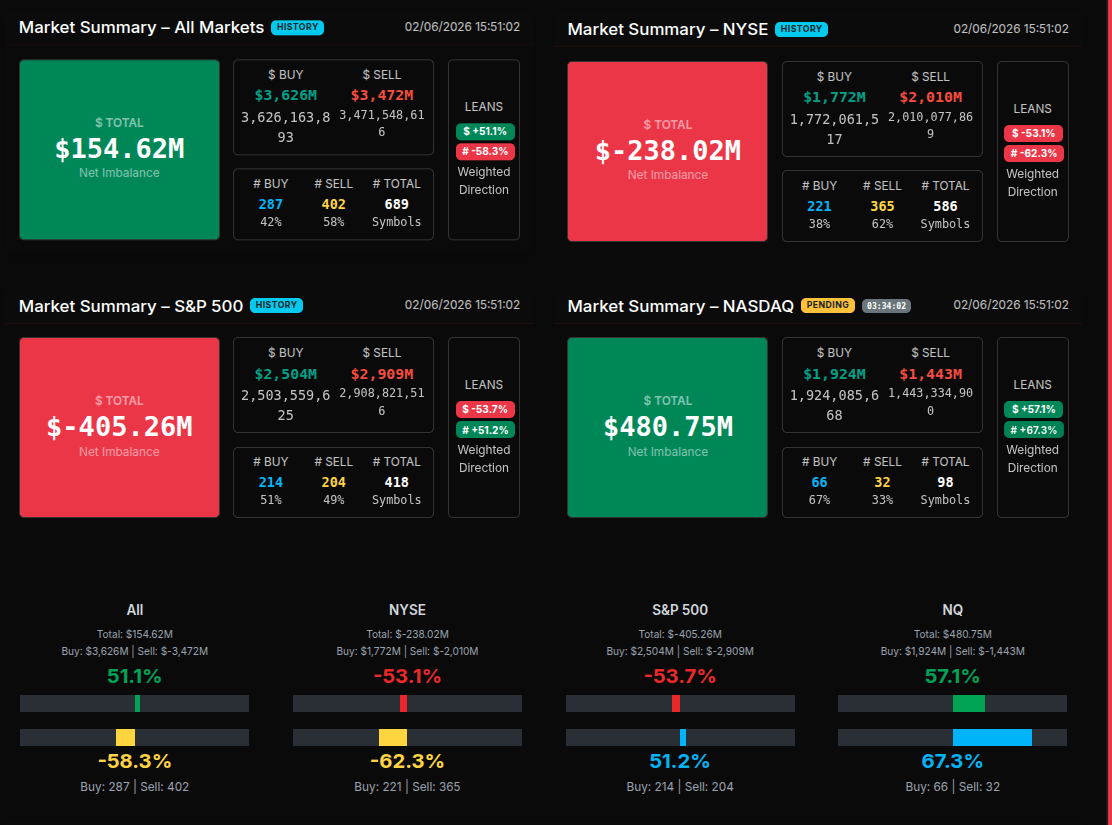
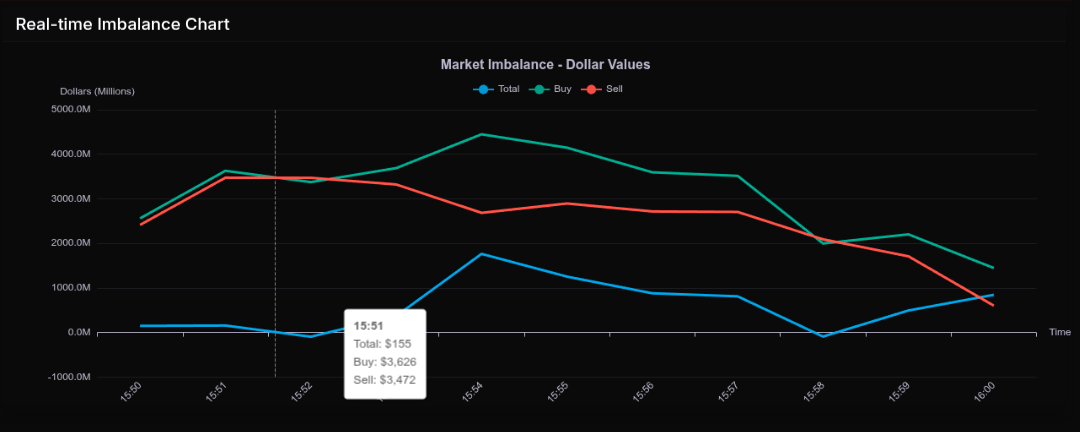
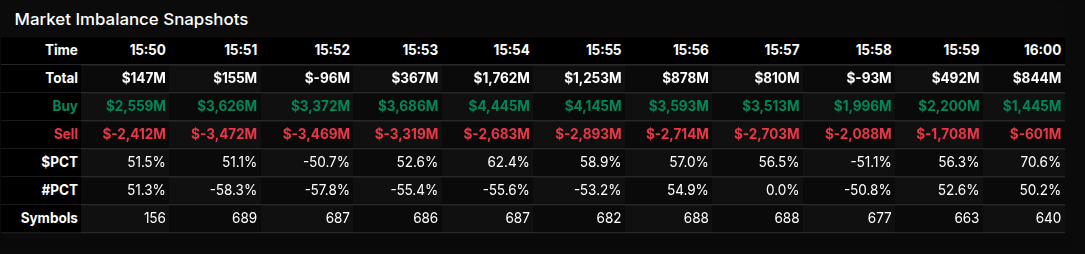
The Market-on-Close auction opened with a modestly constructive tone but quickly evolved into a highly rotational tape, finishing with a mixed but telling set of imbalances. Early snapshots around 15:50–15:52 showed relatively balanced flow, with dollar imbalances oscillating near flat as buy and sell programs competed. That balance broke decisively after 15:53, when total dollar imbalance surged above $1.7B, signaling institutional participation stepping in ahead of the bell.
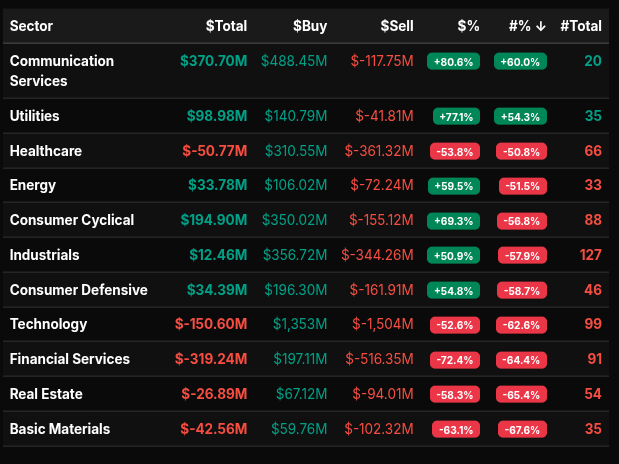
Sector activity revealed clear separation between accumulation and distribution. Communication Services and Utilities stood out as notable wholesale buyers, posting +80.6% and +77.1% lean, respectively, both well beyond the +66% threshold that typically defines broad, directional buying. Energy also leaned positive at +59.5%, though closer to rotational than outright one-sided flow. On the opposite end, Financial Services (-72.4%), Technology (-52.6%), Basic Materials (-63.1%), and Real Estate (-58.3%) absorbed sustained sell pressure, with Financials and Materials showing particularly decisive institutional selling.
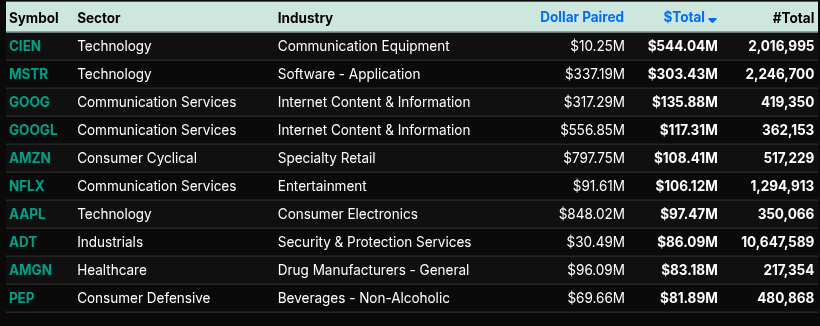
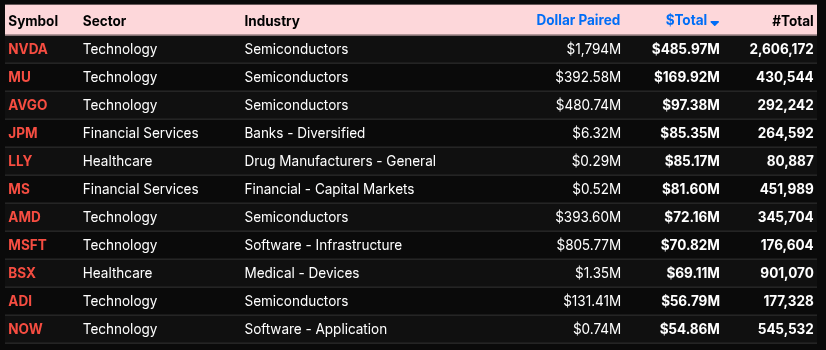
Within single-name flow, semiconductors dominated gross dollars but were mixed in intent. NVDA led total dollar paired activity, while MU, AVGO, AMD, and ADI reinforced the theme that size traded heavily, but direction skewed defensive rather than additive. Software and mega-cap tech showed distribution characteristics, aligning with the broader Technology sector’s negative lean. In contrast, select Healthcare and Consumer Defensive names attracted steadier, lower-volatility buying.
By index, the NASDAQ closed with a strong +57.1% lean and +67.3% weighted direction, marking it as the clear accumulation venue. The S&P 500 and NYSE both finished with sell-side dominance near -53%, reinforcing the idea that the close was not a simple risk-on event but a targeted rotation. Overall, this MOC reflected capital shifting toward defensives and selective growth exposure, rather than broad market conviction into the close.
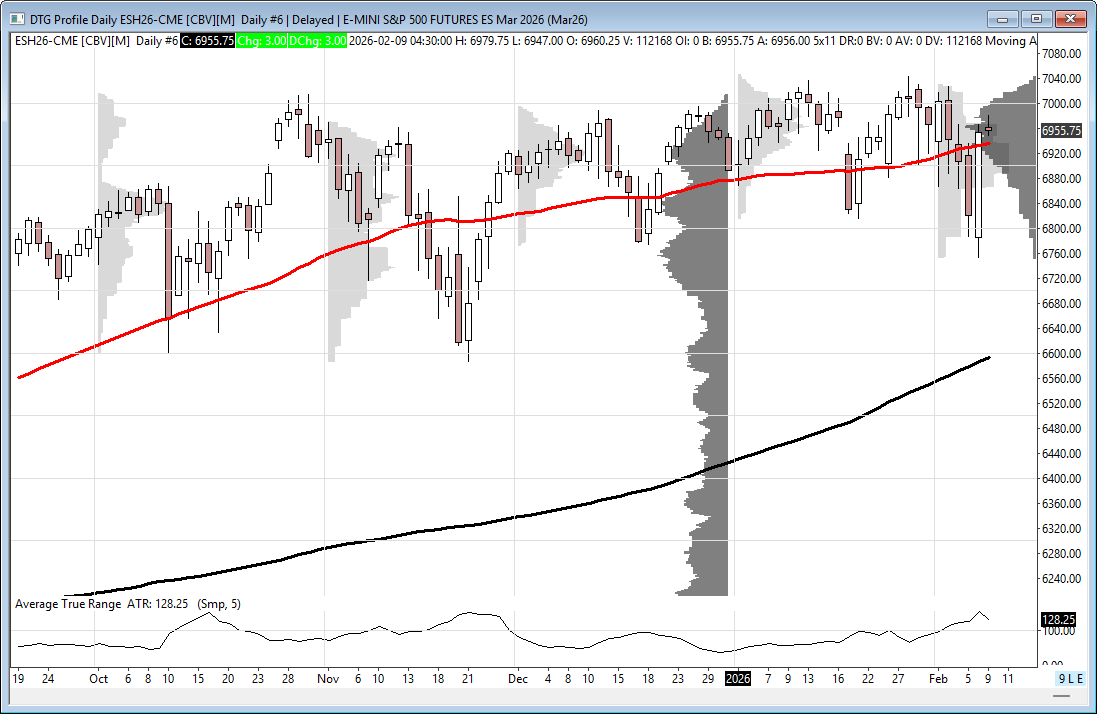
Technical Edge
Fair Values for February 9, 2026
-
SP: 19.67
-
NQ: 86.14
-
Dow: 72.46
Daily Breadth Data 📊
For Friday, February 6, 2026
• NYSE Breadth: 29.75% Upside Volume
• Nasdaq Breadth: 23.12% Upside Volume
• Total Breadth: 23.97% Upside Volume
• NYSE Advance/Decline: 33.84% Advance
• Nasdaq Advance/Decline: 23.56% Advance
• Total Advance/Decline: 27.29% Advance
• NYSE New Highs/New Lows: 163 / 106
• Nasdaq New Highs/New Lows: 158 / 569
• NYSE TRIN: 1.30
• Nasdaq TRIN: 1.02
Weekly Breadth Data 📈
For Week Ending February 6, 2026
• NYSE Breadth: 46.78% Upside Volume
• Nasdaq Breadth: 46.17% Upside Volume
• Total Breadth: 46.41% Upside Volume
• NYSE Advance/Decline: 46.60% Advance
• Nasdaq Advance/Decline: 35.42% Advance
• Total Advance/Decline: 39.42% Advance
• NYSE New Highs/New Lows: 452 / 119
• Nasdaq New Highs/New Lows: 667 / 458
• NYSE TRIN: 0.99
• Nasdaq TRIN: 0.64
Today’s BTS Levels:
ES H
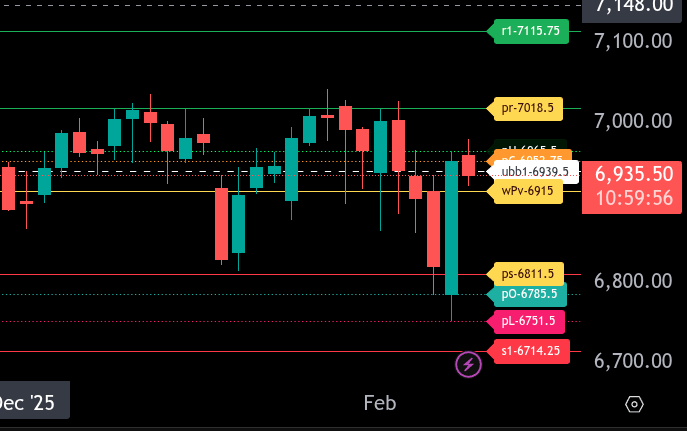
The bull/bear line for the ES is at 6915.00. This remains the key pivot for today. Trading below this level keeps the tone defensive and favors selling strength rather than chasing bounces.
ES is currently trading around 6936.25, attempting to stabilize just above the overnight lows but still below key resistance. Failure to hold above 6939.50 keeps pressure on the downside, with 6811.50 as the lower range target. A sustained break below that level opens the door to 6785.50 and then 6751.50.
On the upside, initial resistance is at 6952.75, followed by 6965.50. A reclaim and hold above 7018.50 would shift momentum higher and put 7115.75 in play. Overall, the ES remains bearish below 6915.00. Bulls need acceptance back above that level to argue for a more meaningful recovery, otherwise rallies are vulnerable to renewed selling.
NQ H
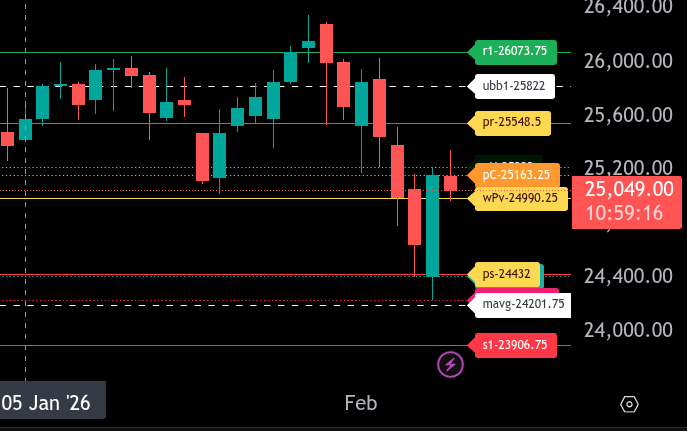
The bull/bear line for the NQ is at 24,990.25. This level defines today’s directional bias and remains the key pivot for sentiment.
NQ is currently trading near 25,047.00, slightly above the bull/bear line after a sharp selloff and rebound. Holding above 24,990.25 keeps the door open for stabilization and rotation higher, but the structure remains fragile given the recent downside momentum.
On the downside, initial support sits at 24,432.00, followed by 24,239.75. A failure to hold these levels would likely open the door toward 23,906.75. Acceptance below 24,239.75 would signal renewed bearish pressure.
On the upside, resistance comes in at 25,163.25 and then 25,222.00. Above there, look for a test of 25,548.50, which marks the upper range target. Bulls need sustained trade back above 25,222.00 to regain control and shift momentum.
Overall, the NQ remains in a defensive posture despite the bounce. Bias stays mixed-to-bearish below 25,548.50, with traders respecting 24,990.25 as the line that separates stabilization from another leg lower.
Calendars
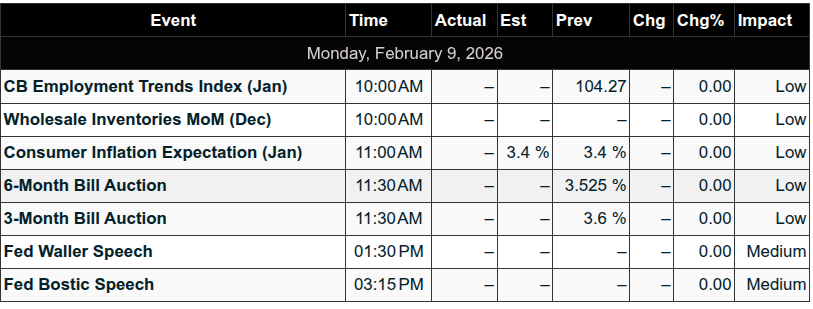
Today’s Economic Calendar
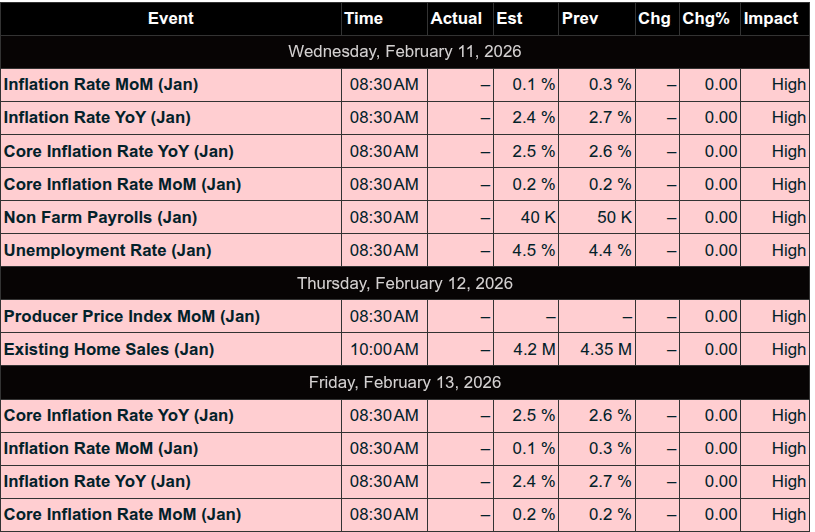
This Week’s Important Economic Events
Upcoming Earnings – SP500
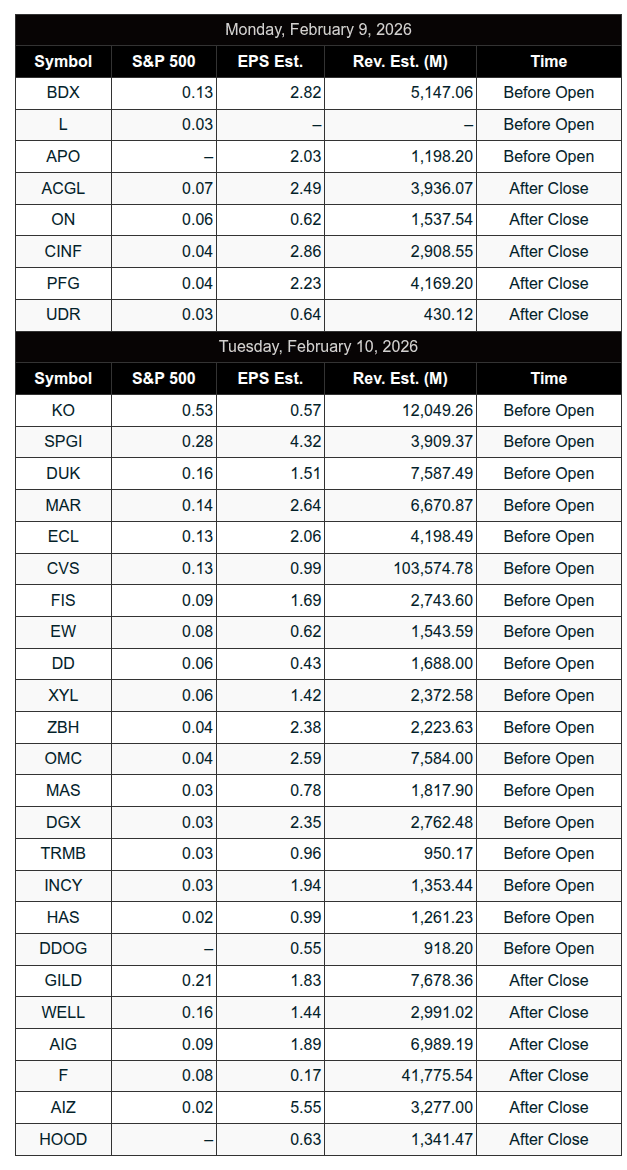
Recent Earnings
Room Summaries:
Polaris Trading Group Summary – Friday, February 6, 2026
“FRYday” lived up to its hype as the PTG trading room, led by David Dube, navigated a textbook Cycle Day 3 Squeeze Play—turning what began as a tough uphill battle into a high-velocity bullish breakout session.
Pre-Market Prep
-
David laid out a detailed DTS Briefing outlining the high-probability bullish setup based on Cycle Day 3 stats (92% odds of reclaiming CD1 Low at 6862.50).
-
Market opened deep below CD1 Low after a recent long-liquidation event, creating ideal conditions for a squeeze rally.
-
The plan emphasized:
-
Bull case above 6785 ± 5, with squeeze acceleration above 6830.
-
Bear case if prices held below 6785.
-
Execution Highlights
-
Early squeeze play executed to perfection, pushing into key resistance at the 6875–6905 “Sandbox Zone”, which was later confirmed with volume.
-
Cycle Day 1 Low (6862.50) was reclaimed decisively, fulfilling the 3-Day Cycle statistic.
-
Long targets were hit across instruments:
-
@CL: All Open Range targets achieved.
-
@NQ: Long OPR targets fulfilled.
-
@ES: Cycle Day 3 target of 6959 officially reached.
-
-
💬 David: “Positive 3 Day Cycle Statistic 92.22% Fulfilled” and “What an amazing 3 Day POWER CYCLE…”
Trade of the Day: The Squeeze Play
David framed the day’s opportunity early:
“Now the objective shifts: advance cheaper inventory higher, apply pressure to complacent shorts, and potentially trigger a classic squeeze-play.”
This forecast played out exactly as expected, with traders reporting strong execution:
-
PeterN and Bruce F confirmed A4 setups working on SIM and RTY, supported by chart posts.
-
ram and others celebrated hitting TTT and $$Box targets overnight.
Lessons & Takeaways
-
Respect the Power of the Cycle: Once again, the 3-Day Cycle pattern delivered when confirmed by structure and participation.
-
Be Ready Early: The squeeze unfolded quickly. Late entries were left behind—David noted, “If you were looking for a pullback to get on board… you were simply SOL.”
-
Plan, Execute, Exit: Traders who followed the DTS briefing were rewarded. The strategy was not just theoretical—it was actionable and precise.
Closing Notes
-
NASDAQ finished +2%, a strong finish to a powerful session.
-
David closed the day in classic style: “Elvis Has Left the Building.” 🎤
One of the strongest examples of planning meeting execution in the PTG room. The 3-Day Cycle continues to prove its edge for prepared traders.
DTG Room Preview – Monday, February 9, 2026
Market Recap & Key Levels – Monday
-
Stocks Surge: The Dow closed above 50,000 for the first time Friday (+1,200 pts / +2.5%), with the S&P 500 and Nasdaq up 2%. A tech-led rebound drove gains after heavy selling earlier in the week amid AI-related spending concerns. Big Tech’s combined AI capex now stands at $650B.
-
Treasuries Dip: US bond prices fell after China urged banks to reduce US Treasury exposure, citing volatility. 10-year yield up 4 bps to 4.25%, 30-year at 4.87%.
-
Japan Pops: The Nikkei 225 surged 5% after Minister Takaichi’s party won a two-thirds supermajority, boosting hopes for economic reforms. The rally carried into European markets.
-
Oil Drops: Crude fell over 1% after positive US–Iran nuclear talks reduced supply fears. About 20% of global oil flows through the nearby Strait of Hormuz.
-
Earnings Watch:
-
Premarket: APO, BDX, CLF, KD
-
After Close: ACM, AMKR, ACGL, CINF, CRBG, ON
-
Tuesday AM: ARMK, AZN, BP, KO, CVS, DDOG, MAR, SPOT, more
-
-
Data Ahead:
-
Jobs Report (Wednesday) and CPI (Friday) were both delayed from last week
-
Fed Speakers: Waller (1:30pm ET), Bostic (3:15pm ET)
-
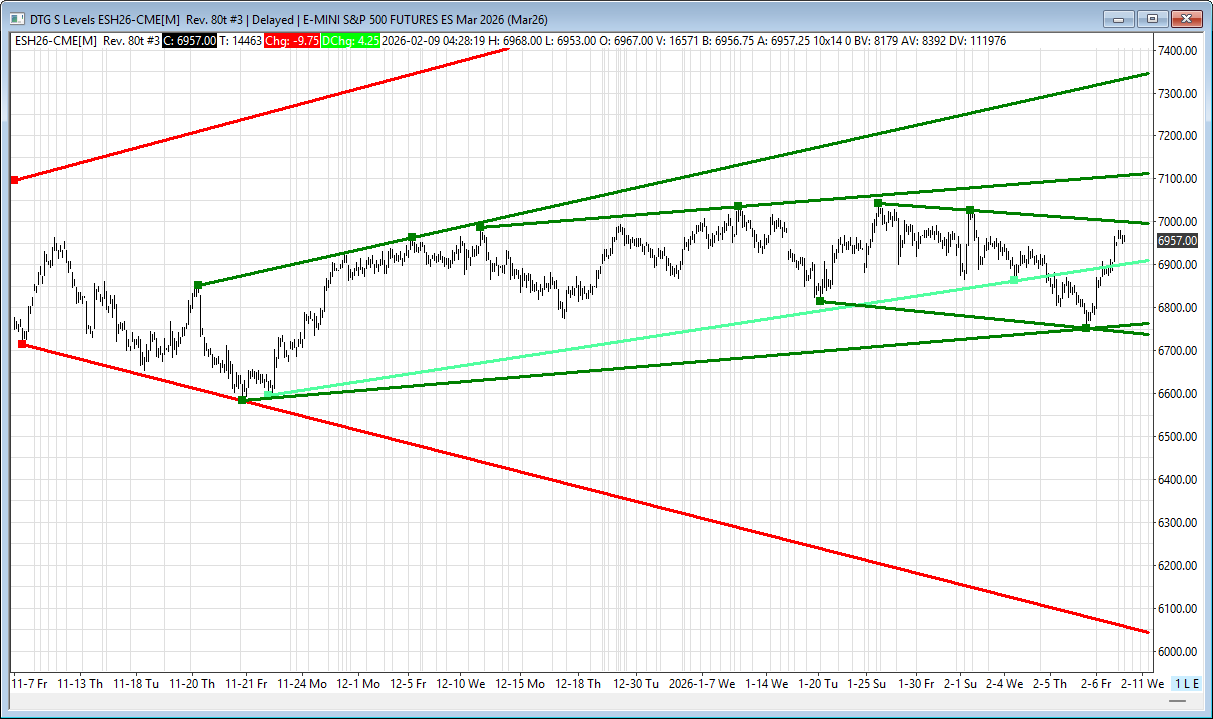
Futures Focus – ES
-
Volatility: ES has moved 100+ pts in 6 of the last 7 sessions; 5-day ADR is now 152.75 pts.
-
Trend Structure:
-
Short-term downtrend within a broader intermediate-term uptrend
-
Still in a 3+ month sideways consolidation near ATHs
-
Friday’s low now a confirmed swing low
-
-
Key Levels:
-
Support: 6761/66, 6735/40
-
Resistance: 7000/03, 7110/05, 7348/53
-
50-day MA: Closed above at 6935.25, now soft support
-
-
Whale Bias: Bearish into US open on light overnight large trader volume
Affiliate Disclosure: This newsletter may contain affiliate links, which means we may earn a commission if you click through and make a purchase. This comes at no additional cost to you and helps us continue providing valuable content. We only recommend products or services we genuinely believe in. Thank you for your support!
Disclaimer: Charts and analysis are for discussion and education purposes only. I am not a financial advisor, do not give financial advice and am not recommending the buying or selling of any security.
Remember: Not all setups will trigger. Not all setups will be profitable. Not all setups should be taken. These are simply the setups that I have put together for years on my own and what I watch as part of my own “game plan” coming into each day. Good luck!
This post goes out as an email to our subscribers every day and is posted for free here around 2 PM ET. To get your real-time copy, sign up for the free or premium version here: Opening Print Subscribe.
Comments are closed