This post goes out as an email to our subscribers every day and is posted for free here around 2 PM ET. To get your real-time copy, sign up for the free or premium version here: Opening Print Subscribe.
Panic Index Screamin’, Shorts Piling In, and the Dollar Gettin’ Smacked — Welcome to the Pit
Follow @MrTopStep on Twitter and please share if you find our work valuable!
Our View
While I did use Gemini to format this story, I did my own research—like total Treasury holdings of the top three countries—and added in BRICS and the total DXY drop.
Recent reports suggest that Chinese financial regulators are advising domestic banks to curb new purchases of U.S. Treasuries and reduce existing high-exposure holdings due to concentration risk and market volatility. However, this is not a direct order for mass liquidation and applies specifically to commercial banks, not central reserves.
As of late 2025, China remains the third-largest foreign holder of U.S. debt with $682.6 billion, trailing the United Kingdom’s $888.5 billion and Japan’s leading $1.20 trillion. Together, these three nations hold approximately $2.77 trillion in U.S. Treasury securities, highlighting their significant role in the global financial system and the continued—though evolving—status of U.S. assets as a global safe haven.
In this shifting landscape, the BRICS alliance is also exploring alternatives to the U.S. dollar, such as the “Unit”—a digital settlement system backed by gold and a basket of member currencies like the Chinese renminbi (yuan)—to facilitate cross-border trade among its members.
While some reports suggest that up to 185 countries have shown interest in or have the ability to access BRICS-linked payment systems, the formal “BRICS currency” architecture (The Unit) is specifically operational for the 11 core member nations for international trade settlements as of January 2026.
This movement is driven by a staggering surge in global interest, with 185 countries expressing interest—including 23 nations that have formally submitted membership applications and another 28 expressing informal interest. This clearly signals a major shift toward a multipolar financial system.
I have said this many times: China could use the liquidation of U.S. Treasuries as a financial weapon—and that’s what this looks like to me. While U.S. debt continues spiraling and over 185 countries are taking an interest in BRICS, the shift is clear.
At its high, China’s holdings of U.S. Treasury securities reached an all-time peak of $1.3167 trillion in November 2013. That’s a drop of $682.6 billion, or a decline of 48%, reflecting a decade-long trend of China scaling back its exposure to U.S. sovereign debt.
I’ve said for a long time that China could use this as a financial weapon against the U.S. financial system—at a time of rising U.S. debt—by using the dollar to purchase gold as a hedge, promoting the Chinese yuan, and encouraging other countries to support BRICS.
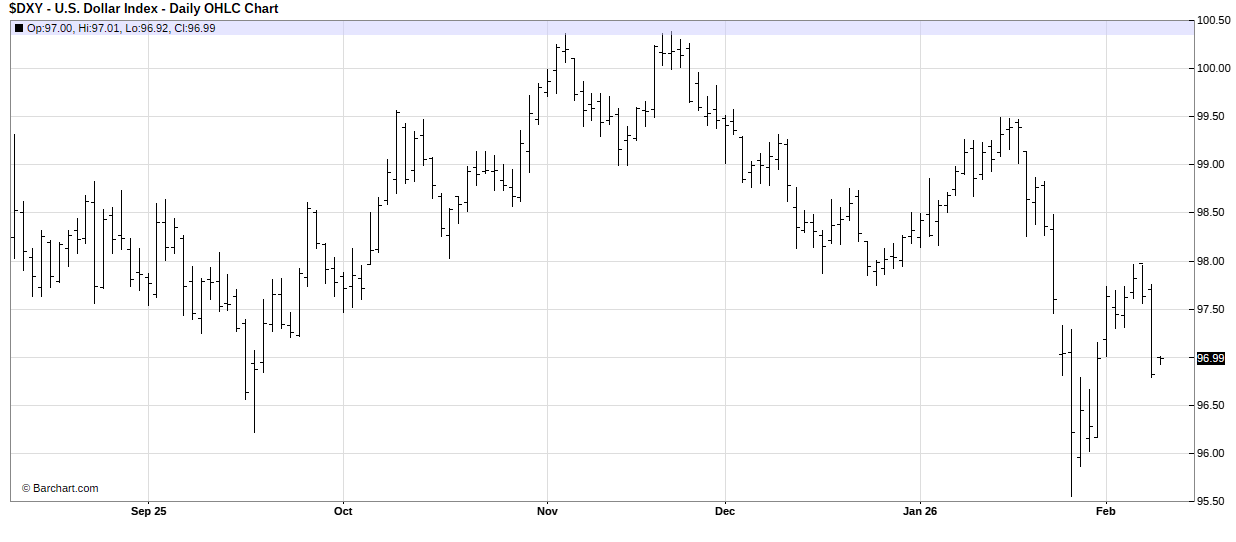
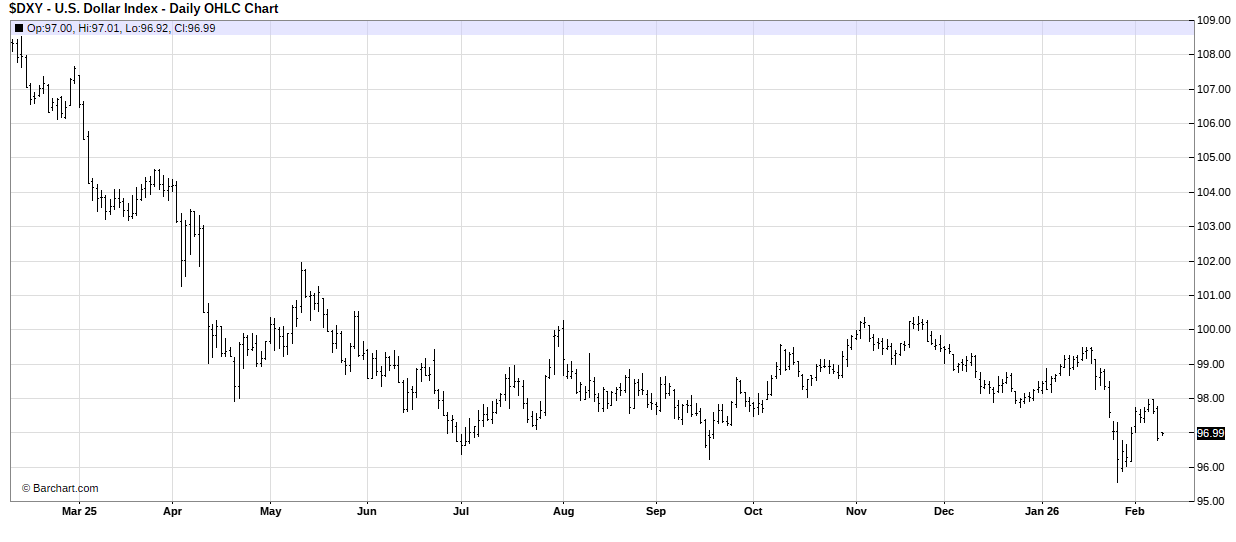
Like I’ve always said: I’m not smart enough to figure all this out, but all you have to do is look at the DXY (Dollar Index). It fell to a one-week low on Monday and finished down -0.83%. That’s down 1.03% in the last five days and down 2.56% YTD, on top of the 10% drop last year.
Goldman Sachs’ Panic Index Trading Desk Note
Goldman Sachs’ trading desk issued a client note warning of potential renewed selling pressure in US equities this week, even after Friday’s rally. They highlight:
• Their proprietary Panic Index (a shorter-term volatility-based fear gauge) has spiked to near “max fear” levels—reported around 9.22 on a 0-10 scale.
• The index aggregates options market signals, including 1-month S&P 500 implied volatility, VIX volatility-of-volatility, put-call skew (demand for downside protection), and the term structure slope (1-month vs. 3-month vol).
• High readings reflect investors paying extreme premiums for hedges, often seen in stressed or capitulation phases.
Potential Selling Pressure
Estimates suggest up to $33 billion in forced selling from systematic funds (commodity trading advisors/CTAs, volatility-targeting funds, risk-parity strategies) this week, regardless of direction in some cases.
Triggers for Larger De-Risking
A drop in the S&P 500 below key levels (one referenced threshold around 6,707) could trigger an additional $80 billion in sales over the coming month.
Contributing Factors
Market liquidity has deteriorated sharply, amplifying swings.
The desk’s blunt advice: “Buckle up.”
Balanced Context
This is a cautious, near-term view from Goldman’s global markets trading team amid recent choppiness (implied selloffs followed by rebounds). Extreme fear readings like this have historically often marked short-term exhaustion points or contrarian buying opportunities—some traders note oversold conditions in software stocks and crypto as potential fuel for a rebound before any larger pullback.
Our Lean
According to Goldman Sachs’ prime brokerage data (tracking back to 2016), hedge funds piled into record notional short selling across single-name U.S. stocks during the week of January 30 to February 5, 2026, the highest level on record. Short sales outpaced long buys by a magnitude of two-to-one.
This drove hedge funds to be net sellers of U.S. equities for the fourth straight week, at one of the heaviest intensities seen since early 2025. It reflects growing bets from the “smart money” on AI-driven disruption wreaking havoc on vulnerable business models, particularly in sectors like software.
I’m going to go back to my directions. I know I’ve avoided them over the last month, but to be honest, while some of them were right, it was hard to anticipate the size of the drops and pops.
Our lean is simple: the ES has rallied almost 250 points from Thursday’s Globex low to yesterday’s high. If you include Globex into the next day as one session, it’s a two-day rally. So it’s not wrong to be a gun-shy bull.
I’ve been saying since last Thursday that I believe during the selloff, the hedge funds were “hedged up,” and that they didn’t get out when the ES and NQ moved up so quickly. Right now, they’re stuck—and as the index market moves higher, they will lift the hedges.
Our lean: With the ES up against good resistance at the 7000.00 level, you can sell the big gap-up or the early rallies and buy weakness, or just be patient and buy the pullbacks.
ES Key Levels Overview
Resistance Levels:
-
R5 – $7,150.00: Round Number / Psychological (Moderate)
-
R4 – $7,100.00: Round Number / Psychological (Moderate)
-
R3 – $7,079.26: Fibonacci 127.2% Extension (Moderate)
-
R2 – $7,061.17: Bollinger Band Upper (Weak)
-
R1 – $7,043.00: Recent High (Strong)
Value Area & Current Price:
-
Value Area High (VAH) – $7,007.31
-
CURRENT PRICE – $6,980.25
-
Point of Control (POC) – $6,962.69
Support Levels:
-
S1 – $6,954.99: Bollinger Band Middle / 20 SMA (Moderate)
-
S2 – $6,946.47: 50-Day SMA / 200-Day SMA (Strong)
-
S3 – $6,931.09: VWAP (Strong)
-
S4 – $6,870.48: Market Profile VAL (Moderate)
-
S5 – $6,848.80: Bollinger Band Lower (Strong)
-
S6 – $6,751.50: Recent Low / Major Support (Extreme)
Guest Posts:
Tom Incorvia – Blue Tree Strategies
From a market technician’s perspective, the S&P 500 has exhibited a prolonged lack of directional conviction. Over the past three months, price behavior has been largely mean-reverting, with repeated rotations around perceived fair value rather than sustained directional movement.
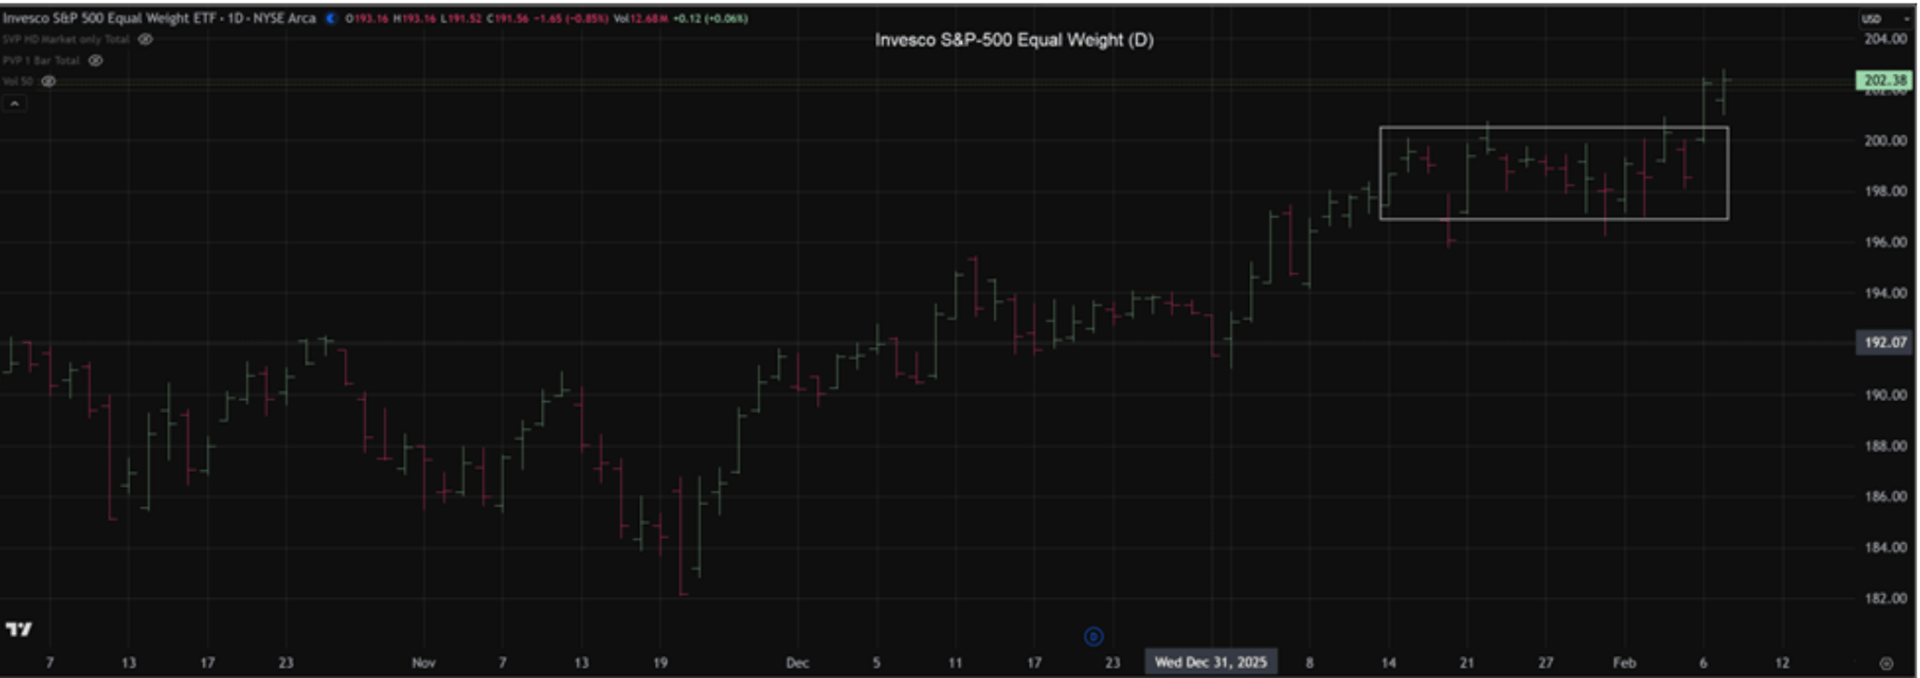
For technicians, improving odds begins with identifying markets that have resolved balance and transitioned into initiative activity. While the cap-weighted S&P 500 (SPY) remains range-bound, Invesco S&P 500 Equal Weight ETF (RSP) has displayed clear relative strength and demand-driven price action.
Unlike SPY, which is heavily influenced by a small group of large-cap constituents, RSP reflects broader market participation through equal weighting. This distinction is evident in the price structure. The chart highlights a well-defined balance area that has recently been resolved to the upside, signaling acceptance at higher prices.
From a technical standpoint, this breakout suggests initiative buying and improving demand conditions. As long as price remains above the former balance area, the higher-probability expectation is for continued upside rotation, with pullbacks viewed as potential responsive buying opportunities rather than signs of distribution.
From a market technician’s perspective, the S&P 500 has exhibited a prolonged lack of directional conviction. Over the past three months, price behavior has been largely mean-reverting, with repeated rotations around perceived fair value rather than sustained directional movement.
For technicians, improving odds begins with identifying markets that have resolved balance and transitioned into initiative activity. While the cap-weighted S&P 500 (SPY) remains range-bound, Invesco S&P 500 Equal Weight ETF (RSP) has displayed clear relative strength and demand-driven price action.
Unlike SPY, which is heavily influenced by a small group of large-cap constituents, RSP reflects broader market participation through equal weighting. This distinction is evident in the price structure. The chart highlights a well-defined balance area that has recently been resolved to the upside, signaling acceptance at higher prices.
From a technical standpoint, this breakout suggests initiative buying and improving demand conditions. As long as price remains above the former balance area, the higher-probability expectation is for continued upside rotation, with pullbacks viewed as potential responsive buying opportunities rather than signs of distribution.
You can purchase Tom’s Course on Volume Profile here.
SPX: Wyckoff Distribution Risk Between 7000 and 6600 : @Manny_trends
SPX has spent enough time near the highs to make both bulls and bears feel a little too sure of themselves. When that happens, I start asking a different question: are we trending, or are we transferring inventory?
I’m framing today with a simple range:
Range High: 7000
Range Low: 6600
7000 is the ceiling until proven otherwise. 6600 is the floor that tells us whether this is still balance, or the start of markdown.
This is not a prediction. It’s a risk framework and a way to stay objective.
Why Wyckoff Distribution Is On My Radar
1) The trend stopped acting like a trend
After a strong run, the market usually changes character before it breaks. We have seen that shift. Upside progress has become labored, and the downside has started to show urgency. That is typical of late-stage action where supply becomes more active.
2) Phase B churn: lots of motion, little progress
If you zoom out, the price action under 7000 has the feel of a distribution range. More swings, more false starts, and less clean follow-through. In Wyckoff terms, Phase B is where opinions get expensive, and patience gets paid.
3) Upthrust behavior near 7000
The classic trap is simple: push above resistance, trigger breakout buyers, then fail back into the range. That upthrust behavior has shown up near the highs. The important part is not the push itself. It’s whether price can accept and hold above 7000. So far, acceptance has been the problem.
The Key Question: Phase C (UTAD) or Phase D?
Here is how I’m separating the two using 7000 and 6600.
If this is still Phase C (UTAD still playing out)
I keep it as Phase C if:
-
We remain inside the 7000 to 6600 range
-
Selloffs fail to gain traction and snap back into balance
-
Price can reclaim and hold in the upper third of the range
Phase C is messy, but not yet directional. The market is still running tests and traps.
What confirms Phase D has started
Phase D starts when weakness becomes repeatable. I look for:
-
A clear Sign of Weakness that drives price toward 6600 with urgency
-
A bounce that stalls below prior supply, creating a Last Point of Supply
-
Follow through lower after that failed bounce
My read right now: late Phase C transitioning into early Phase D.
We have already seen the upthrust type behavior near 7000, and the selloff that followed was not a polite pullback. That makes the current bounce the tell. If rallies keep failing below 7000 and we rotate back toward 6600, Phase D becomes the higher probability. If we regain acceptance near 7000 and hold, the distribution thesis weakens, and this reverts to balance.
Game Plan
Bull path
-
Bulls need acceptance back toward 7000, then a real hold above it
-
Not a wick, not a quick headline spike. Acceptance and follow-through
Bear path
-
Bears want rallies that cannot hold in the upper half of the range
-
A rotation back toward 6600
-
If 6600 breaks and cannot be reclaimed, markdown risk increases materially
What would change my mind
-
Clean acceptance above 7000
-
Higher lows with less rejection on rallies
-
Failed breakdown attempts that trap shorts instead of trapping longs
Until then, I’m treating 7000 as supply and letting 6600 decide whether this is balance or the start of something heavier. In a distribution range, the market pays traders for patience and charges rent for opinions.
You can follow Manny on X or join him in the free PIT trading room on Tuesdays and Wednesdays on the open;
DLC Risk: Monthly Update: Feb 2026 Newsletter
Market Recap
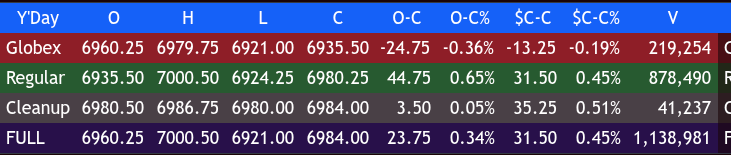
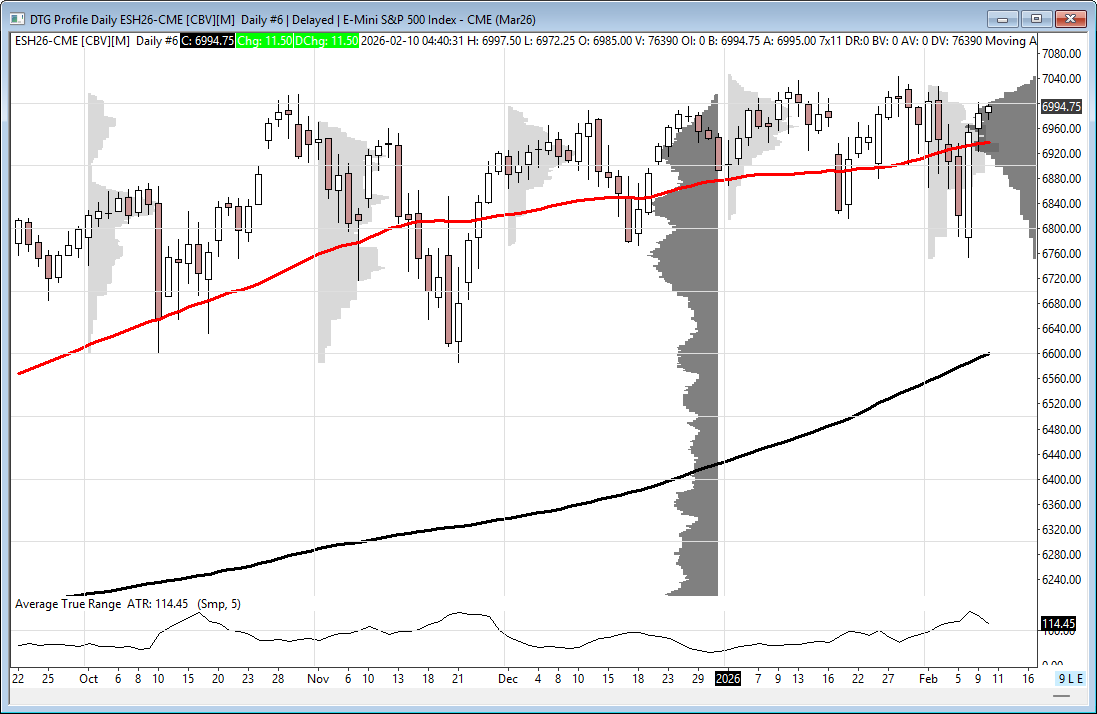
After a smashing rally on Friday, the ES traded up to 6979.75 on Globex and opened Monday’s regular session at 6935.50. After the open, the ES sold off down to 6924.25, then rallied up to 6957.75, pulled back to 6938.50, and rallied again to 6987.75 at 11:00. It did a small back-and-fill down to 6982.00, rallied again to 6982.00 at 12:10, sold off down to 6984.75 at 1:00, rallied to a higher high at 6998.00 at 12:10, pulled back to 6984.75, upticked to a lower high at 6991.75, sold off down to 6977.00 at 1:20, rallied up to 6993.75, dropped down to a 6986.50 double bottom at 2:00, rallied back up to a new high at 7000.50 at 2:25, sold off down to 6980.00 at 3:35, and rallied up to 6990.00 at 3:45.
The ES traded 6989.50 as the 3:50 cash imbalance showed $2.2 billion to sell, then traded 6980.24 on the 4:00 cash close. After 4:00, ES rallied up to 6986.75, flatlined, and settled at 6983.25, up 30.50 points or +0.45%. The NQ settled at 25,354.00, up 190.75 points or +0.76%. The YM settled at 50,219 +0.03%, and the RTY settled at 2714.80, up 18.40 points or +0.68% on the day.
In the end, both the ES and NQ marched higher, but the strength in the RTY (small caps) outpaced the rest of the markets.
In terms of the ES’s overall tone, it was straight up after the open and a “buy the pullbacks” day until late, when the imbalance showed up for sale. In terms of the ES’s overall trade, volume was low at 1.14 million contracts traded.
Tuesday, Feb 10
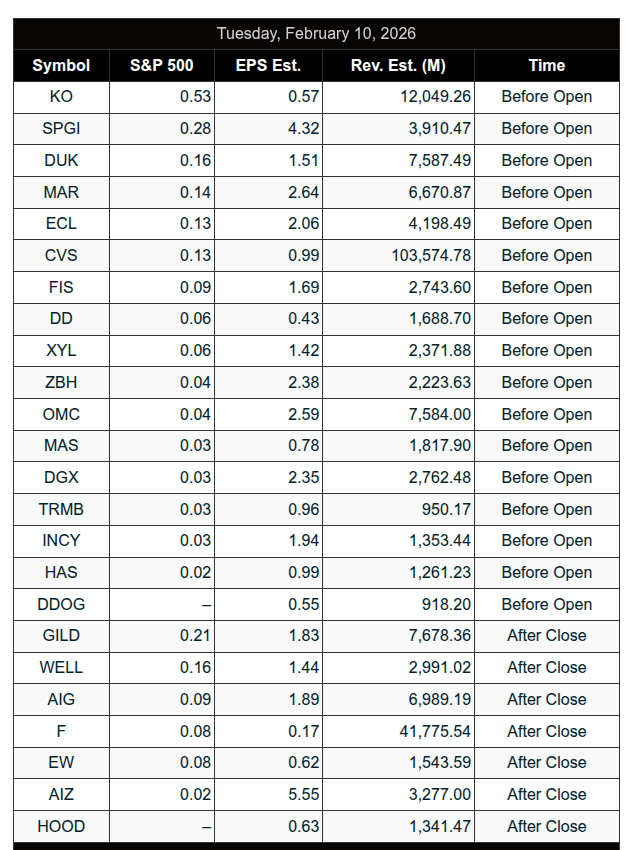
Earnings:
Coca-Cola (KO) – Pre-market
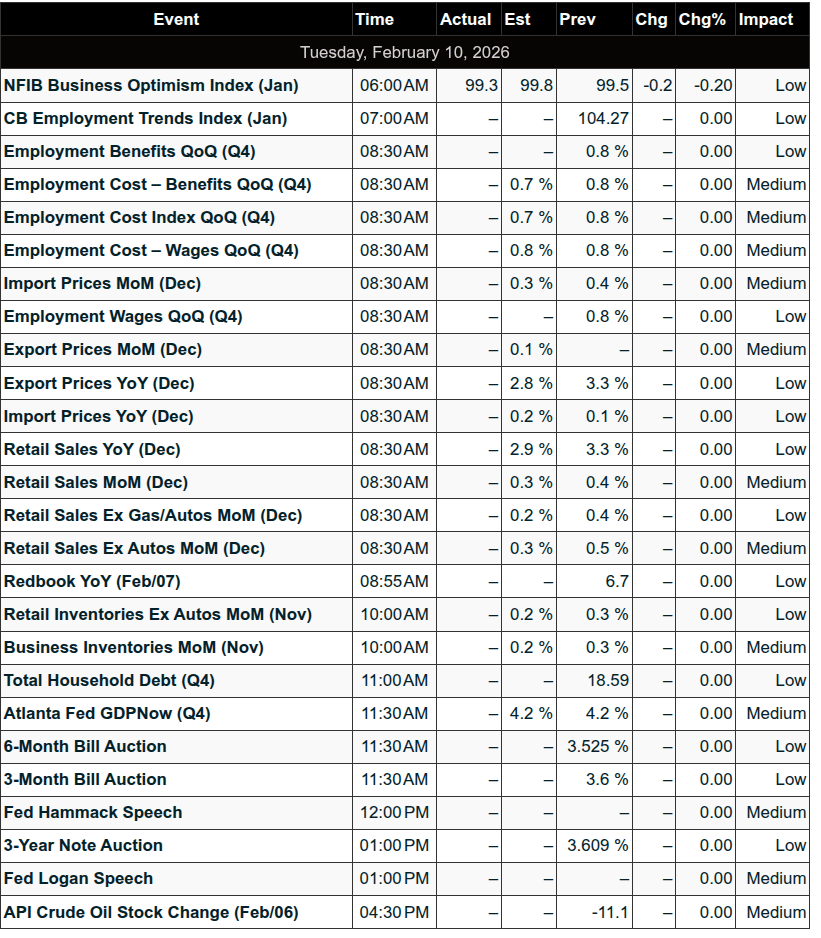
Economic Data:
-
6:00 am: NFIB Optimism Index
-
8:30 am: Retail Sales, Employment Cost Index, Import Prices
-
10:00 am: Business Inventories
-
12:00 pm: Beth Hammack (Cleveland Fed)
-
1:00 pm: Lorie Logan (Dallas Fed)
U.S. bond yields experienced early volatility yesterday—first rising on concerns over Chinese regulators scaling back U.S. debt holdings, before retreating after dovish labor market outlooks from National Economic Council Director Hassett.
After yesterday’s news, I think traders are now pivoting toward a heavy week of data, with expectations for a 0.8% rise in the Q4 Employment Cost Index, steady retail sales growth, and a January nonfarm payroll increase of 69,000 alongside a 4.4% unemployment rate.
While high-stakes inflation data and housing reports loom later in the week, strong corporate performance remains a tailwind, with S&P 500 earnings projected to grow by 8.4% as 79% of reporting companies exceed estimates.
Despite these positive earnings trends, the market currently sees only a 19% chance of a rate cut at the upcoming March policy meeting.
MiM
Market-on-Close Recap – MiM
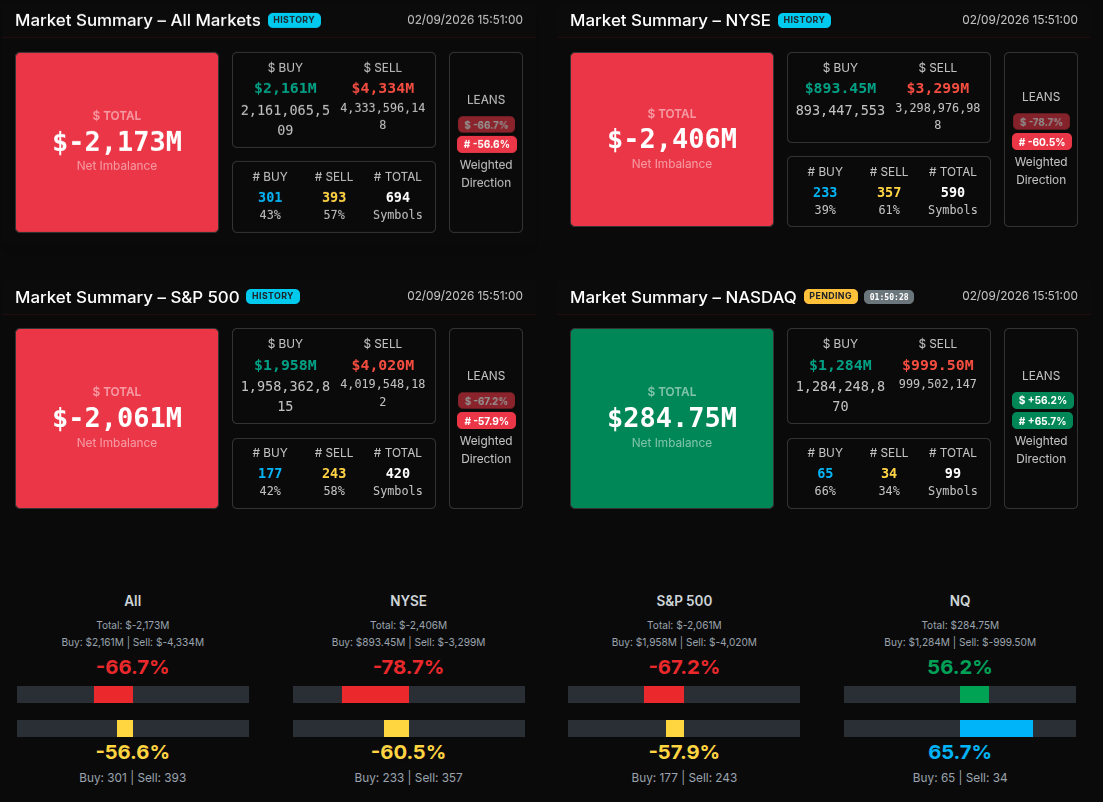
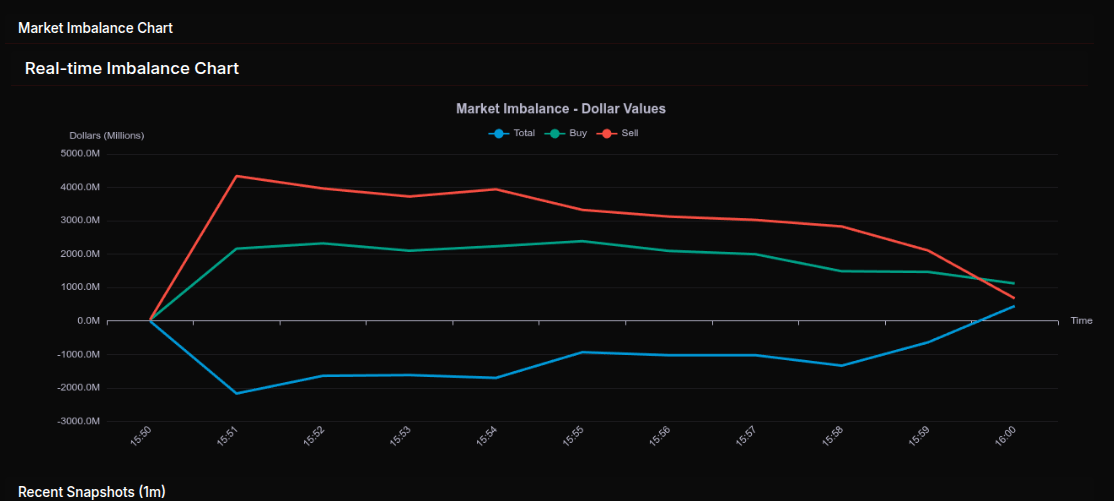
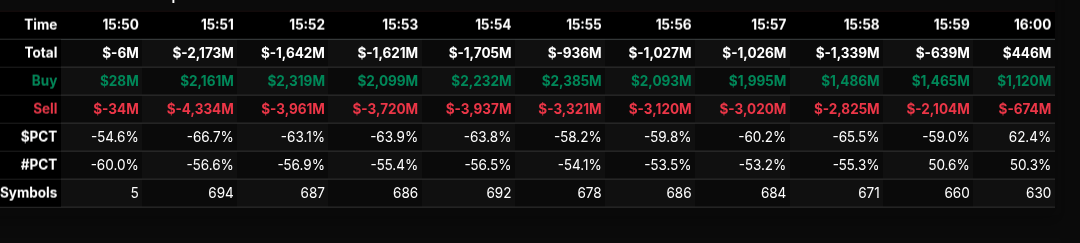
The Market-on-Close auction opened decisively sell-skewed and stayed that way for most of the final ten minutes, signaling persistent institutional distribution rather than late-day noise. Early snapshots around 15:51 showed net imbalances already beyond -$2.1B, with sell pressure consistently outpacing buy programs by a wide margin. This tone carried through nearly the entire auction window before a late Nasdaq-led offset softened the aggregate print into the close.
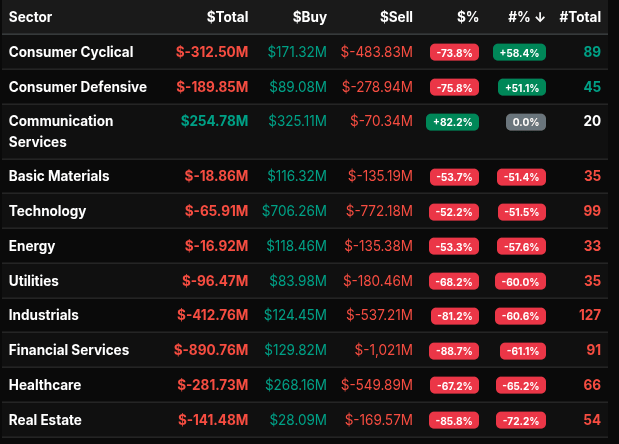
Sector flows made the message clear. Financial Services was the dominant source of supply, posting nearly -$891M with an extreme -88.7% lean, a textbook wholesale sell. Industrials (-$412.8M, -81.2%) and Consumer Cyclical (-$312.5M, -73.8%) reinforced the risk-off posture. Healthcare (-$281.7M, -67.2%) and Real Estate (-$141.5M, -85.8%) added further weight. These are not rotational numbers—leans well beyond -66% point to broad, programmatic selling rather than sector reshuffling.
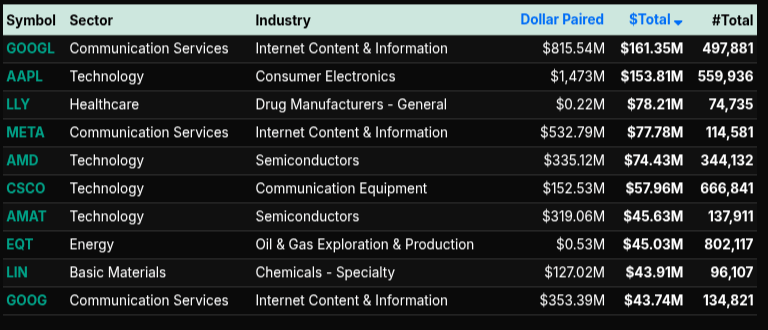
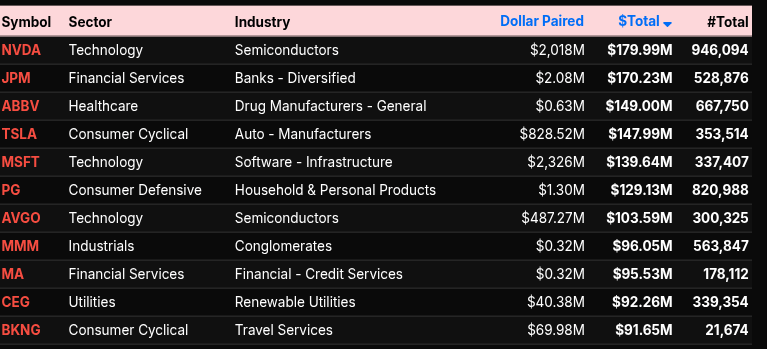
Technology was notable for a different reason. While it closed net negative (-$65.9M), the percent lean near -52% suggests rotation inside the sector rather than outright liquidation. That internal churn showed up at the symbol level: NVDA, MSFT, AVGO, AMD, and AAPL all traded heavy dollar volumes on both sides of the tape. Financials saw similar concentration, with JPM and MA among the largest single-name contributors to sell pressure.
The counterbalance came from Communication Services, the lone sector with a strong buy lean (+82.2%) and a +$254.8M total, driven by large inflows into GOOGL, GOOG, and META. That bid helped stabilize the tape late, alongside a decisive Nasdaq imbalance flip. By 16:00, Nasdaq closed with a +$284.8M net buy and a +56% lean, contrasting sharply with NYSE (-$2.4B, -78.7%) and the S&P 500 (-$2.1B, -67.2%).
Bottom line: this was a sell-dominant MOC defined by financial and industrial liquidation, partially offset by targeted tech and communication buying. The magnitude and breadth of negative leans argue for institutional de-risking rather than simple end-of-day rotation.
Technical Edge
Fair Values for February 10, 2026:
-
SP: 18.82
-
NQ: 82.83
-
Dow: 76.9
Daily Market Recap 📊
For Monday, February 10, 2026
• NYSE Breadth: 55% Upside Volume
• Nasdaq Breadth: 67% Upside Volume
• Total Breadth: 65% Upside Volume
• NYSE Advance/Decline: 59% Advance
• Nasdaq Advance/Decline: 60% Advance
• Total Advance/Decline: 59% Advance
• NYSE New Highs/New Lows: 297 / 63
• Nasdaq New Highs/New Lows: 384 / 164
• NYSE TRIN: 1.12
• Nasdaq TRIN: 0.72
Weekly Breadth Data 📈
For Week Ending Friday, February 6, 2026
• NYSE Breadth: 55% Upside Volume
• Nasdaq Breadth: 49% Upside Volume
• Total Breadth: 51% Upside Volume
• NYSE Advance/Decline: 61% Advance
• Nasdaq Advance/Decline: 44% Advance
• Total Advance/Decline: 50% Advance
• NYSE New Highs/New Lows: 548 / 184
• Nasdaq New Highs/New Lows: 678 / 809
• NYSE TRIN: 1.27
• Nasdaq TRIN: 0.81
ES & NQ Levels (Premium only)

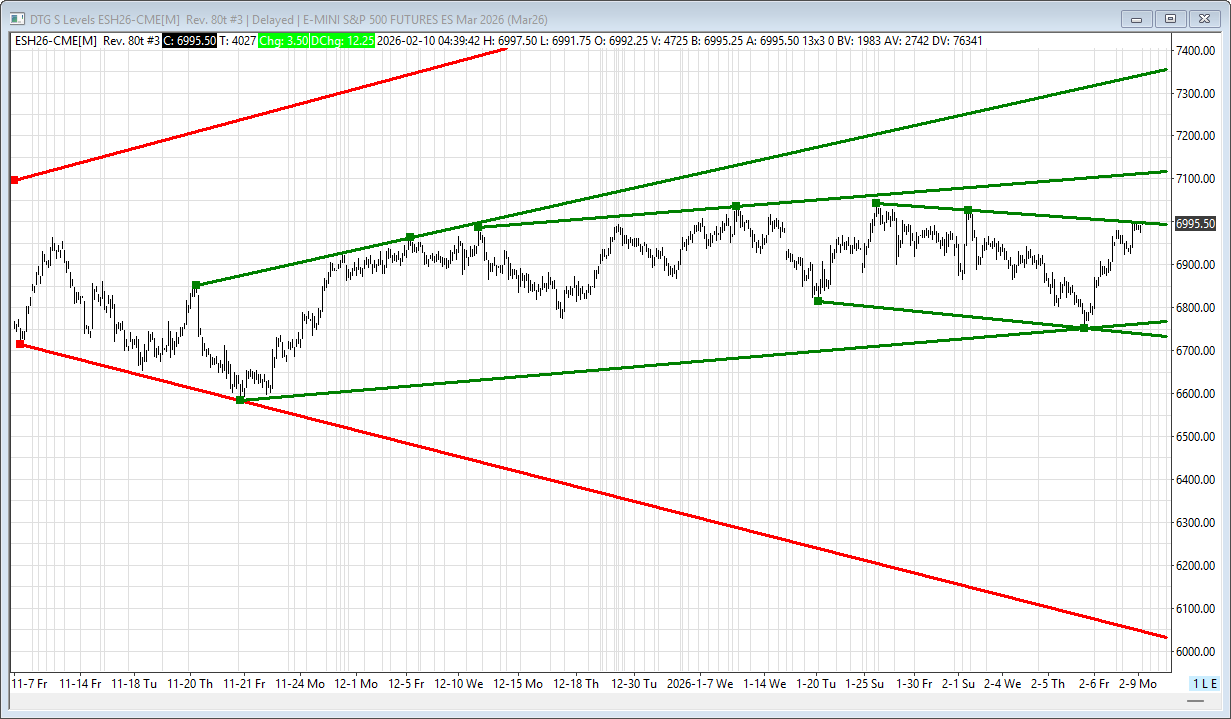
ES – H26 Levels
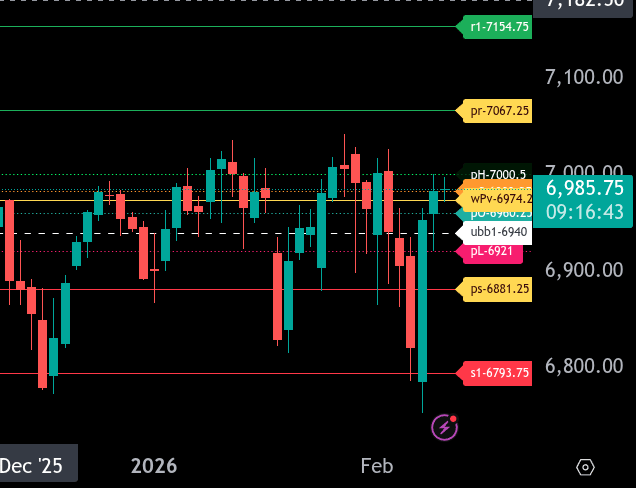
The bull/bear line for today is at 6974.25. This remains the key pivot for directional bias. Acceptance above this level would signal a shift back toward balance and potential upside continuation. Failure to reclaim it keeps pressure to the downside.
ES is currently trading around 6985.50, attempting to stabilize just above the bull/bear line. Holding above this area opens the door for a push toward 7000.50 and then 7067.25, which is the upper range target. A sustained move through that zone would expose 7154.75.
If price loses 6974.25, look for downside continuation toward 6960.25 and 6940. A clean break below 6921 would likely accelerate selling toward 6881.25, which is the lower range target for today. Below there, 6793.75 becomes the next major downside reference.
Overall, ES is in a fragile recovery attempt. Bulls need continued acceptance above 6974.25 to build momentum. Below that level, rallies are vulnerable to failure, and sellers remain in control.
NQ – H26 – Levels
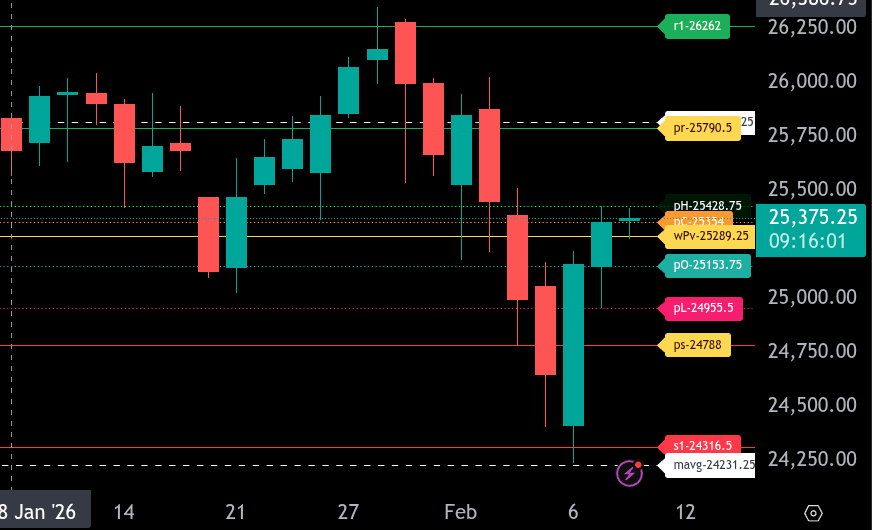
The bull/bear line for the NQ is at 25,289.25. This remains the key pivot for today. Acceptance above this level would signal stabilization after the sharp selloff, while failure to reclaim it keeps the pressure on the downside.
NQ is currently trading around 25,374.25, slightly above the bull/bear line, suggesting a short-term bounce attempt. Initial resistance is at 25,534.00, followed by 25,790.50. A move back into this zone would be corrective unless price can hold above 25,790.50.
On the downside, support sits at 25,153.75 and then 24,955.50. A break below 24,955.50 would likely open the door to 24,788.00 and potentially a deeper test toward 24,316.50.
Overall, this is still a fragile market. Bulls need sustained acceptance above 25,289.25 to shift momentum higher. Below that level, rallies should be treated with caution as countertrend moves within a broader bearish structure.
Calendars
Economic Calendar
Today
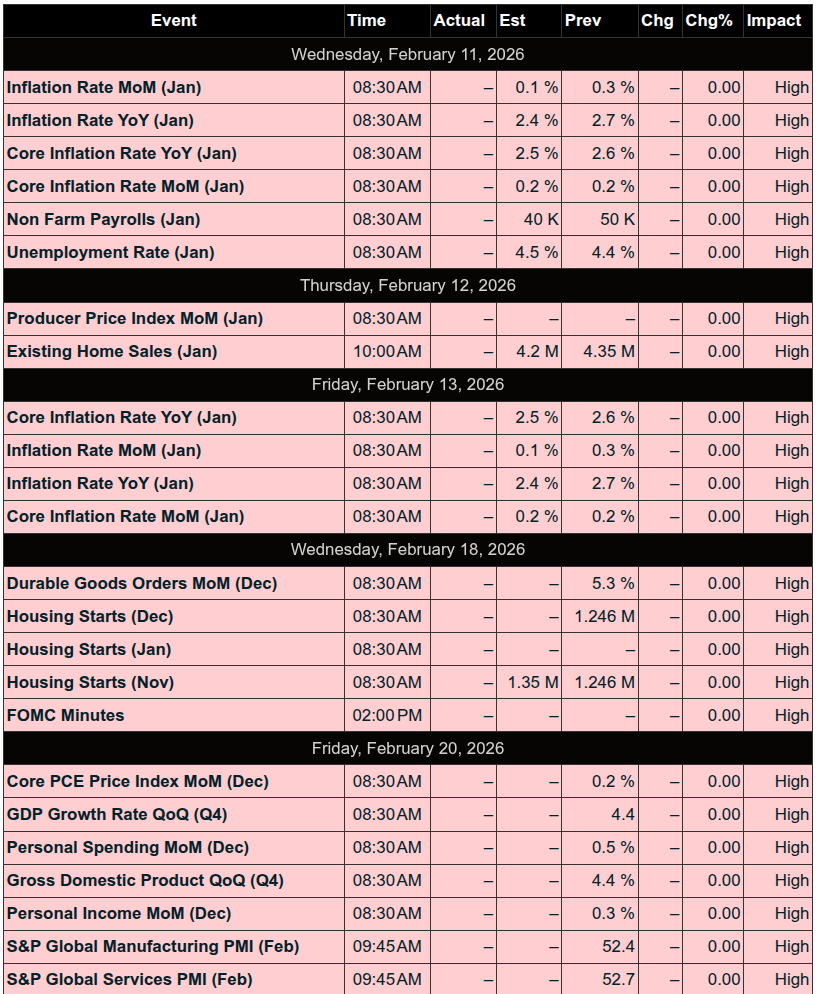
Important Upcoming
Earnings
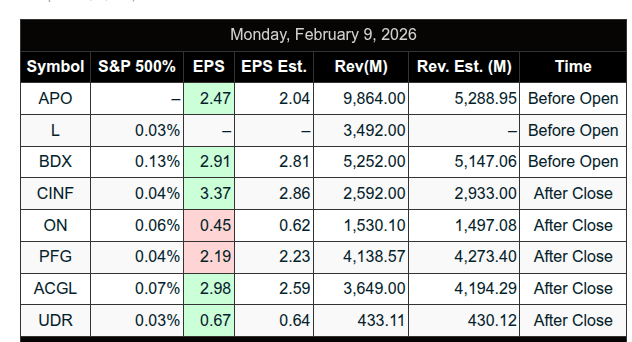
Recent
Trading Room Summaries
Polaris Trading Group Summary – Monday, February 9, 2026
Monday was a highly structured and rewarding trading day for the PTG team, marked by excellent trade planning, precision execution, and multiple target fulfillments — all aligning tightly with the Daily Trade Strategy (DTS) shared by David Dube.
Key Highlights of the Day:
-
Overnight Action:
-
Both upside and downside targets were already fulfilled by the start of RTH (regular trading hours), setting the stage for a well-mapped trading session.
-
-
Initial Play:
-
The market tagged the Cycle Day 1 (CD1) Average Decline Target at 6926.58 during Globex and retested it in RTH — a key confirmation that laid the foundation for the upside rally.
-
-
Morning Trade Wins:
-
Early MATD rhythms were observed and leveraged, with PTGDavid highlighting the support buy zone at 6918–6922, aligning perfectly with Setup #5.
-
Traders who entered here, as Manny noted, could have easily called it a day early — a “Day is Done” level trade.
-
-
Open Range & Bullish Breakout:
-
Bullish scenario activated with the price holding above 6965.
-
Targets of 6980, 6990, and 6995 were all hit, with celebratory “BOOM” and “BOOOM” calls marking the climactic moments.
-
These were clear wins based on precise scenario planning from the morning DTS Briefing.
-
-
Lunchtime Recap:
-
After the strong morning push, price entered a consolidation phase, as expected.
-
PTGDavid stepped out for lunch noting, “Free to move about the cabin” — signaling calm post-target conditions.
-
-
Afternoon Session:
-
Charts continued to stream with updates on @ES and @NQ.
-
A $2.2 billion MOC (Market On Close) sell imbalance was reported late in the day, but by then, the main objectives had been fulfilled.
-
Lessons & Takeaways:
-
Respect the Plan: Following the DTS Briefing and predefined levels gave traders a clear roadmap to success. Patience and discipline in execution paid off big.
-
CD1 Structure Mastery: Understanding and leveraging the Cycle Day framework continues to be a reliable anchor for trade scenarios.
-
Peak Entry Opportunity: The Setup #5 zone (6918–6922) was the golden trade of the day — technical confluence and confirmation led to a powerful reward.
-
Volume Analysis: There was a thoughtful exchange on volume buildup and potential accumulation, reinforcing the importance of reading price and participation.
Positive Trade Summary:
-
CD1 Avg Decline Target hit and retested.
-
Support Buy Zone 6918–6922 yielded large upside reward.
-
Bullish targets 6980 → 6990 → 6995 all achieved.
-
Open Range targets for both ES & NQ fulfilled.
Final Note:
“Solid DTS Briefing Plan for today,” David noted — and the market followed it almost to the tick. Today was a textbook example of how preparation and execution can lead to high-probability outcomes. Traders who followed the plan and executed around key levels were well rewarded.
Discovery Trading Group Room Preview – Tuesday, February 10, 2026
Market Focus
Investors are watching corporate earnings and Retail Sales data closely. After the Dow’s recent record high, U.S. equity futures are eyeing new all-time highs. Tech stocks rebounded Monday, signaling renewed strength in the AI trade.
Key Themes
-
Memory chip prices are surging (up ~50% QoQ), fueling a rally in chipmakers (+160% since Sep), while hurting consumer electronics stocks (-12%). Supply shortages are impacting earnings across Apple, Nintendo, telecom, auto, and PC sectors.
-
Some memory suppliers are asking customers to co-fund new $10B+ fabs to secure supply.
-
Cisco (CSCO) unveiled a new AI-focused switch chip to rival Nvidia (NVDA) and Broadcom (AVGO), manufactured by TSMC (TSM).
-
Chinese AI names like MiniMax (0100.HK), Zhipu (2513.HK), and others received buy ratings from JPM and GS, spotlighting China’s AI momentum.
Corporate Watch
-
Honda reported a 42% profit drop YoY, citing Trump-era tariffs and a weaker U.S. EV market. Motorcycle sales helped, but they cut 2030 EV goals from 30% to 20%.
-
Notable earnings (Premarket): ARMK, BP, CVS, DDOG, KO, MAS, MAR, SPGI, ZBH
-
After-hours: AIG, F, HOOD, GILD
-
Wednesday AM: MCD, TMUS, HUM, WMB, PAG, NTES, etc.
Economic Calendar
-
8:30am ET: Retail Sales, Employment Cost Index, Import Prices
-
10:00am ET: Business Inventories
-
Fed speakers: Hammack @12pm, Logan @1pm
Futures Technicals
-
ES remains in a short-term downtrend channel; 7003/00s remains key resistance. Breakout could open a path to 7115/20s.
-
Support: 6938 (50-day MA), 6768/73s, 6733/28s
-
Volatility cooled Monday (5-day ADR: 137.50), but remains elevated.
-
Whale bias: Bullish heading into 8:30am data on heavy overnight volume.
Affiliate Disclosure: This newsletter may contain affiliate links, which means we may earn a commission if you click through and make a purchase. This comes at no additional cost to you and helps us continue providing valuable content. We only recommend products or services we genuinely believe in. Thank you for your support!
Disclaimer: Charts and analysis are for discussion and education purposes only. I am not a financial advisor, do not give financial advice and am not recommending the buying or selling of any security.
Remember: Not all setups will trigger. Not all setups will be profitable. Not all setups should be taken. These are simply the setups that I have put together for years on my own and what I watch as part of my own “game plan” coming into each day. Good luck!
This post goes out as an email to our subscribers every day and is posted for free here around 2 PM ET. To get your real-time copy, sign up for the free or premium version here: Opening Print Subscribe.
Comments are closed