This post goes out as an email to our subscribers every day and is posted for free here around 2 PM ET. To get your real-time copy, sign up for the free or premium version here: Opening Print Subscribe.
Mag 7 Lose Their Mojo, 0DTEs Go Wild — This Ain’t Investing, It’s a Same-Day Knife Fight
Follow @MrTopStep on Twitter and please share if you find our work valuable!
Our View
Artificial Intelligence Anxieties
Yes, the NQ closed near its highs, the ES finished essentially unchanged, and the YM ended its three-day winning streak, but AI-related worries persist despite the massive infrastructure bets.
Major hyperscalers are ramping up capital expenditures aggressively for AI data centers, GPUs, servers, and cloud capacity: Amazon plans $200 billion, Alphabet (Google) $175–$185 billion, Meta $115–$135 billion, and Microsoft is on pace for $100–$145 billion (often cited around $145 billion based on run rates). Yet this unprecedented combined spending surge (projected at $635–$700 billion across the group) hasn’t lifted the cloud of concern among investors, who remain wary of cash flow pressures, delayed profitability from AI monetization, potential overcapacity risks, and recent stock volatility tied to these announcements.
With the exception of TSLA and NVIDIA, the Magnificent 7 were not so magnificent yesterday. META was –0.30%, AMZN was –1.39%, TSLA was +0.72%, GOOGL was –2.42%, NVDA was +0.86%, AAPL was +0.67%, and MSFT was –2.15%. The combined market cap loss over the last two sessions is nearly $700 billion and has shed nearly $3 trillion from its February high. I’m not smart enough to figure this out, but as I have been saying since the AI bubble talk, I think there has been selling going on under the surface since October 2025.
Our Lean
Traders can think whatever they like, but between algorithmic, HFT, and AI, the bots have turned the trade into a giant auto bot that, if you get on the wrong side, you just get run over by the hundreds of programs. The ES has been down 8 of the last 11 sessions, and the NQ has been down 6 of the last 10 sessions, down 4.05% YTD. It’s hard to overlook the price action.
Our lean: it seems like you can buy the lower opens and sell the higher opens. After yesterday’s drop, I think you can buy the early weakness if the futures open lower, but I have to admit I’m becoming a pessimistic bull. Keep an eye on yesterday’s low of 6930.00.
Support and Resistance Levels:
Pivot Point 2nd Level Resistance: 7048.17
Pivot Point 1st Resistance Point: 7004.33
Price 3 Standard Deviations Resistance: 6980.26
Price 2 Standard Deviations Resistance: 6976.63
Price 1 Standard Deviation Resistance: 6971.91
Price 1 Standard Deviation Support: 6949.09
Price 2 Standard Deviations Support: 6944.37
Price 3 Standard Deviations Support: 6940.74
Pivot Point 1st Support Point: 6923.83
The Kobeissi Letter
@KobeissiLetter
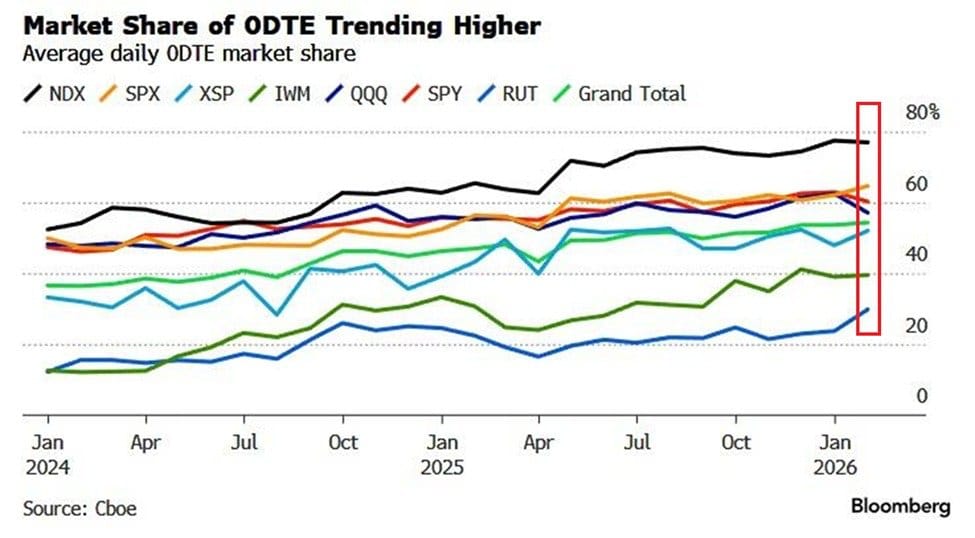
This data is incredible: 0DTE options now command a record ~78% of daily Nasdaq 100 volume (up 23 points since 2024) and ~65% of S&P 500 volume. They also account for nearly 60% of volume in $QQQ and $SPY, followed by $IWM at ~40%. Collectively, 0DTEs represent a record 55% of volume across these assets—up from 38% in 2024—signaling that risk appetite is through the roof.
Key Takeaways
Nasdaq 100: 78% volume (Record high)
S&P 500: 65% volume (Up from 50%)
ETFs ($QQQ/$SPY): ~60% volume
Aggregate: 55% of all activity is now same-day expiration.
Guest Posts:
Market Recap:
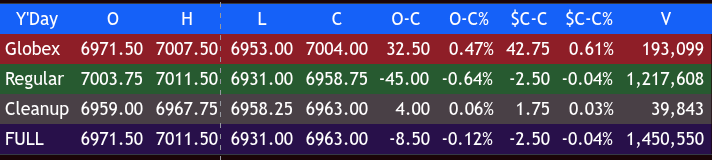
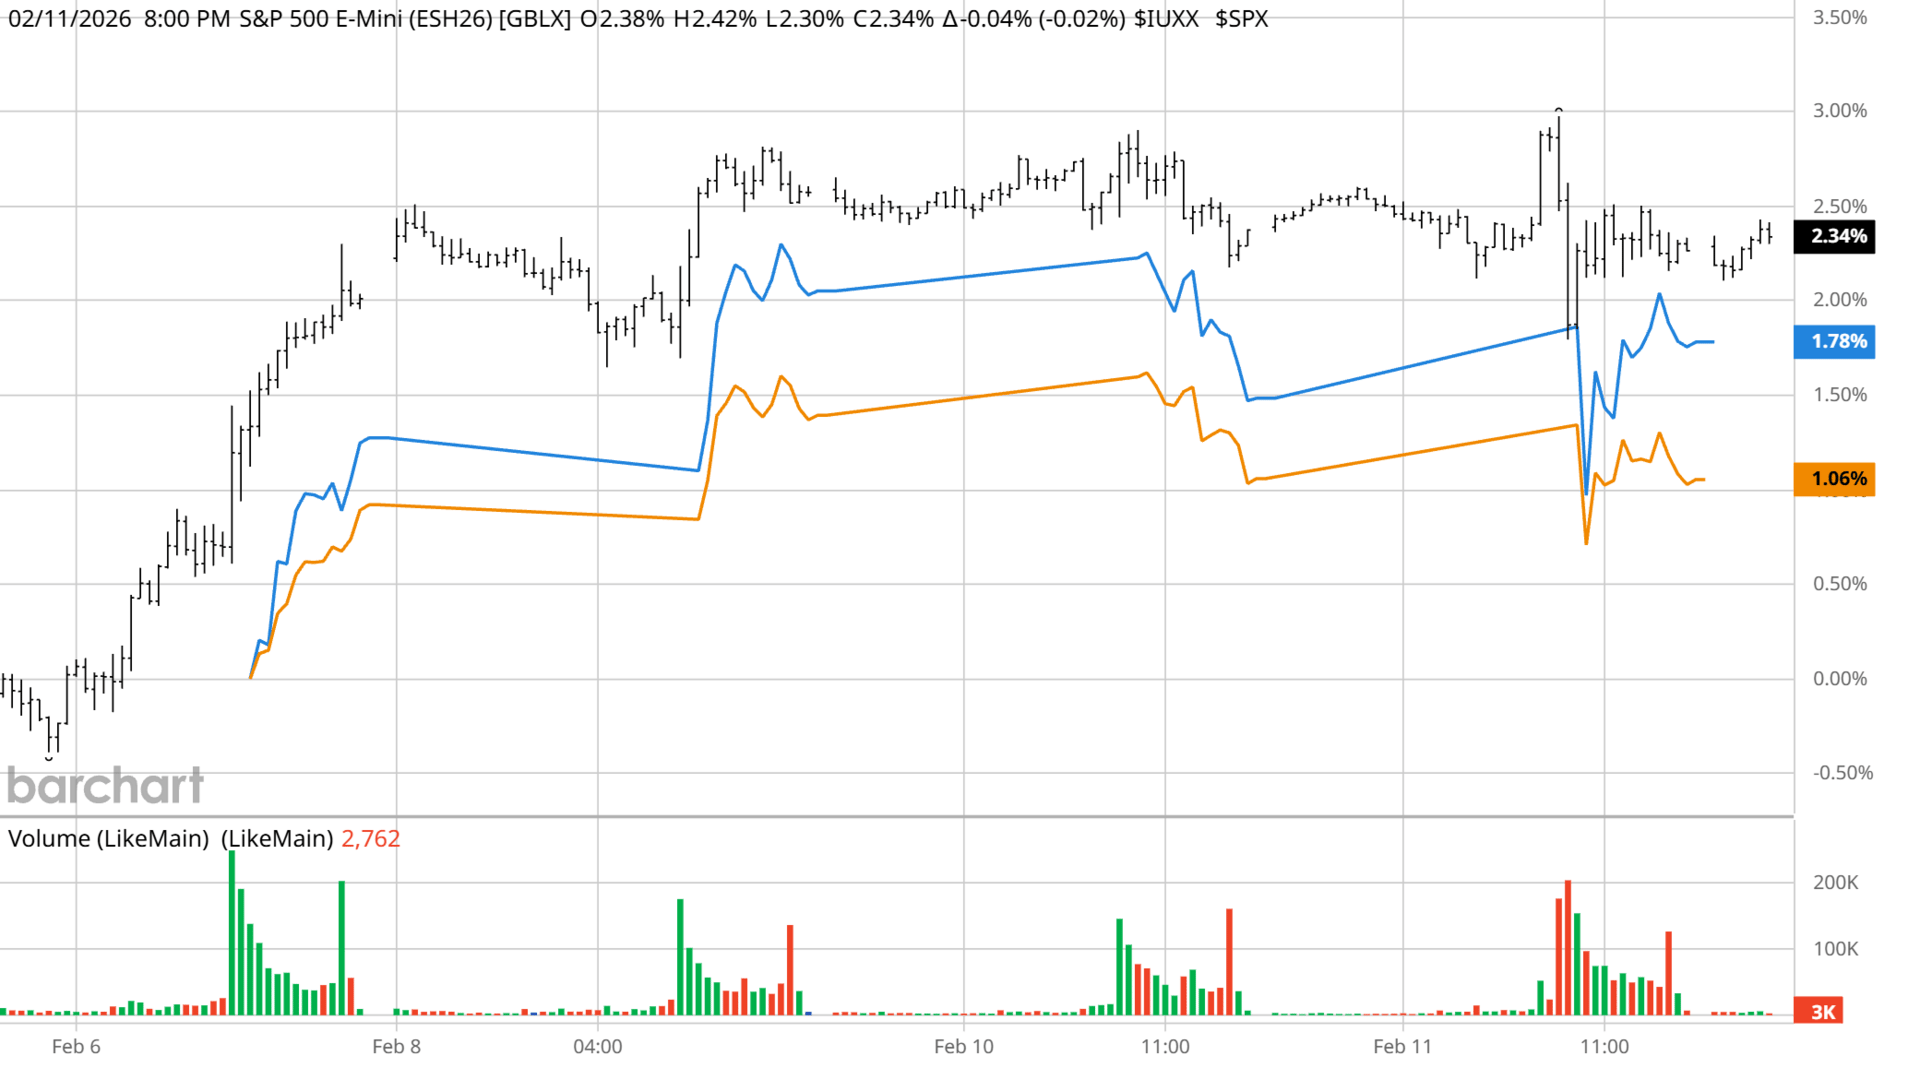
The ES made a low at 6962.75 and rallied up to 7008.75 on Globex and opened Wednesday’s regular session at 7003.75.
After the open, the ES rallied up to 7011.50 and then dropped 81.50 points down to 6931.00 at 10:25, rallied up to 6966.50, sold off down to a higher low at 6953.00 at 11:05, rallied up to 6974.25 at 11:20, and sold back off down to 6954.50.
The ES then rallied up to 6973.25, sold off down to 6953.25 at 12:00, rallied up to 6979.75 at 12:50, and sold back off down to 6953.50 at 1:15. It did a sideways-to-up back-and-fill, rallied back up to a lower high by two ticks at 6979.25 at 2:25, and pulled back to 6963.50 at 2:45.
The ES traded back up to 6972.00 at 3:50 and then stutter-stepped down to 6965.50 at 3:30, rallied back up to 6968.75 at 3:40, and traded the same as the 3:50 imbalance came out flat. It sold off down to 6961.50, rallied back above the VWAP at 6969.75, sold back off down to 6963.25 at 3:57, and traded 6958.75 on the 4:00 cash close.
After 4:00, the ES traded up to 6968.00 at 4:45 and settled at 6960.50, down 1 point or -0.01%. The NQ settled at 25,288.50, up 70.25 points or +0.28%, and the YM settled at 26,675.60, down 12.70 points or -0.47%.
In the end, I think the stronger-than-expected jobs number, 130k nonfarm payroll, slowed expectations of a near-term rate cut and the continued weakness in the AI and tech software stocks that started Tuesday followed through yesterday.
In terms of the ES and NQ’s overall tone, after a small bump up after the open, both sold off but rebounded. In terms of the Es’s overall trade, volume was higher at 1.453 million contracts traded.
Polymarket and Trump’s Tariffs
Like many things when it comes to the markets, this one seems to have fallen off the truck: the Supreme Court ruling on the legality of Trump’s tariffs.
On Tuesday, Supreme Court Justice Ketanji Brown Jackson dampened expectations for a swift court-mandated refund of President Donald Trump’s recently imposed tariffs. Jackson said that any legal challenge involves “lots of nuanced legal issues” and that drafting a ruling takes considerable time due to the constitutional complexities.
Prediction market traders reacted swiftly, with Polymarket odds that the Court will force Trump to refund the tariffs crashing to 28% (down from a recent high of 39%) on a contract expiring June 30. Jackson’s remarks underscore that the justices, currently in recess until February 20, are in no hurry to narrow the window for a decision—let alone the logistical challenges of issuing widespread refunds—while Trump has warned an unfavorable ruling could cost the U.S. hundreds of billions or even trillions in repayments.
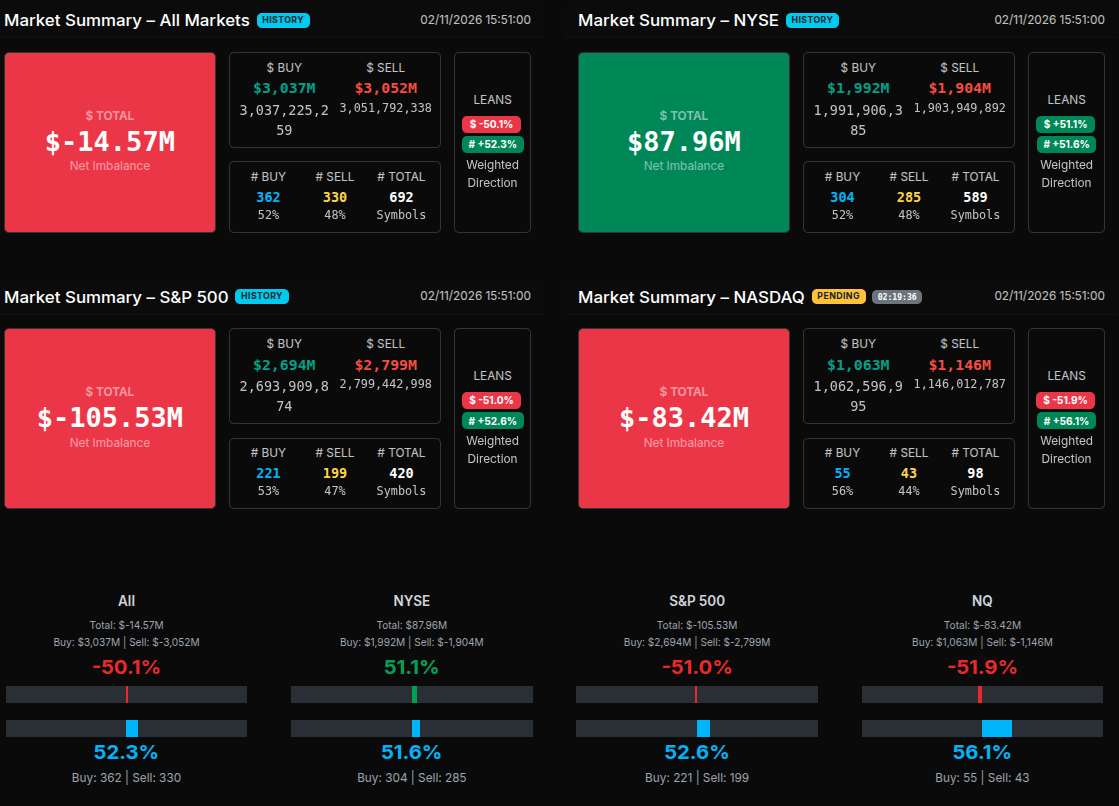
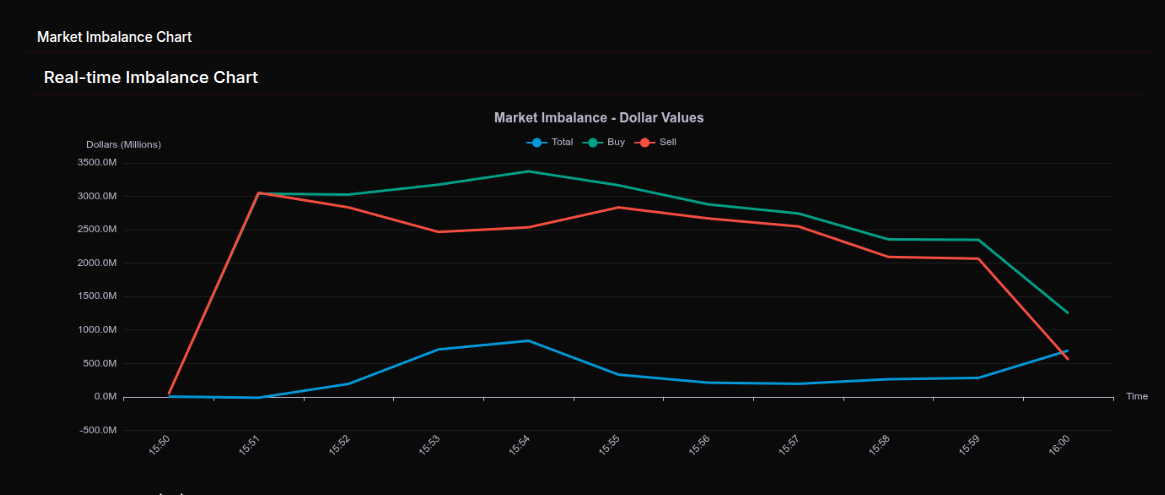
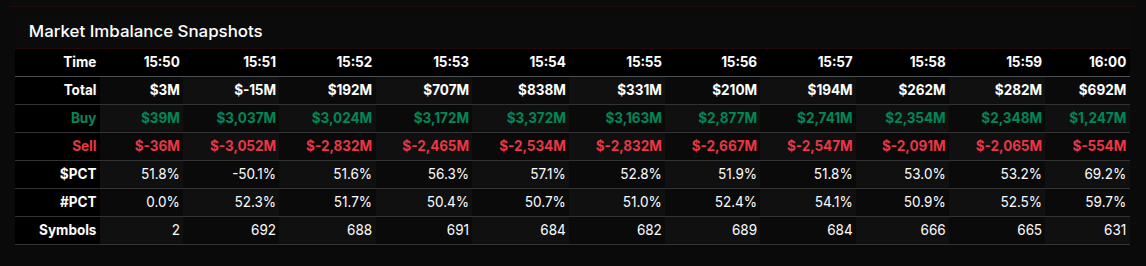
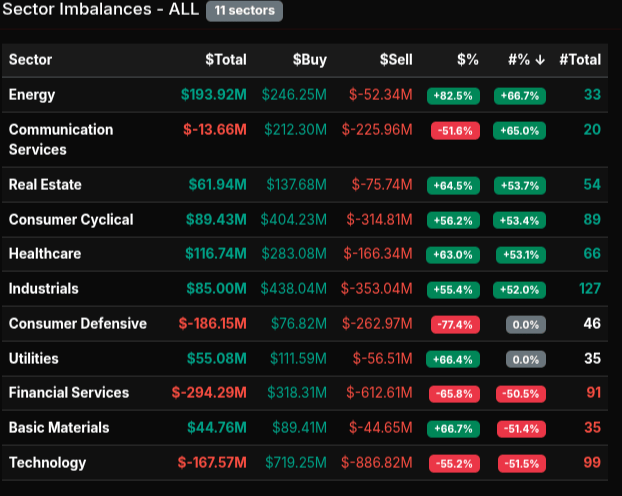
MiM
The February 11th MOC session opened with a modest $3 million buy imbalance at 15:50, quickly flipping to a $15 million sell at 15:51 before surging to a $192 million buy at 15:52. That early whipsaw set the tone for a rotational close. By 15:54, the imbalance peaked near $838 million to buy, then steadily bled lower into 15:59. The final 16:00 print showed a $692 million buy imbalance with a sharp jump in $PCT to 69.2%, signaling a late institutional push rather than steady accumulation throughout the window.
Despite the late buy skew, the broader tape leaned mixed. All Markets closed at -$14.57 million net, with sells marginally outweighing buys. The S&P 500 finished with a -$105.53 million imbalance and Nasdaq at -$83.42 million, both reflecting index-level pressure. NYSE, however, closed +$87.96 million, highlighting divergence between old-line and growth-heavy names.
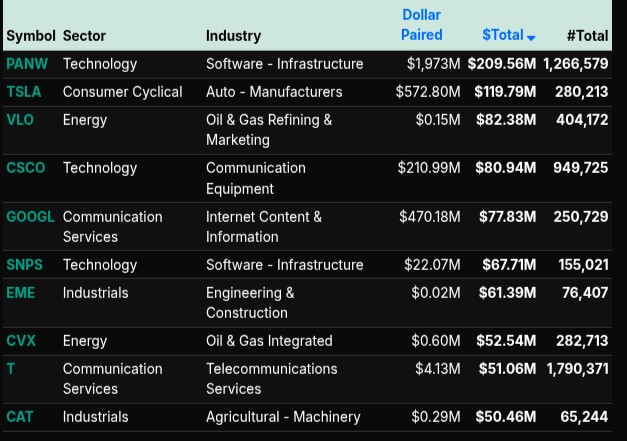
Sector flows showed clear pockets of wholesale activity. Energy led decisively with +82.5% and +66.7% by symbols, indicating broad-based institutional buying. Real Estate (+64.5%), Healthcare (+63.0%), Utilities (+66.4%), and Basic Materials (+66.7%) also leaned strong to the buy side, suggesting defensive and hard-asset accumulation. In contrast, Consumer Defensive (-77.4%) and Financial Services (-65.8%) reflected heavy distribution, with Financials also showing -50.5% symbol participation — a notable wholesale unwind. Technology printed -55.2%, more rotational than extreme, but the symbol breadth at -51.5% confirmed internal weakness.
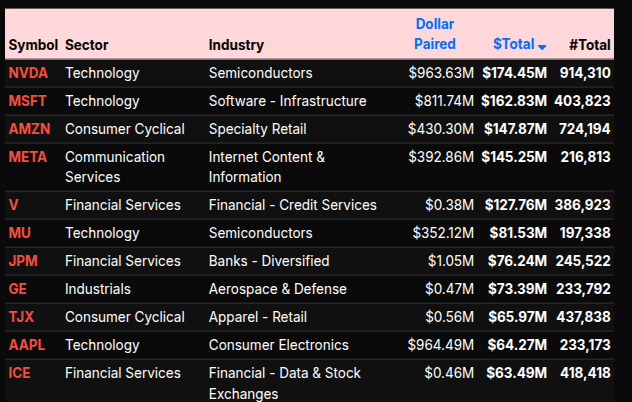
Single-name flows were concentrated. NVDA (+$174M), MSFT (+$162M), AMZN (+$147M), META (+$145M), and V (+$127M) dominated the tape. PANW (+$209M) and TSLA (+$119M) added to the growth bid, while energy names like VLO and CVX confirmed the sector strength.
Overall, the MOC reflected rotation beneath the surface: defensive and energy accumulation offset by financial and consumer defensive selling, capped by a late institutional buy program into the bell.
Technical Edge
Fair Values for February 12, 2026
-
S&P: 18.45
-
NQ: 79.01
-
Dow: 69.34
Daily Breadth Data 📊
For Wednesday, February 11, 2026
• NYSE Breadth: 52% Upside Volume
• Nasdaq Breadth: 52% Upside Volume
• Total Breadth: 52% Upside Volume
• NYSE Advance/Decline: 54% Advance
• Nasdaq Advance/Decline: 38% Advance
• Total Advance/Decline: 44% Advance
• NYSE New Highs/New Lows: 417 / 80
• Nasdaq New Highs/New Lows: 355 / 270
• NYSE TRIN: 1.07
• Nasdaq TRIN: 0.56
Weekly Breadth Data 📈
For the Week Ending Friday, February 6, 2026
• NYSE Breadth: 55% Upside Volume
• Nasdaq Breadth: 49% Upside Volume
• Total Breadth: 51% Upside Volume
• NYSE Advance/Decline: 61% Advance
• Nasdaq Advance/Decline: 44% Advance
• Total Advance/Decline: 50% Advance
• NYSE New Highs/New Lows: 548 / 184
• Nasdaq New Highs/New Lows: 678 / 809
• NYSE TRIN: 1.27
• Nasdaq TRIN: 0.81
BTS Levels:
ESH2026
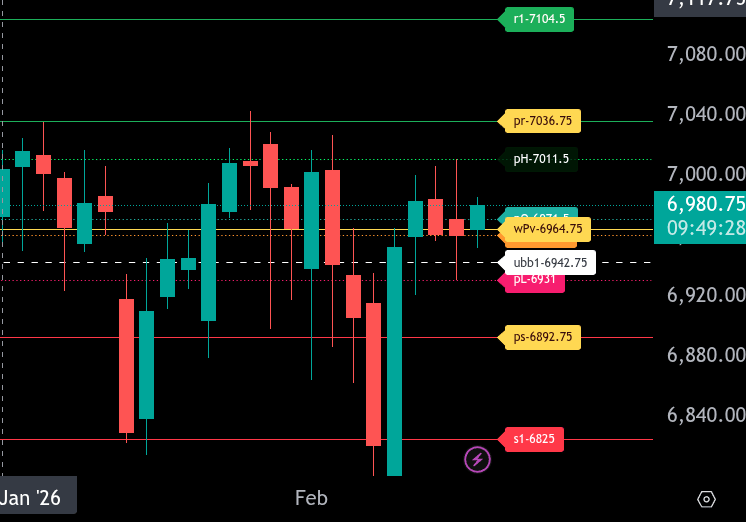
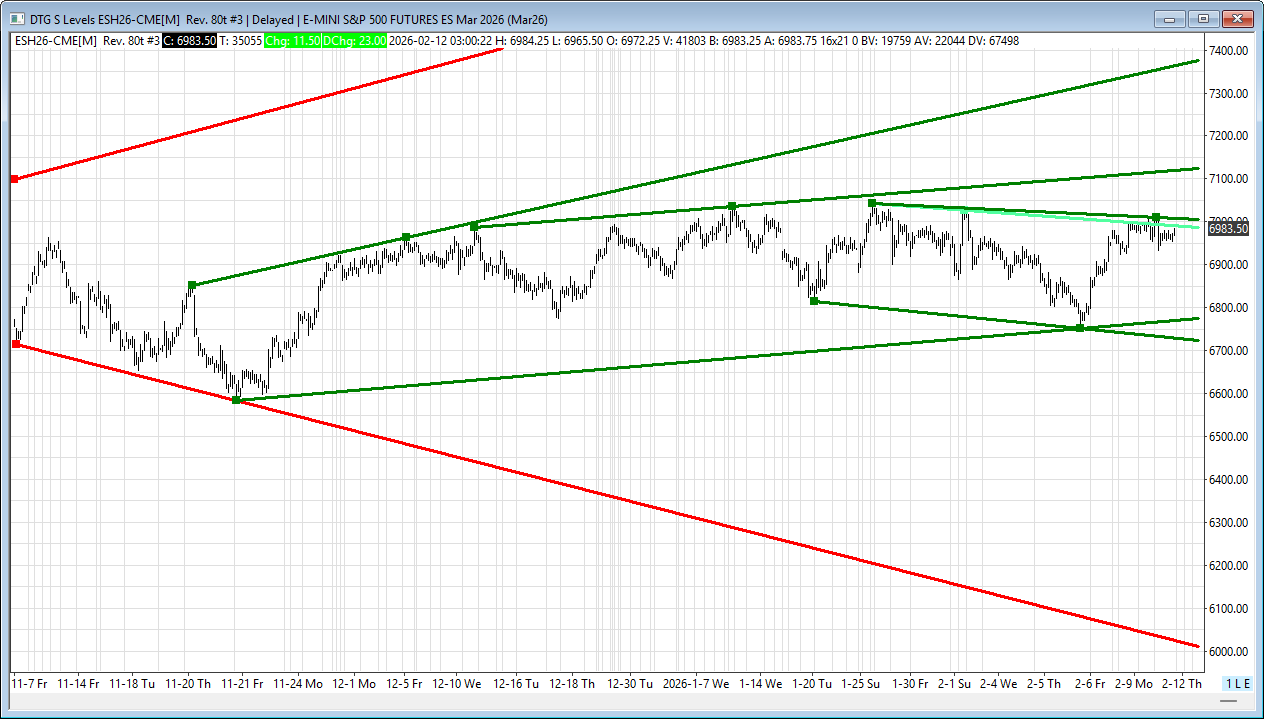
The bull/bear line for the ES is at 6964.75. This is the key pivot for today. Holding above keeps the short-term tone constructive, while acceptance below shifts pressure back to the downside.
ES is trading around 6981.00 in the Globex session, above the bull/bear line and just under minor resistance at 7011.50. A push through 7011.50 opens the door to 7036.75, which is today’s upper range target. If momentum builds above 7036.75, look for a continuation squeeze toward 7104.50.
On the downside, first support comes in at 6971.50 and then 6964.75. A break and hold below the bull/bear line exposes 6942.75 and 6931.00. Below 6931.00, the lower range target at 6892.75 becomes the focus. A failure there opens the door to 6825.00.
Overall, above 6964.75, the path of least resistance is higher with 7011.50 and 7036.75 as upside objectives. Below 6964.75, sellers regain control, and 6931.00 to 6892.75 becomes the key downside zone to monitor.
NQH2026
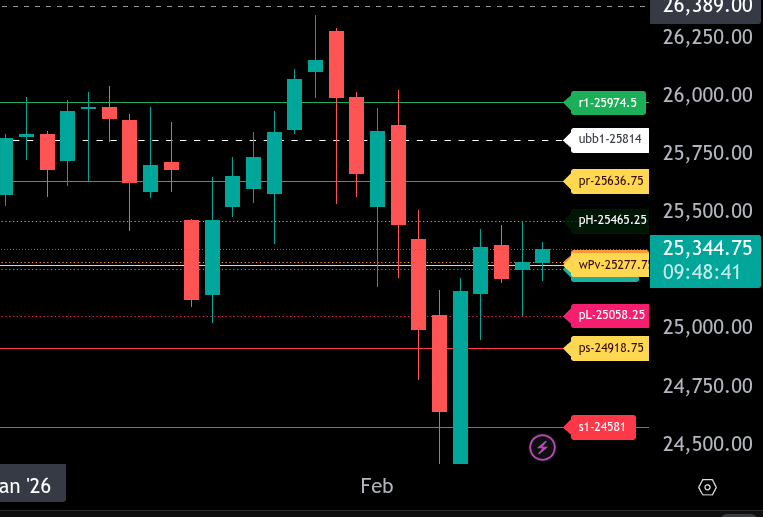
The bull/bear line for the NQ is at 25,277.75. This is the key pivot for today. Holding above keeps the short-term tone constructive, while acceptance back below shifts control to sellers.
NQ is trading around 25,351.25 in Globex, above the bull/bear line and attempting to build value higher after reclaiming the 25,250–25,280 area. As long as price holds above 25,277.75, upside rotation toward 25,465.25 is likely, followed by 25,636.75, our upper range target for today. A sustained push through 25,465.25 opens the door for an expansion move into that upper target.
If NQ fails back below 25,277.75, look for downside pressure toward 25,259.00 and then 25,058.25. Below 25,058.25, momentum likely increases toward 24,918.75, our lower range target. A break and acceptance below that level would signal a deeper corrective phase.
On the upside, resistance comes in at 25,465.25 and then 25,636.75. On the downside, support is layered at 25,259.00, 25,058.25, and 24,918.75.
Overall, the tone is neutral to bullish above 25,277.75 and bearish below. Watch for acceptance and volume around the bull/bear line to determine whether today becomes a range extension higher or a rejection back into the lower distribution.
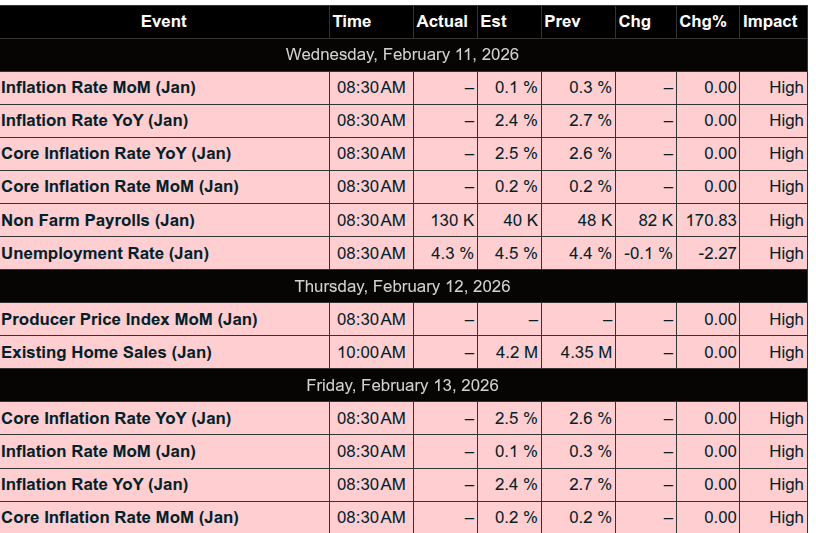
Economic Calendar Today
This Week’s High Importance
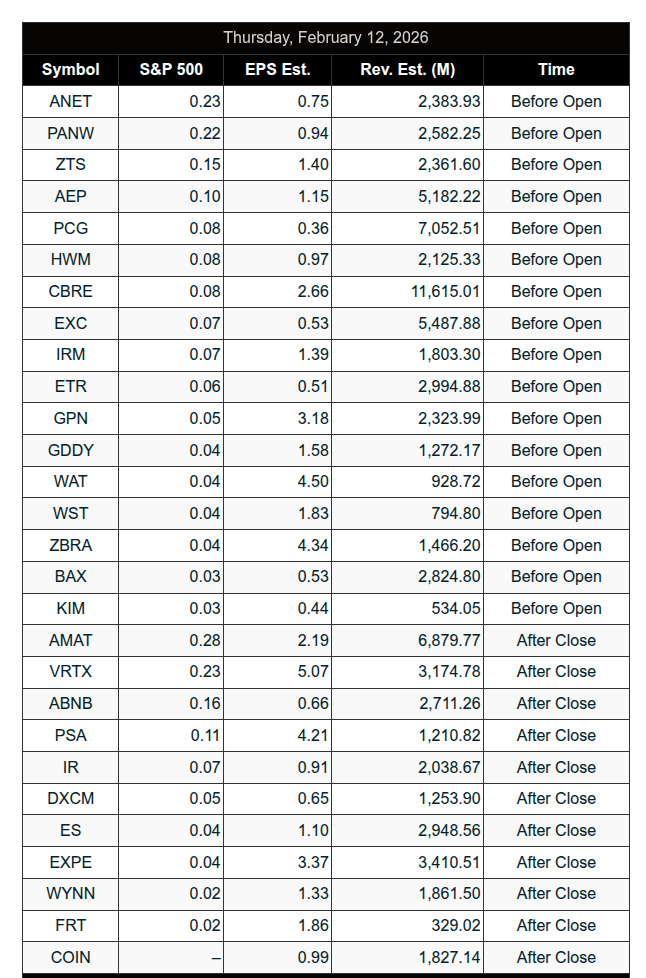
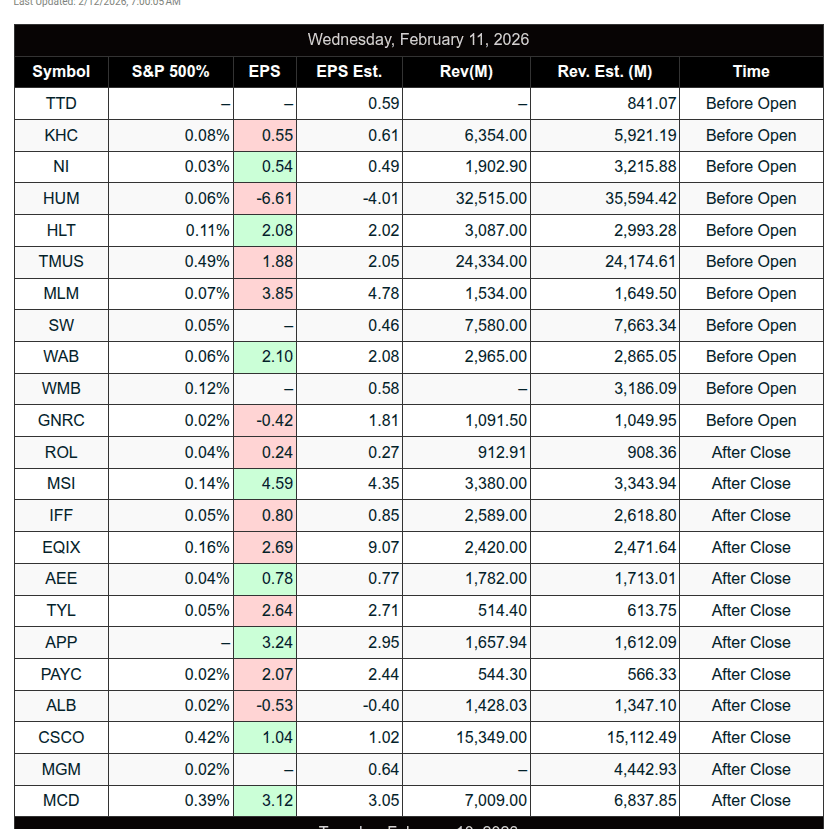
Earnings:
Recent
Trading Room News:
PTG Room Summary – Wednesday, February 11, 2026
Yesterday was a strong expansion session following Tuesday’s balance, with Cycle Day 3 delivering high-probability Open Range and gap fill opportunities. While the primary lean was long above 7000, the market provided an early short setup that triggered “Godzilla” OPR trades in ES and NQ. Execution, scaling discipline, and trailing stops defined the day, with multiple members locking in significant wins. It was a textbook example of structure first, bias second.
Market Context & Plan
-
Cycle Day 3 framework in play after prior balancing session.
-
Key psychological level: 7000 (“7000 or Bust” theme).
-
Primary lean: Long above 7000.
-
Macro catalysts included shifting Fed cut expectations and strong jobs data.
-
Gap structure created early downside opportunity despite higher-timeframe bullish lean.
Open Range & Gap Fill Execution
-
PKB Short activated early.
-
@ES OPR Short triggered and scaled.
-
@NQ OPR Short triggered — all targets fulfilled.
-
Gap fill objective aligned with structure.
-
Clean momentum expansion produced what members called “Godzilla trades.”
-
Trailing stop on ES allowed runners to extend before being elected.
-
CL OPR long attempt was stopped — handled mechanically with no hesitation.
Lessons Reinforced
-
Bias does not override structure — shorts were taken despite a higher-level long lean.
-
OPR remains powerful when aligned with momentum and gap logic.
-
Scaling out reduces emotional load and locks in realized gains.
-
Trailing runners maximizes expansion days.
-
Stop-outs (CL) are simply business expenses when managed correctly.
-
Communication matters — minor audio hiccups handled quickly without disrupting trade focus.
End-of-Day Tone
-
MOC showed mild sell pressure but no late-session chaos.
-
No overtrading into the close.
-
Professional wrap-up with review of Open Range performance.
Bottom Line
Yesterday transitioned from early rotational opportunity into decisive expansion, rewarding traders who followed structure rather than narrative. The room demonstrated patience, scaling discipline, and execution consistency — exactly what Cycle Day 3 is designed to provide.
DTG Room Preview – Thursday, February 12, 2026
Market Focus
-
Earnings + tomorrow’s CPI data driving positioning
-
January Jobs: +130K → February rate cut odds down to ~5%
-
Next rate cut expectations pushed toward mid-year
-
KC Fed’s Schmid: policy no longer restrictive after three cuts
-
Inflation concerns still lingering
Washington
-
Six Republicans joined Democrats to pass resolution targeting Canada tariffs
-
Measure largely symbolic given veto power
-
Trump publicly pushed back on GOP opposition
Earnings Movers
-
Cisco (CSCO) – Missed on profit; stock -7% AH
-
McDonald’s (MCD) – Beat on value traffic; shares slipped
-
Lenovo – Beat Q3 rev; warned on memory shortage, raising prices, restructuring toward AI inference
-
Samsung Electronics – Shipping upgraded HBM chips (11.7 Gbps, +22% vs prior gen); still trailing peers in AI memory race
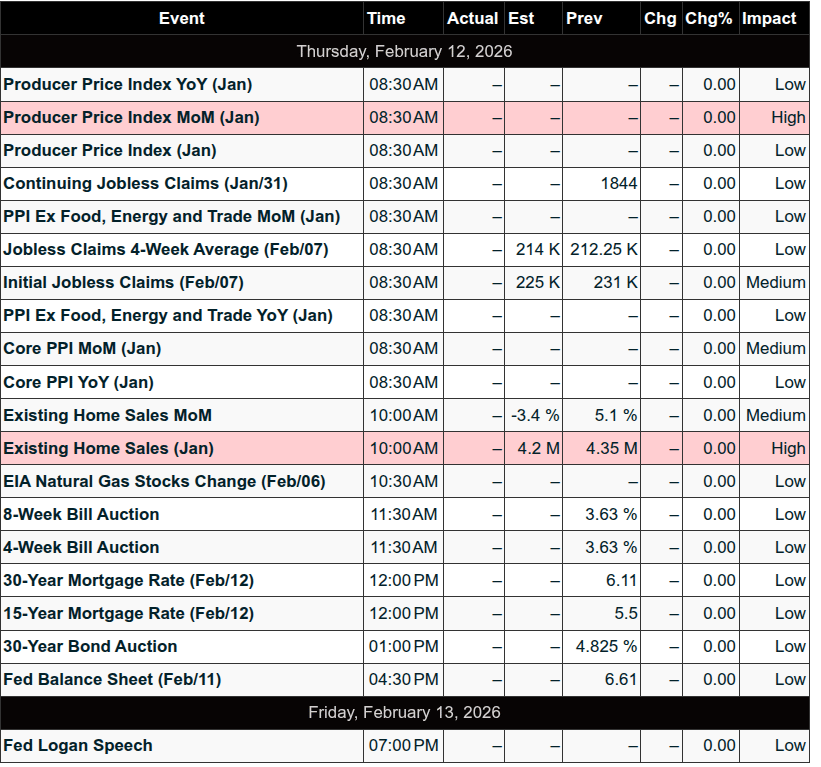
Today’s Economic Calendar
-
8:30am ET – Weekly Jobless Claims
-
10:00am ET – Existing Home Sales
Notable Earnings Today
-
After bell: Airbnb (ABNB), Coinbase (COIN), DraftKings (DKNG), Roku (ROKU), and others
-
Friday AM: ENB, MGA, NWG, TRP
Volatility / Flow
-
ES 5-day ADR down to 114.75 → vol contracting but still elevated
-
Whale bias: bullish into Claims
-
Overnight large trader volume: light
ES Technical Picture
-
Short-term downtrend channel top (7008/05s) = resistance for 3rd straight session
-
If Jobs couldn’t break it, CPI may be next catalyst
-
Market may need lower move first to regain upside momentum
-
Channel support: 6775/80s
-
50-day MA: 6939.50 (Wednesday LOD bounce area)
Key Levels
-
TL Resistance: 7008/05s, 7122/27s, 7375/80s
-
TL Support: 6775/80s, 6723/18s
Affiliate Disclosure: This newsletter may contain affiliate links, which means we may earn a commission if you click through and make a purchase. This comes at no additional cost to you and helps us continue providing valuable content. We only recommend products or services we genuinely believe in. Thank you for your support!
Disclaimer: Charts and analysis are for discussion and education purposes only. I am not a financial advisor, do not give financial advice and am not recommending the buying or selling of any security.
Remember: Not all setups will trigger. Not all setups will be profitable. Not all setups should be taken. These are simply the setups that I have put together for years on my own and what I watch as part of my own “game plan” coming into each day. Good luck!
This post goes out as an email to our subscribers every day and is posted for free here around 2 PM ET. To get your real-time copy, sign up for the free or premium version here: Opening Print Subscribe.
Comments are closed