This post goes out as an email to our subscribers every day and is posted for free here around 2 PM ET. To get your real-time copy, sign up for the free or premium version here: Opening Print Subscribe.
Flight to Quality or Another AI Bubble Pop? Strap In — This CPI Could Light the Fuse!
Follow @MrTopStep on Twitter and please share if you find our work valuable!
Our View
The Flight to Quality: Buy Bonds / Sell Stocks
Yes, I used AI for today’s CPI number, and Goldman Sachs and JPMorgan have offered contrasting pre-release views on the January 2026 CPI report being released today.
Goldman Sachs anticipates a softer print, forecasting headline CPI at 2.4% year-over-year (below the consensus of ~2.5%, down from December 2025’s 2.7%), which would reinforce expectations of moderating inflation. They note minor upward pressure from tariffs contributing about 0.07 percentage points to core (potentially affecting categories like clothing, household furnishings, recreation, education, and personal care), but overall see core trends cooling (with underlying progress masked by one-time tariff effects, already near 2.3% ex-tariffs), supporting hopes for Fed easing later in 2026 amid labor market rebalancing and fading catch-up effects.
JPMorgan, in contrast, projects a slightly hotter core reading with a monthly gain of 0.39% (versus consensus ~0.3%), implying year-over-year core around 2.6% or mildly above expectations. Their trading desk outlines scenarios for market impact: a 0.35–0.4% monthly core (most likely at ~42.5% probability) could lift the S&P 500 by 0.25–0.75%; a hotter print (>0.45%, ~5% chance) might pressure equities down 1.25–2.5%.
Longer term, JPMorgan expects CPI to accelerate to 3.6% YoY by mid-2026 due to tariff pass-through and fiscal stimulus before declining to 2.2% by late 2026 as those effects fade, signaling stickier near-term risks and caution on aggressive Fed cuts.
This split highlights key market tension ahead of today’s data, with Goldman leaning dovish on cooling dynamics and JPMorgan emphasizing potential volatility from stickiness. Consensus economist polls (e.g., Dow Jones) align closer to 2.5% headline YoY and 0.3% monthly for both headline and core.
Honestly, I have no idea how the CPI number will turn out. Will it be a good number and the ES and NQ rally, or will it be a negative number and they sell off? What I do know is that the markets seem like we could see lower prices, but again, the gaps will matter.
Our Lean
The basic pattern is when you get too bullish on the ES and NQ, they go down, and when you get too bearish, they go up. So far, all the pops have ended up as dead cat rallies.
Our lean: The notional value of today’s week-two February options expiration is around $4 trillion. Between both the CPI numbers and the expiration, I expect more fireworks. Should the ES gap down hard on the 9:30 open with oversized volume, I can’t rule out trying to buy it, partly because I think everyone is short and the ES ran so many sell stops that it could do an initial squeeze. Additionally, when the ES go down as hard as they did yesterday, they tend to rally on Globex. I’m not trying to be bullish, but I also can’t rule out a pop. The question is: Can they hold the rally?
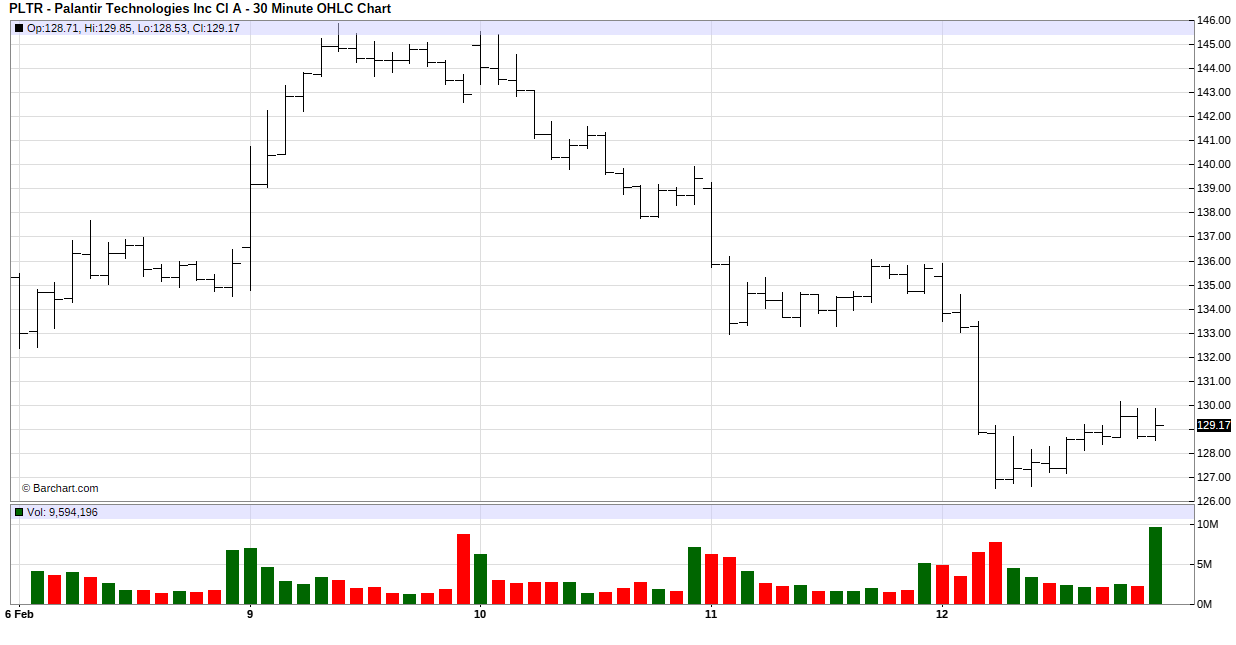
Michael Burry was actually right about some of his short stock calls; he was just early. Just look at Palantir Technologies — he was short at $180. Yes, he got shaken out of some of his positions, but on February 10th he identified a classic “head & shoulders” reversal pattern in Palantir’s stock chart, and it is down approximately 9.6% since February 8, 2026. Here is a video titled Michael Burry Says We’re In Another Bubble
Again, I can’t rule out that this is just another selloff before another big bounce. As I said in this week’s OP, there is $700 billion going into AI infrastructure. Yes, I believe AI is the future, but I also think there was too big a rush into the big names. Shakeouts have always been part of the stock market, and today’s question is how long and how far it will go.
Guest Posts:
January Barometer — The Data Since 1970
Rich Miller: HandelStats
At HandelStats, we let the numbers speak.
Since 1970, the S&P 500 has finished higher in January 33 times and lower 23 times. Over that same period, the full year has closed higher 42 times and lower just 14 times — a 75% annual win rate.
But here’s where it gets interesting.
When January Is Positive
In the 33 years that January finished higher:
-
The full year ended higher 29 times
-
Down just 4 times
-
That’s an 87.88% probability of a positive year
January strength meaningfully tilts the odds.
When January and February Are Both Up
Since 1970, January and February have both closed positive 22 times.
In those years:
-
The market finished higher 21 out of 22 times
-
A 94.45% probability of a positive year
Momentum early in the year matters.
When January, February and March Are All Positive
An even more powerful signal emerges when Q1 builds progressively:
-
January up
-
February up
-
March up
This has occurred 16 times since 1970.
In every single one of those years, the S&P 500 finished higher.
100% historical win rate.
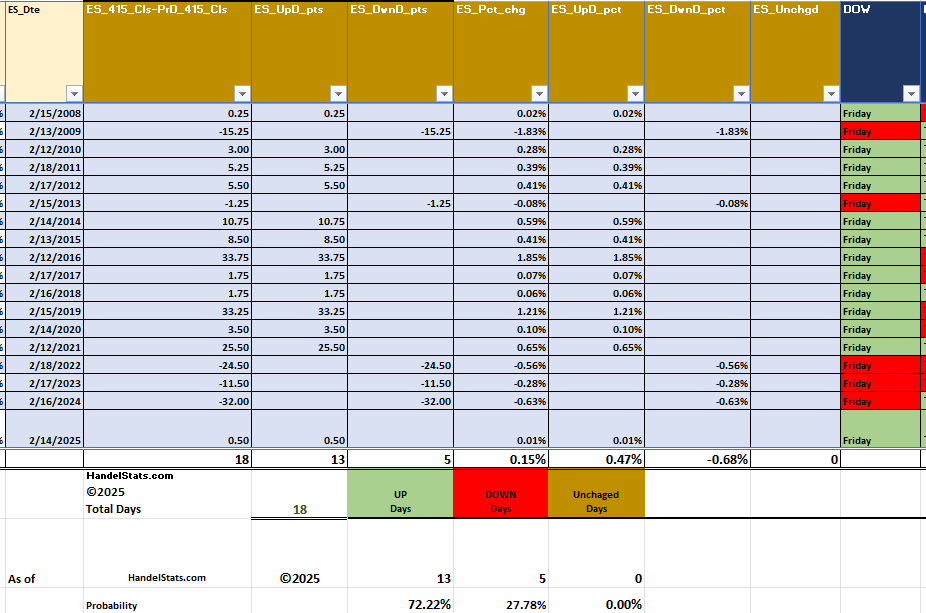
Presidents Day Long Weekend Bias
HandelStats: Rich Miller
Since 2008, the S&P 500 has shown a consistent positive bias into the Presidents Day holiday.
Looking at the Friday before the long weekend:
-
Up 13 out of 18 years
-
A 72.22% win rate
-
Only 5 down occurrences
-
No unchanged closes
Long weekends often carry a subtle bullish drift, and Presidents Day has followed that pattern historically.
While sample size is modest, the bias is statistically meaningful — especially in stable trend environments.
We’ll see if the pattern holds again this year.

Get instant access to our partners’ real-time market data and insights not available anywhere else. Here is last night’s Founder’s note getting you ready for today’s market and explaining the constraints in yesterday’s market. – MrTopStep
Founder’s Note:
Futures are off 20bps with CPI at 8:30 AM ET.
TLDR: It’s sketchy out there. A break <6,800 implies we visit the 6,600s as downside put positions drive short hedging. Low CPI may kick-save things, with a positive market response having a clear path back to 6,900. Ultimately we think upside is only worth a day trade at this point, as rallies likely remain unstable. If the SPX gets into the 6,600s it’s likely vol premium gets rich enough for vol sellers to step up, which could offer support.
Gamma is negative both above and below current SPX prices (6,815), save for one mildly large 0DTE strike at 6,750. That strike is not big enough to hold up the market, should the SPX break 6,800. We think that if that level breaks, then a visit to the 6,600s is on tap. We had been of the view that next weeks OPEX would loosen up the downside, but once the Risk Pivot/Vol Trigger (6,900) were broken it rendered that view moot.
To the upside, it’s clear sailing into 6,900. This violent mean reversion path is the one the market has taken so many times in recent weeks, and that idea should be respected here.This time does feel different, and if there is a decent bounce here it may lead to a strong OPEX shorting opportunity.
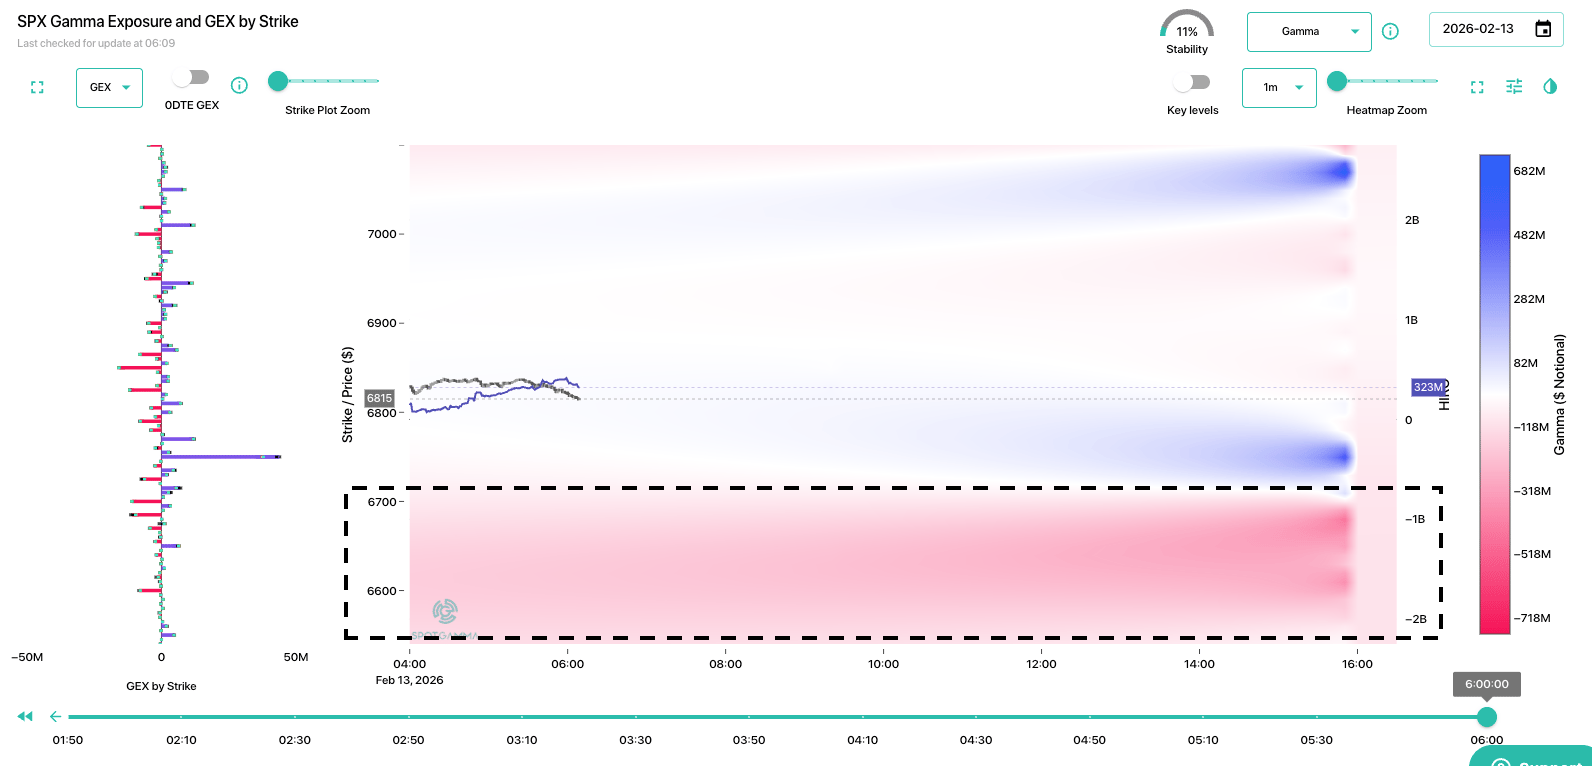
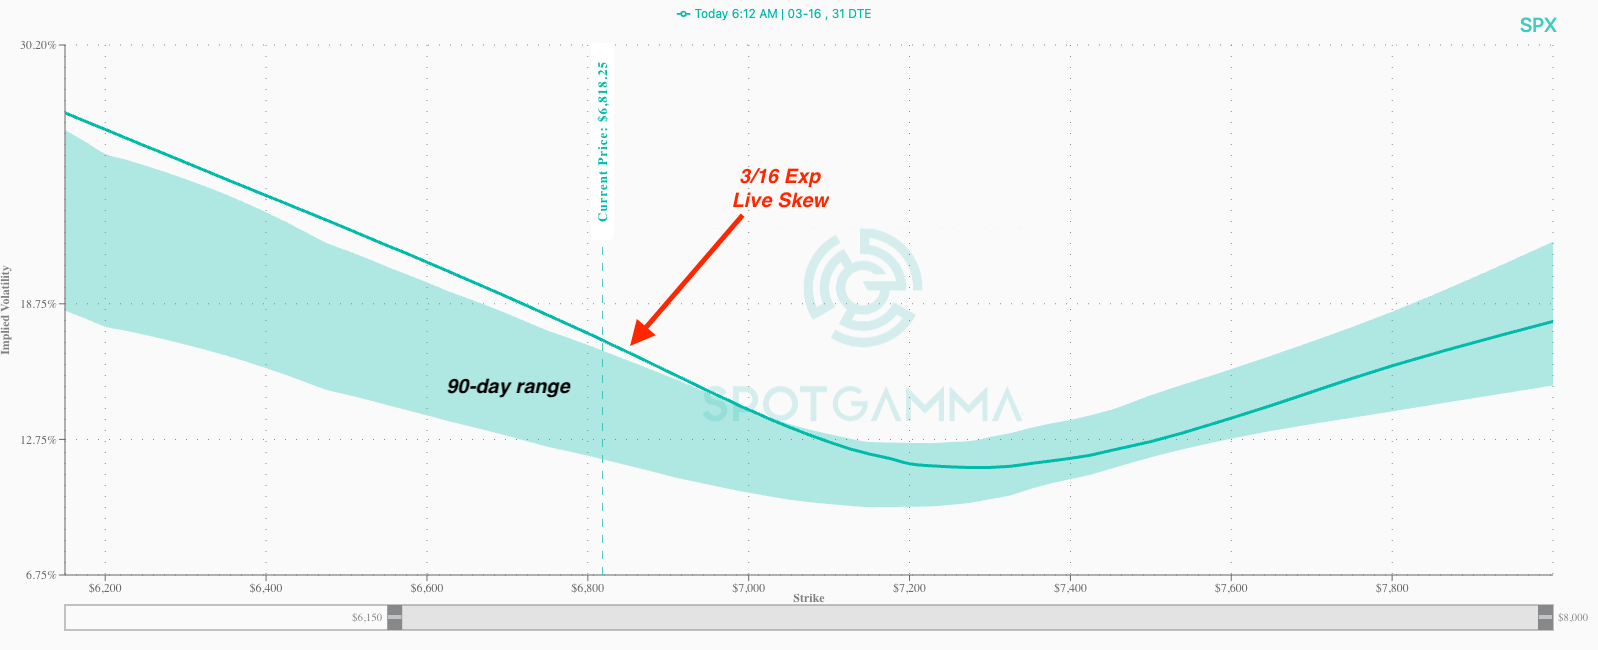
Why different? Because puts are bid, as you can see in the increasing SPX put skew. The put wing is now at the top of its 90-day range which is a sign of market maker downside stress. This is not armageddon, but it is “alert”. Should SPX slide down toward 6,600 we’d think these vols would jump ~5 points, and we’d see the VIX go from ~20 to 30. You may also note that call IVs are relatively quite low.
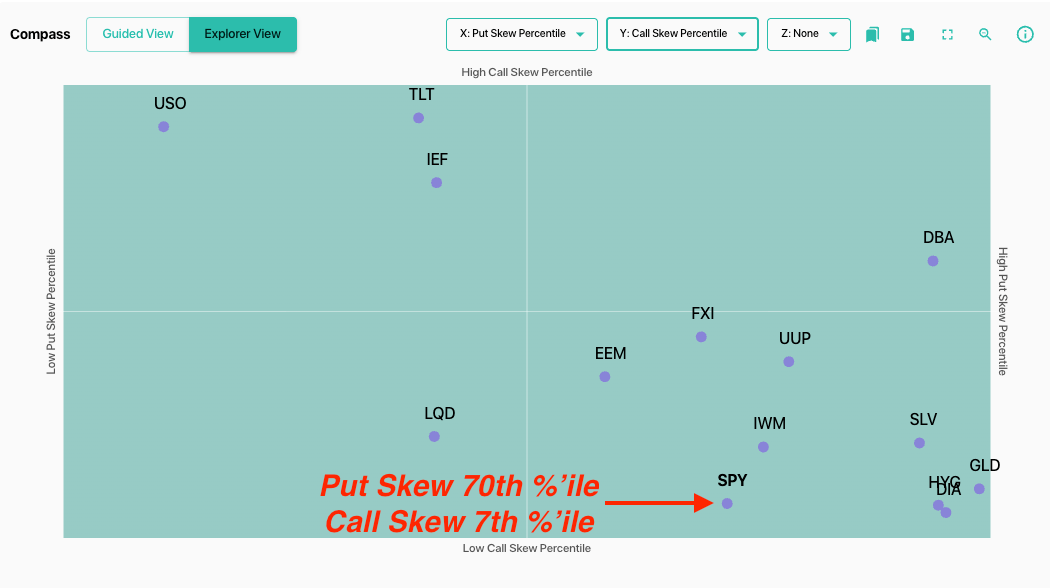
Placing this in more context, we set Compass set to Put Skew %’ile (Y) vs Call Skew %’ile (X). Put Skew is 70th, while Call Skew is only 7th. Further, IV Rank is only 17. This sums up to put hedges being added, but volatility not yet spiking. That put activity lays the groundwork for a big negative gamma, negative vanna decline. It’s the tinder for a big vol spike.
Seeing both sides, one could say “decent CPI lets traders slam that put wing, which pops stocks”. That’s true, but the only thing bullish for stocks right now are prospects of rate cuts.
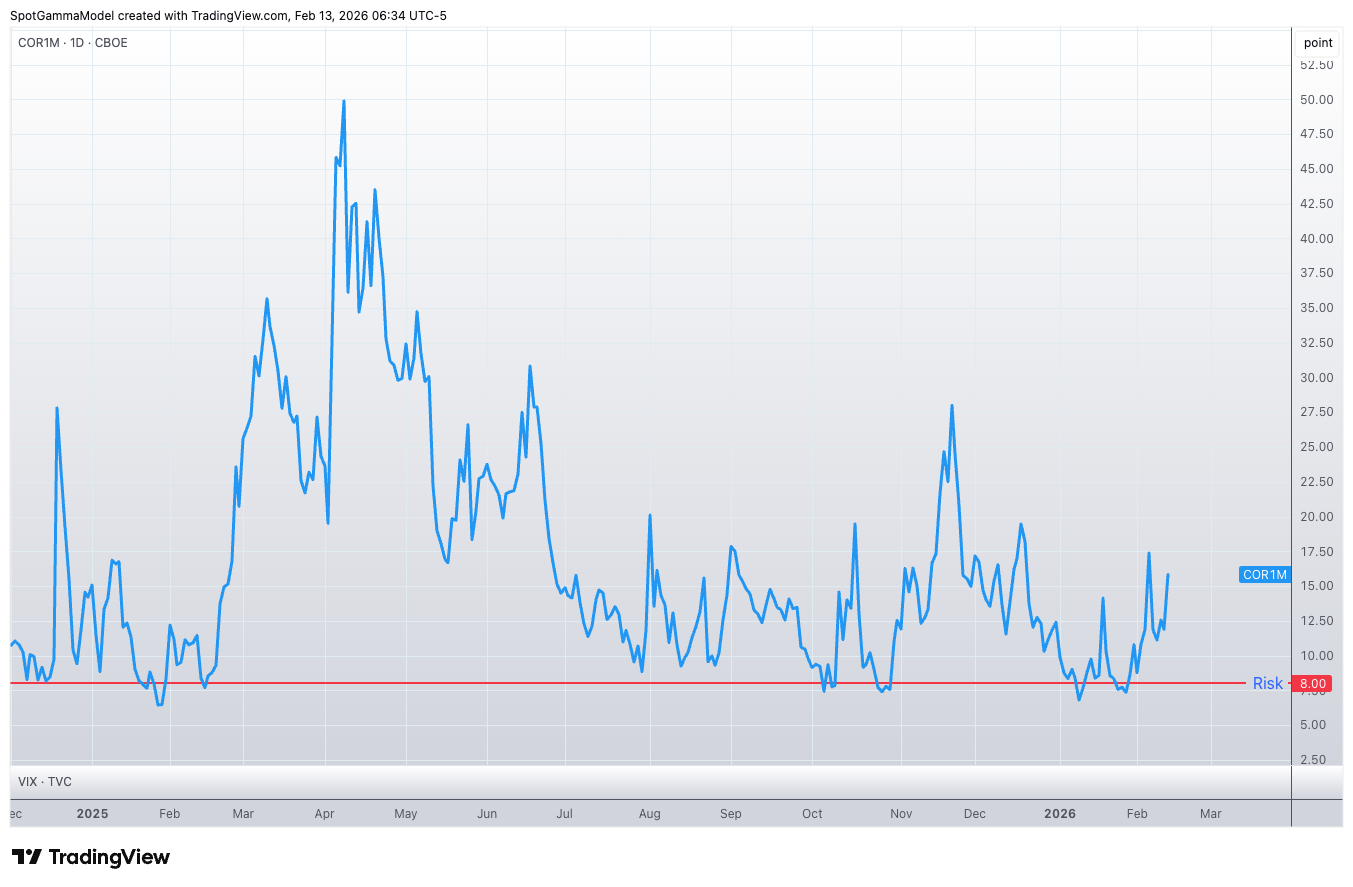
There is no equity sector space currently catching a bid. Software, the worst of it, was starting to bounce before U and APP earnings made OpenClaw “real”. The result of this is that correlation is starting to spike, which is an early signal of traders dumping stocks to roll into other assets. COR1M (below), shows that correlation is starting to lift – but like IV/VIX its only “alert” and not yet “freaking out”.
A last point on software stocks – we still think looking at short vol/put skew for names with upcoming earnings, as the +90 IV Ranks in the likes of CRM/INTU (for example) may allow you to sell, say, put flies at +3 months to expiration (or even farther out), and the earnings contraction may still allow short options structures to pay even if the stocks have ~20% further declines.
©2026 TenTen Capital LLC DBA SpotGamma
All TenTen Capital LLC DBA SpotGamma materials, information, and presentations are for educational purposes only and should not be considered specific investment advice nor recommendations. Futures, foreign currency and options trading contains substantial risk and is not for every investor. An investor could potentially lose all or more than the initial investment. Risk capital is money that can be lost without jeopardizing one’s financial security or lifestyle. Only risk capital should be used for trading and only those with sufficient risk capital should consider trading. Past performance is not necessarily indicative of future results. VIEW FULL RISK DISCLOSURE https://spotgamma.com/model-faq/disclaimer/
Market Recap
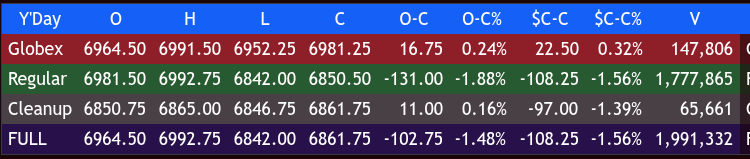
After the weak close and drop on Globex, the ES traded up to 6991.50 and opened Thursday’s regular session at 6981.50. After the open, the ES traded 6979.75, rallied up to 6992.75, sold off down to 6962.00 at 9:49, and rallied up to 6975.00 after the new home sales showed an 8% drop for January. It then sold back off down to 6960.25 at 10:05, one tick below the Globex low, rallied back above the VWAP at 6976.25 at 10:20, and sold off all the way down to 6873.25 at 11:30.
The ES rallied up to 6896.75 at 11:40, sold off to a new low at 6871.50 at 12:00, rallied up to 6894.00 at 12:35, then sold off down to a new low of 6862.50. It rallied up to 6872.25, sold off down to a lower low at 6859.75 at 1:15, rallied back up to 6891.50 at 1:45, sold off down to 6874.00 at 2:10, and rallied up to 6898.00 at 2:50.
The ES then sold off all the way down to 6841.75 after the 3:50 imbalance showed $4 billion to sell and traded 6850.50 on the 4:00 cash close. After 4:00, the ES traded up to 6866.00 and settled at 6851.00, down 109 points or -1.57%. The NQ settled at 24,768.00, down 520 points or -2.06%, the YM settled at 49,523, down 682 points or -1.36%, and the RTY settled at 2,621.10, down 54.50 points or -2.04% on the day.
To take a better look at the selloff, I broke down the up and down days, total points up or down, and percentage gains or losses. Clearly, there is a flight to quality: sell stocks and buy interest rates.
Market Performance Snapshot
In the end, as I said, I’m a pessimistic bull and said you can buy the gap downs and sell the gap ups, and yesterday was a gap up, double pump, and then straight down. In terms of the ES and NQ’s overall tone, it was deplorable; everything was down — gold, silver, bitcoin, and crude. In terms of the ES’s overall trade, volume was high at 1.993 million contracts traded.
Today, we will get a look at the CPI and the Friday week-two options expiration.
Upper Resistance & Retracements
Price
Indicator / Level
6,943.90
40-Day MA Cross
6,940.39
14-Day RSI (50%)
6,931.65
4-Week High Retrace (38.2%)
6,922.22
9-Day MA Cross
6,917.47
+1 Std Dev Resistance
Mid-Range & Pivot Levels
Price
Indicator / Level
6,897.25
50% Retrace (4-Week) / Raw Stochastic (50%)
6,895.25
Pivot Point
6,868.75
High
6,867.28
13-Week High Retrace (38.2%)
6,862.85
4-Week Low Retrace (38.2%)
6,856.25
40-Day MA Cross Stall
Current Price Action
Price
Status
6,855.75
Latest Price
6,851.00
Previous Close
6,840.25
Low
Immediate Support & Momentum
Price
Indicator / Level
6,838.95
Raw Stochastic (30%)
6,829.50
18-Day MA Cross Stall
6,826.67
Target Price
6,813.00
50% Retrace (13-Week)
6,812.11
3-10 Day MA Crossover Stall
6,809.80
Raw Stochastic (20%)
Deep Support Zones
Price
Indicator / Level
6,797.75
Pivot S1
6,784.53
-1 Std Dev Support
6,780.02
18-40 Day MA Cross
6,758.72
13-Week Low Retrace (38.2%)
6,757.00
-2 Std Dev Support
6,751.50
1-Month Low
6,744.50
Pivot S2
6,735.87
-3 Std Dev Support
MiM
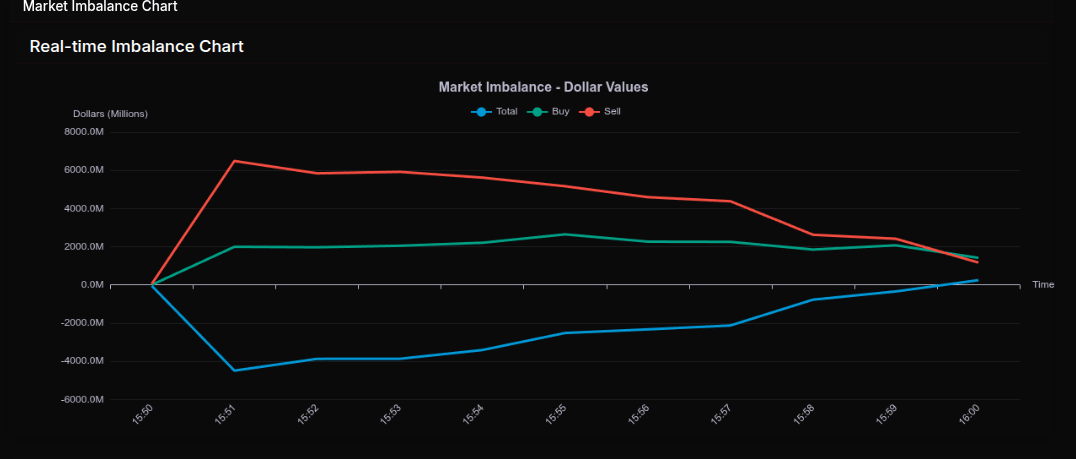
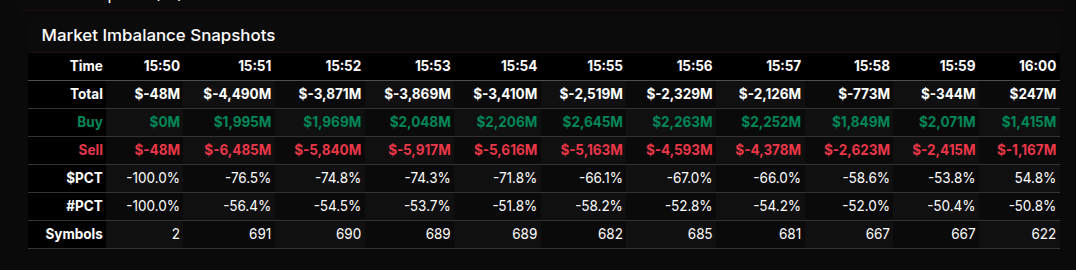
Market-On-Close Recap
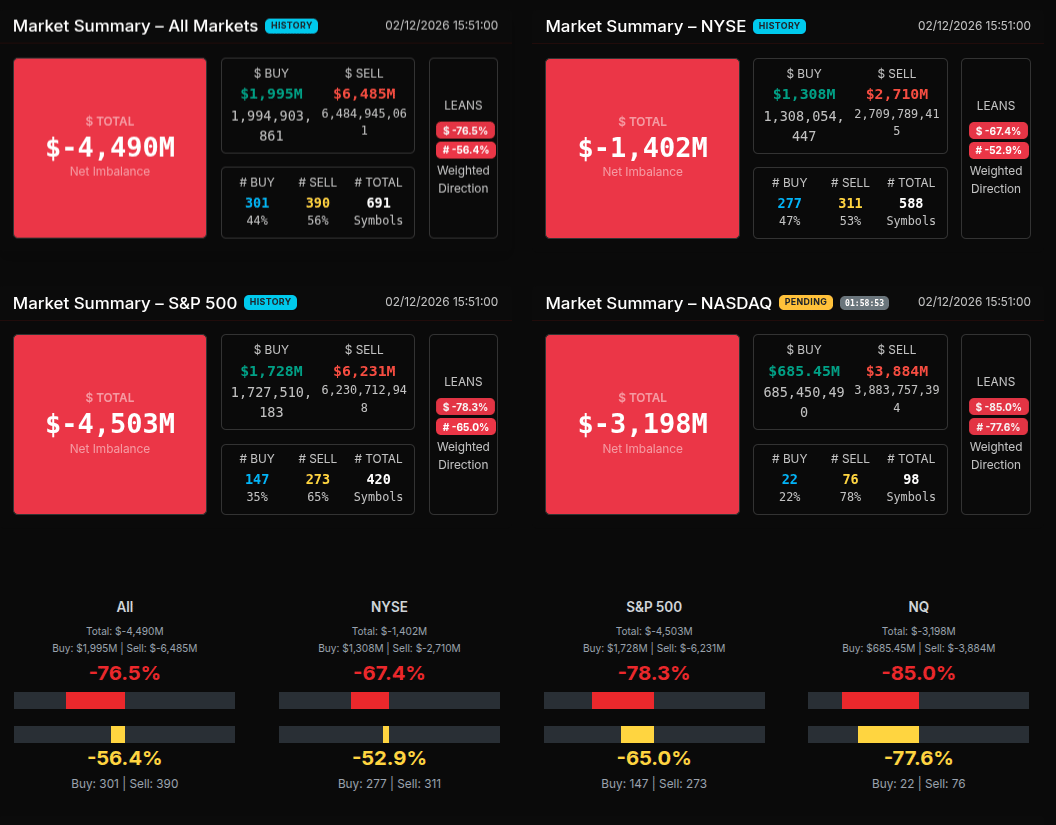
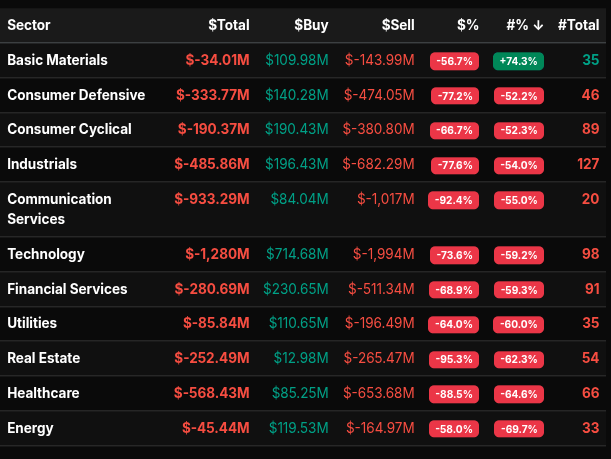
The February 12th MOC opened with a heavy sell bias and stayed pressured for most of the imbalance window before flipping late into the close. At 15:50, the market showed a modest -$48M sell imbalance, but within one minute expanded aggressively to -$4.49B, signaling broad institutional supply hitting the tape. From 15:51 through 15:57, total imbalance held between roughly -$3.8B and -$2.1B, with $PCT readings consistently worse than -66%, confirming wholesale selling rather than simple rotation.
By 15:58 and 15:59, the pressure began to moderate (-58.6% and -53.8%), shifting from outright liquidation toward a more rotational tone. The final print flipped to +$247M with a +54.8% reading, a late buy program into the bell that absorbed a large portion of the earlier supply.
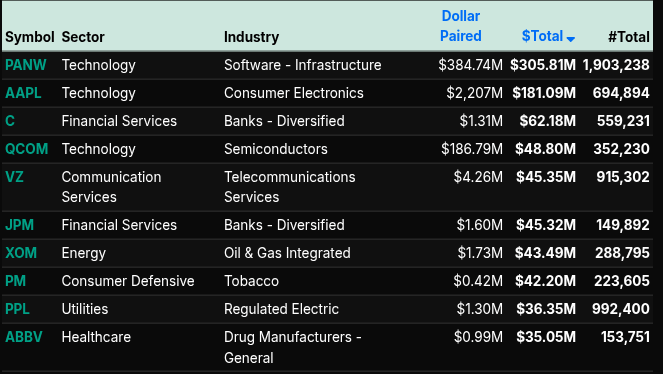
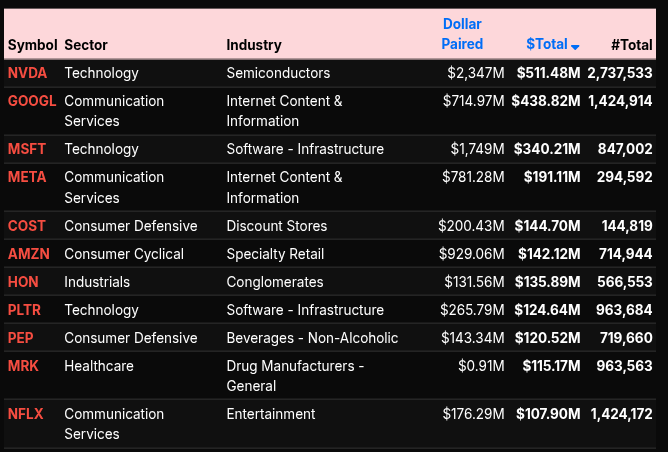
Sector flows were decisively negative. Communication Services (-92.4%), Real Estate (-95.3%), Healthcare (-88.5%), Consumer Defensive (-77.2%), and Industrials (-77.6%) all showed readings beyond -66%, marking broad-based institutional distribution. Technology finished -73.6% and Financials -68.9%, reinforcing that this was not isolated weakness but systemic selling across major groups. Utilities (-64.0%) and Energy (-58.0%) leaned sell but were more rotational in nature.
On the symbol level, the largest sell imbalances were concentrated in mega-cap technology and communication names. NVDA (-$511M), GOOGL (-$438M), MSFT (-$340M), and META (-$191M) led the downside. AMZN, HON, PLTR, PEP, MRK, and NFLX also showed meaningful sell pressure. On the buy side, defensive and infrastructure-related names provided partial offset: PANW (+$305M), AAPL (+$181M), JPM (+$45M), VZ (+$45M), XOM (+$43M), and ABBV (+$35M).
Overall, the MOC reflected aggressive institutional selling across growth and cyclical sectors, with a modest defensive rotation and a late closing buy program that improved the optics but did not erase the day’s dominant sell-side character.
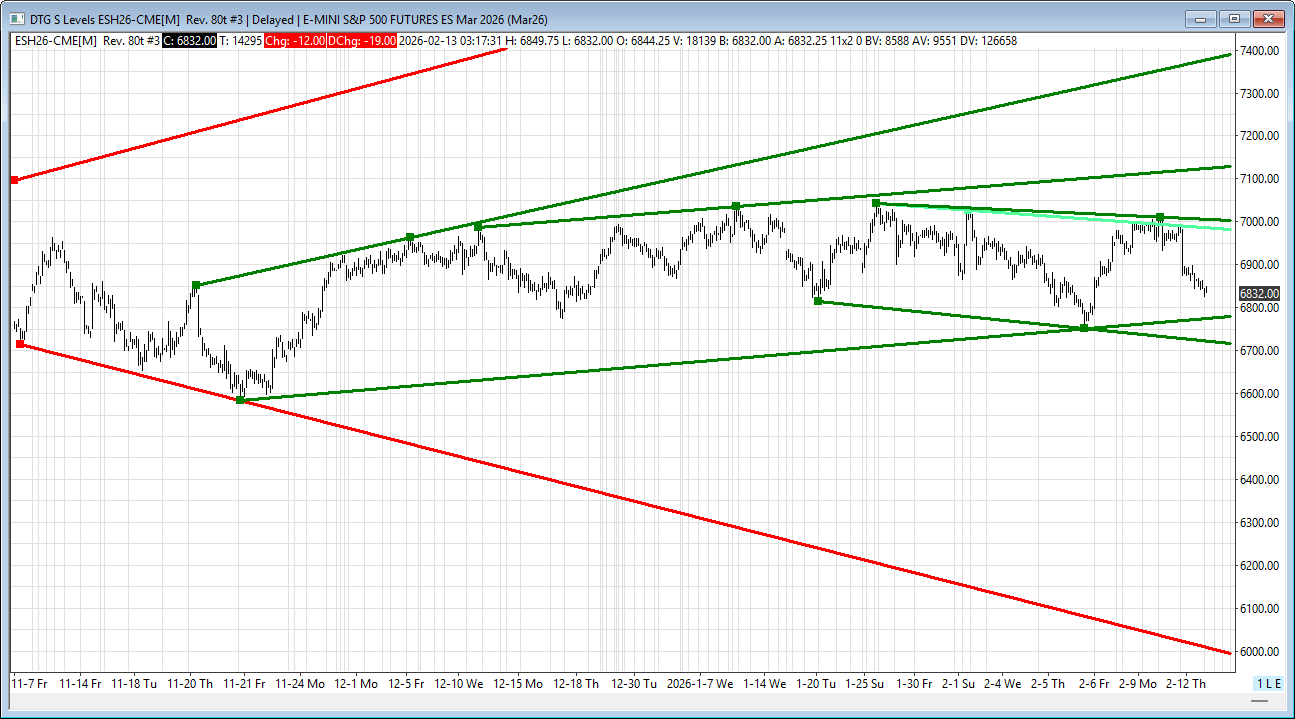
ES Levels
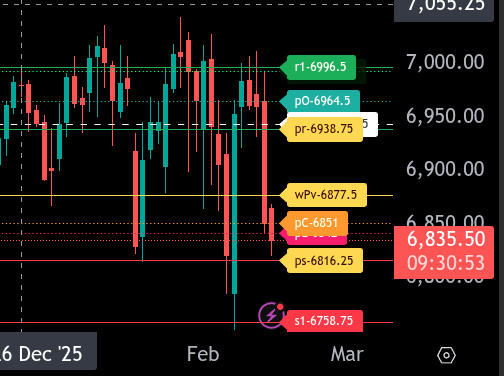
The bull/bear line for the ES is at 6877.50. This is the key pivot for today’s trade. Acceptance above this level shifts the tone back toward recovery, while continued trade below it keeps pressure on the downside.
ES is currently trading around 6835.00, well below the bull/bear line and under prior value support. As long as price remains below 6877.50, rallies are likely to be sold. Immediate resistance comes in at 6842.00, then 6851.00. A push into 6877.50 is the major decision zone. If reclaimed and held, upside targets expand toward 6938.75 and 6964.50, with 6992.75 to 6996.50 as the upper range objective.
On the downside, first support sits at 6816.25. A break and acceptance below opens the door to 6758.75. Failure there would signal a broader liquidation phase and shift the structure decisively bearish.
Overall, the market is trading heavily below 6877.50. Bulls need sustained trade back above that level to regain control. Until then, rallies into resistance should be treated cautiously, and downside continuation remains the higher probability path.
NQ Levels
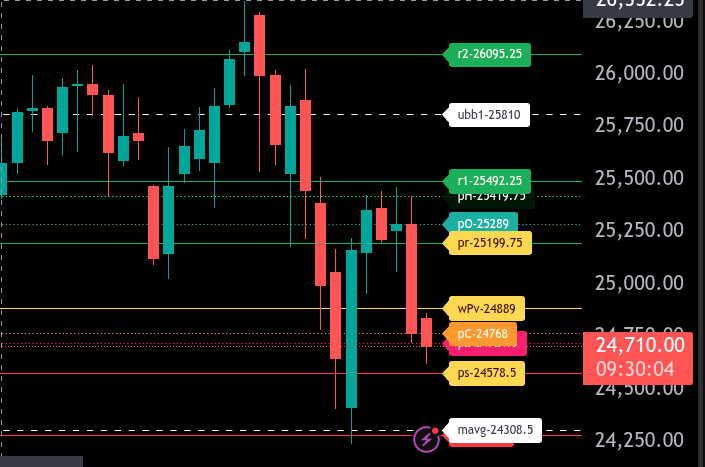
The bull/bear line for the NQ is at 24,889.00. This is the key level that must be reclaimed to shift short-term sentiment back to bullish. As long as price remains below this level, rallies are likely to be sold.
NQ is currently trading around 24,707.50, firmly below the bull/bear line and below the 25,199.75 resistance zone. If price continues to hold below 24,889.00, downside pressure can extend toward 24,578.50, which is today’s lower range target. A break and acceptance below 24,578.50 opens the door to 24,286.00 as the next structural support.
On the upside, initial resistance comes in at 24,768.00, followed by 24,889.00. If buyers can reclaim and hold above 24,889.00, a squeeze toward 25,199.75 becomes likely, which is the upper range target for today. Above that, 25,419.75 and 25,492.25 are the next resistance areas.
Overall, the tone remains bearish below 24,889.00. Bulls need sustained trade back above this level to regain control; otherwise, rallies into resistance are opportunities for sellers.
Technical Edge
Fair Values for February 13, 2026
-
SP: 16.68
-
NQ: 71.79
-
Dow: 70.8
Daily Breadth Data 📊
For Thursday, February 12, 2026
• NYSE Breadth: 27% Upside Volume
• Nasdaq Breadth: 27% Upside Volume
• Total Breadth: 27% Upside Volume
• NYSE Advance/Decline: 31% Advance
• Nasdaq Advance/Decline: 27% Advance
• Total Advance/Decline: 28% Advance
• NYSE New Highs/New Lows: 370 / 134
• Nasdaq New Highs/New Lows: 321 / 372
• NYSE TRIN: 1.19
• Nasdaq TRIN: 0.98
Weekly Breadth Data 📈
Week Ending Friday, February 6, 2026
• NYSE Breadth: 55% Upside Volume
• Nasdaq Breadth: 50% Upside Volume
• Total Breadth: 52% Upside Volume
• NYSE Advance/Decline: 61% Advance
• Nasdaq Advance/Decline: 44% Advance
• Total Advance/Decline: 50% Advance
• NYSE New Highs/New Lows: 548 / 184
• Nasdaq New Highs/New Lows: 678 / 809
• NYSE TRIN: 1.27
• Nasdaq TRIN: 0.81
Calendars
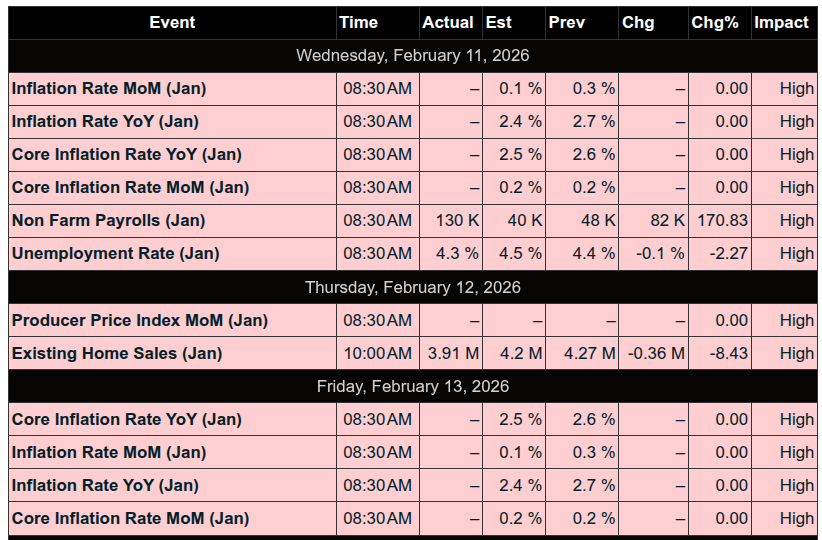
Economic Calendar Today
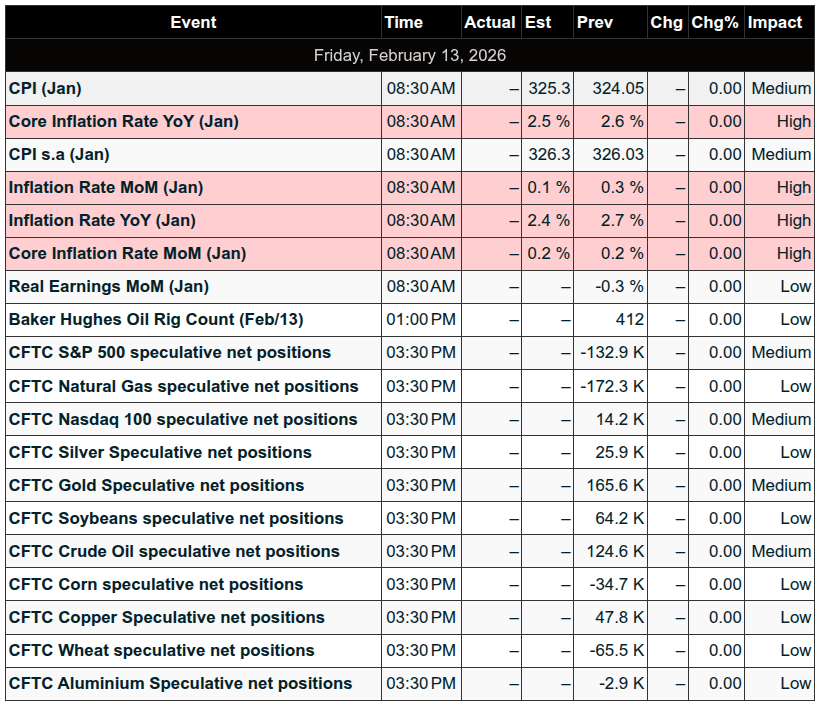
This Week’s High Importance
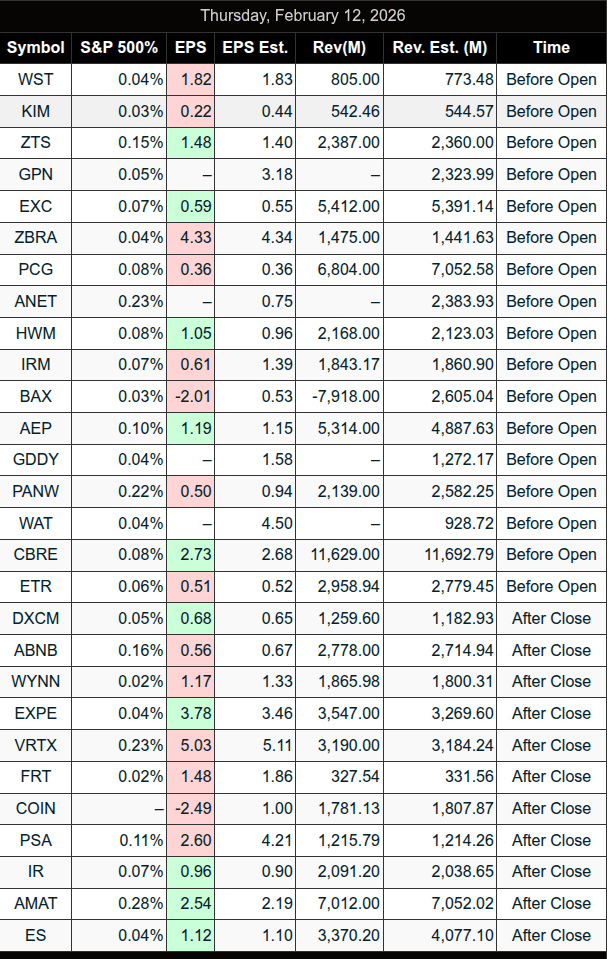
S&P 500 Earnings:
Upcoming:
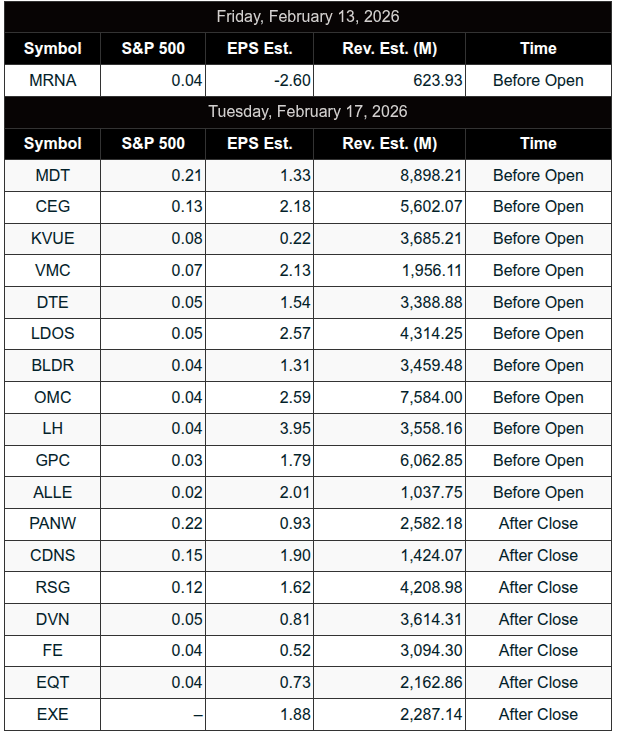
Recent:
Trading Room News:
Polaris Trading Group Summary – For Thursday, February 12, 2026
The session unfolded as a textbook Cycle Day 2 (CD2)—with early structure, sharp liquidation, and valuable lessons in patience, alignment, and risk control. PTGDavid guided the room closely, reinforcing process over prediction throughout the day.
Pre-Market Framework
The day began with a clear, disciplined roadmap from PTGDavid:
-
Cycle Day 2 Objective
-
Optional back-test of the Cycle Day 1 low (6862.50)
-
Hold support
-
Rebuild upside momentum toward 6938–6959
-
-
Expectations Set
-
CD2 favors balance, consolidation, and digestion, not aggressive expansion
-
Bulls needed acceptance above 6895 ±5
-
Bears favored acceptance below that same zone
-
This preparation proved critical as volatility picked up.
Morning Action – Breakdown & Liquidation
-
Early acceptance lower led to long liquidation, confirmed by:
-
Heavy volume on downswings
-
Rotation behavior instead of clean trend
-
-
PTGDavid identified DLMB / Cycle Violation Level reversal zones, offering “long lean” opportunities for those aligned with structure and managing risk tightly.
-
Macro uncertainty and discussion around possible distribution kept expectations realistic.
Key theme introduced:
“Today’s theme >>> Long Liquidation”
Standout Trade
One of the day’s highlights came from Manny:
-
Executed a support buy at 6801–6805
-
Scaled effectively for +22 points
-
Recovered an early loss and finished firmly green
PTGDavid praised the execution as well planned and well played.
This trade exemplified:
-
Patience
-
Trust in statistical levels
-
Proper sizing and exits
Midday – Stabilization Attempt
-
Price stabilized around the IB Low (approximately 6805) and OPR Low (approximately 6831)
-
Bulls managed a push back toward mid-VWAP and the neutral zone
-
PTGDavid noted solid buy responses from Deep Cycle Day 2 Statistical Violation Zones
-
Long inventory was repriced at more favorable levels
Afternoon & Close – Risk Off
-
Despite a $300M MOC buy imbalance, selling pressure persisted
-
Bulls failed to regain control
-
Market closed near the lows:
-
Back into Cycle Day 2 lower statistical violation levels (around 6813)
-
Clear risk-off tone
-
Continued long liquidation across correlated markets
-
Key Takeaways
-
Cycle rules mattered, with Cycle Day 2 behavior playing out as expected
-
Statistical levels provided objective trade locations
-
Risk management and hard stops protected capital
-
Alignment with the dominant force remained more important than bias or prediction
DTG Room Preview – Friday, February 13, 2026
Morning Market Brief
-
Holiday Notice: U.S. markets closed Monday, February 16 (Presidents’ Day). Trading resumes Tuesday.
-
Today’s Focus: CPI at 8:30am ET (delayed release). Expect volatility around the number.
Macro / Policy
-
Energy Policy:
-
Trump administration repealed federal tailpipe emissions standards.
-
Energy stocks rallied on deregulation momentum.
-
Repeal currently does not apply to power plants (yet).
-
-
Tariffs:
-
NY Fed report: ~90% of tariff burden falling on U.S. companies/consumers.
-
Similar findings previously reported by CBO.
-
Canada tariff referendum expected in Senate; Mexico and Brazil referendums lining up in House.
-
-
Epstein Fallout:
-
Larry Summers resigned from OpenAI board.
-
Goldman Sachs’ top lawyer Kathy Ruemmler resigned.
-
GS fell >4% Thursday.
-
Earnings
-
Premarket: ENB, MGA, MRNA, NWG, TRP, WEN
-
Tuesday AM: ALLE, BLDR, CNH, CEG, DTE, ET, GMAB, GPC, DVUE, LH, LDOS, MDT, OMC, SUN, VMC, WSO
ES Technicals
-
Volatility: 5-day ADR steady at 114.75
-
Positioning: Whale bias short into CPI on lighter overnight volume
-
Trend:
-
Back inside short-term downtrend channel
-
Closed well below 50-day MA (6936) → short-term bearish tone
-
Resistance (TL Rs):
-
7005/00s
-
7124/49s
-
7390/95s
Support (TL Ss):
-
6775/80s (intermediate uptrend channel bottom)
-
6719/14s (short-term downtrend channel bottom)
-
Below 6719/14s opens path toward 200-day MA (6617).
-
Bulls still have room structurally — CPI likely dictates next directional move.
Affiliate Disclosure: This newsletter may contain affiliate links, which means we may earn a commission if you click through and make a purchase. This comes at no additional cost to you and helps us continue providing valuable content. We only recommend products or services we genuinely believe in. Thank you for your support!
Disclaimer: Charts and analysis are for discussion and education purposes only. I am not a financial advisor, do not give financial advice and am not recommending the buying or selling of any security.
Remember: Not all setups will trigger. Not all setups will be profitable. Not all setups should be taken. These are simply the setups that I have put together for years on my own and what I watch as part of my own “game plan” coming into each day. Good luck!!
Follow @MrTopStep on Twitter and please share if you find our work valuable!
This post goes out as an email to our subscribers every day and is posted for free here around 2 PM ET. To get your real-time copy, sign up for the free or premium version here: Opening Print Subscribe.
Comments are closed