This post goes out as an email to our subscribers every day and is posted for free here around 2 PM ET. To get your real-time copy, sign up for the free or premium version here: Opening Print Subscribe.
Snowed in. Blizzard of 2026
Follow @MrTopStep on Twitter and please share if you find our work valuable!
Our View
There Is A Storm Brewing Out There
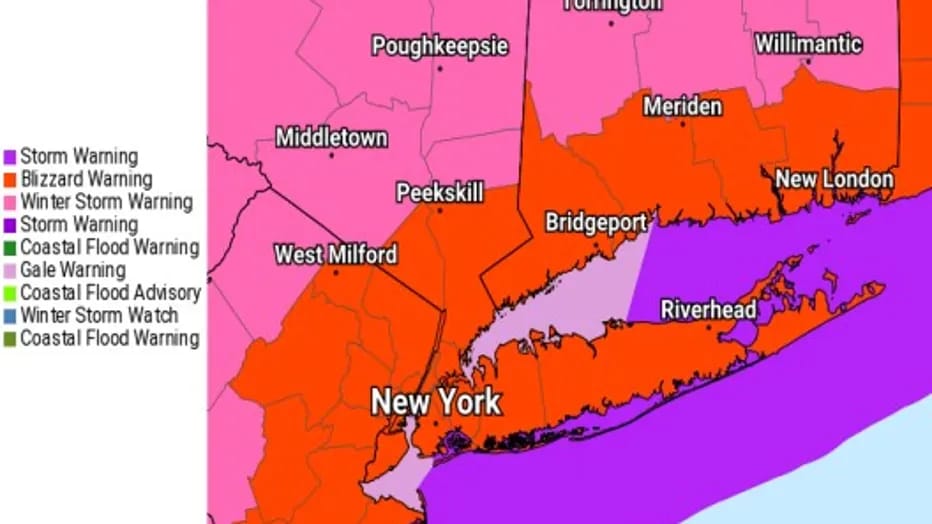
A blizzard warning has been issued for New York City, Long Island, and parts of New Jersey, Connecticut, Massachusetts, and Maine. Snowfall totals of 12–24 inches are expected, with some areas locally seeing up to 2 feet. Snowfall rates could reach 1–3 inches per hour, along with wind gusts of 50–60+ mph, causing whiteout conditions.
The heaviest snow is expected Sunday night into Monday morning. Mayor Zohran Mamdani has issued a travel ban from 9 pm Sunday to noon Monday and closed schools on Monday. Governor Kathy Hochul has declared a state of emergency and activated the National Guard.
Expect major travel disruptions and possible power outages. Stay home and monitor the National Weather Service and New York City Emergency Management for updates.
Our View
It’s going to be another week of shake, rattle, and roll. Between the blizzard heading to the East Coast, economic reports, Fed speak, earnings, Treasury auctions, and NVDA on Wednesday, there’s a lot on the table.
Is the S&P going up this week? There are so many unpredictable factors like news flow, geopolitics, and surprises in data and earnings. But based on some analyst views and forecasts, it sounds like the near-term leans are cautiously mixed to slightly bullish, with continued elevated volatility.
Our Lean
If you are one of the believers in insider trading, Howard Lutnick, the current Secretary of Commerce and former head of Cantor Fitzgerald, which is now run by his two sons, Brandon and Kyle Lutnick, as per a fresh 13F filing reported Feb 22, 2026, bought $126 million of AI stocks.
Mon Dec 22, 2025: Close 6930.25 — Up (from Dec 19 close 6796.54; strong +134 points)
Mon Dec 29, 2025: Close 6955.00 — Down (from Dec 26 close 6979.25)
Mon Jan 5, 2026: Close 6943.75 — Up (from Jan 2 close 6900.50)
Mon Jan 12, 2026: Close 7016.50 — Up (from Jan 9 close 7005.00)
Mon Jan 19, 2026: No trading (MLK Day holiday)
Mon Jan 26, 2026: Close 6981.25 — Up (from Jan 23 close,945.75)
Mon Feb 2, 2026: Close 7002.50 — Up (from Jan 30 close 6965.75)
Mon Feb 9, 2026: Close 6983.25 — Up (from Feb 6 close 6952.75)
The markets can run but not hide. That said, Mondays have not been a bad day for the ES and have been up 5 of the last 6. After closing on the highs on Friday, I continue to point out that the gaps have been very tradeable.
Our lean: If the ES were to gap higher, I would be looking to sell the open or the first rally above (double pump), but again, I am a pessimistic bull. If there is a big gap down, I would look to buy the open or the pullback under the gap down.
I don’t want to set any targets because things continue to be extremely fluid and subject to headline news. One of my MrTopStep trading rules says, “The ES tends to go sideways to lower after a big up day,” so let’s see how this pans out. Just off the top of my head, 6850 is a big area, and below that 6820.00.
Resistance / Upside
Support / Downside
6,972.10
6,922.78
6,964.04
6,906.86
6,961.00
6,900.67
6,954.08
VAH → 6,897.31
6,952.09
6,897.25
6,944.52
6,894.41
6,944.37
6,889.38
6,941.58
VAL → 6,882.46
6,931.65
6,877.00
6,931.50
6,873.30
6,926.56
6,869.83
Current POC → 6,923.25
6,867.28
6,862.85
6,847.25
6,835.00
6,821.50
Morgan Stanley Issues Sharp Take On The Stock Market

A Bloomberg interview last week arguing that the recent sell-off has been “indiscriminate” rather than selective. Investors are broadly dumping AI-linked stocks without distinguishing strong performers from weaker ones (“not separating the wheat from the chaff”), driven by fears over AI impacts—but this overlooks key shifts.
Core Takeaways from the “Sharp Take”
-
The market is missing the transition from AI builders/enablers (e.g., hyperscalers) to AI adopters (companies embedding AI for real productivity/margin gains).
-
We’re still early in a potential massive $10 trillion AI-driven capital-spending cycle, with adopters seeing faster margin expansion than benchmarks like the S&P 500.
-
The sell-off isn’t fundamentally justified for quality names; it’s more panic-driven.
Broader Morgan Stanley Outlook (Bullish Tilt)
-
Chief U.S. Equity Strategist Mike Wilson maintains a bullish 12-month view for 2026, with an S&P 500 target of 7,800 (implying solid upside from recent levels around ~6,900–6,923).
-
This assumes ~17% earnings growth in the coming year, modest valuation contraction, and a broadening recovery (including low-quality/profitless growth stocks potentially rallying hardest).
-
Other MS views (e.g., Andrew Slimmon) describe the market as late-cycle but not end-of-cycle, with the bull market having room to run despite AI disruption fears.
-
Overall Wall Street 2026 S&P targets range from ~7,100 (more cautious) to 7,800+ (Morgan Stanley’s stands out as optimistic).
In short: Morgan Stanley sees the recent dip as an overreaction/mistake by the market, with the real opportunity in AI adoption plays and a continued bullish setup for equities into 2026—though near-term volatility from data, earnings (like NVDA this week), and macro remains high.
Market Recap
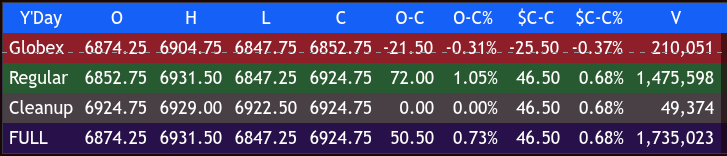
The ES traded up to 6904.75, sold off down to 6847.50 and traded 6852.75, down 25.5 points or -0.37%. We knew this was going to be a volatile day, and it didn’t let down, as Q4 2025 GDP slowed to 1.4% (missing the 2.5% forecast), largely due to the government shutdown. Simultaneously, inflation proved sticky, with Core PCE rising to 3.0% YoY. This combination of stagnant growth and hot prices likely forces the Fed to remain hawkish, keeping near-term rate cuts off the table.
After the open, the ES sold off down to 6847.25, rallied up to 6884.00 at 9:40, pulled back to 6864.00, and then rallied up to 6925.00 at 10:00 after the US Supreme Court struck down President Donald Trump’s sweeping global tariffs imposed under the International Emergency Economic Powers Act (IEEPA) of 1977. In a 6-3 decision authored by Chief Justice John Roberts (joined by Justices Barrett, Gorsuch, and the three liberal justices), the Court held that IEEPA does not authorize the President to unilaterally impose tariffs, as this would intrude on Congress’s constitutional authority over taxation and commerce.
After the rip, the ES sold off down to 6872.200. It then rallied up to a lower high at 6923.50 at 11:00. The ES sold off down to a higher low at 6889.25 at 11:30 and rallied up to another lower high at 6922.75. It then sold off down to 6871.00 at 12:25 and rallied back up to 6909.00 at 1:05, just before Trump went live (always late). The ES sold off down to 6887.25 at 1:15 and rallied up to 6931.00 at 1:43. It then sold off down to 6908.75 at 2:49 (slow walk selling).
The ES rallied up to 6924.25 at 3:09, then sold back off down to 6912.00 at 3:22. It rallied 10 points and traded 6918.00 as the 3:50 cash imbalance showed $1.4 billion to buy, traded up to 6926.25, and traded 6924.75 on the 4:00 cash close.
After 4:00, the ES traded up to 6929.25 at 4:05 and settled at 6923.25, up 46.25 points or +0.67%. The NQ settled at 25,067.50, up 208.75 points or +0.84%, the YM settled at 49,647, up 216 points or +2.16%, and the RTY settled at 2,641.10, down 0.30 point or 0.01% on the day.
In the end, the market giveth and the market taketh it away. In terms of the ES and NQ’s overall tone, the down open was a big buy op. In terms of the ES’s overall trade, volume was higher at 1.739 million contracts traded.
It doesn’t really matter what the cause of Friday’s rally was, but the ES rallied 87 points off its 6847.25 low and closed above the big figure of 6900.00, the first close above this level in 7 sessions. Was it the economic numbers? I think not. Was it the gap down and everyone being too short? I think that was part of it, but I think the main driver was the options expiration and the short gamma positions.
This Week’s Major U.S. Economic Reports & Fed Speakers
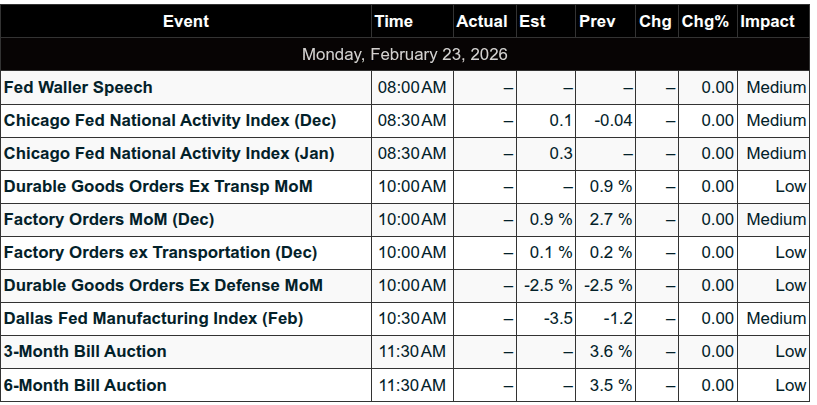
Mon Feb 23
08:00 Waller (Fed)
10:00 Factory Orders
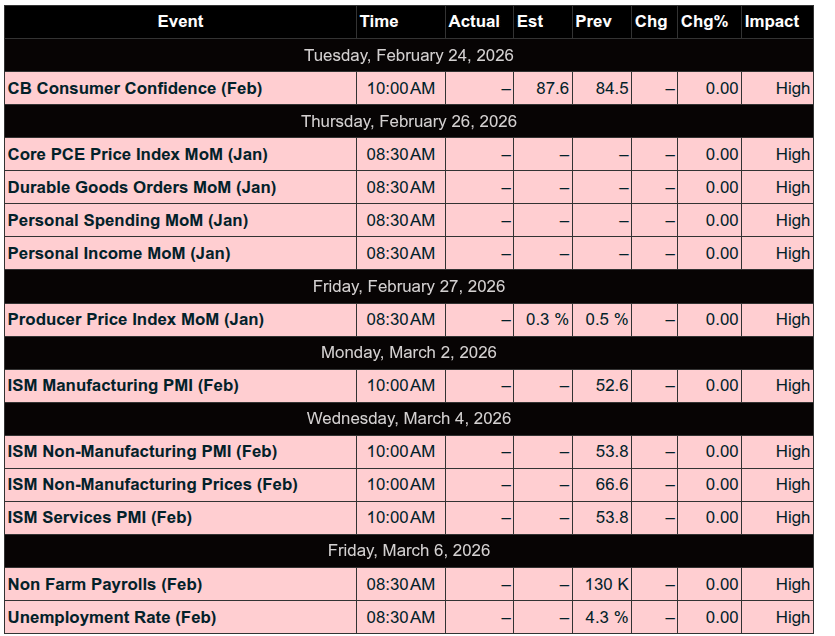
Tue Feb 24
08:00 Goolsbee (Fed)
09:00 Case-Shiller | Bostic (Fed)
09:15 Waller (Fed)
09:30 Cook (Fed)
10:00 Wholesale Inventories + Consumer Confidence
Home Depot (HD) earnings
2Y Note auction ($69B)
Wed Feb 25
Before open: Lowe’s (LOW)
09:35 Barkin (Fed)
11:00 Schmid (Fed)
5Y Note auction ($70B)
After close: Nvidia (NVDA), Salesforce (CRM)
Thu Feb 26
08:30 Jobless Claims
Fri Feb 27
08:30 PPI + Core PPI
09:45 Chicago PMI
10:00 Construction Spending

MiM
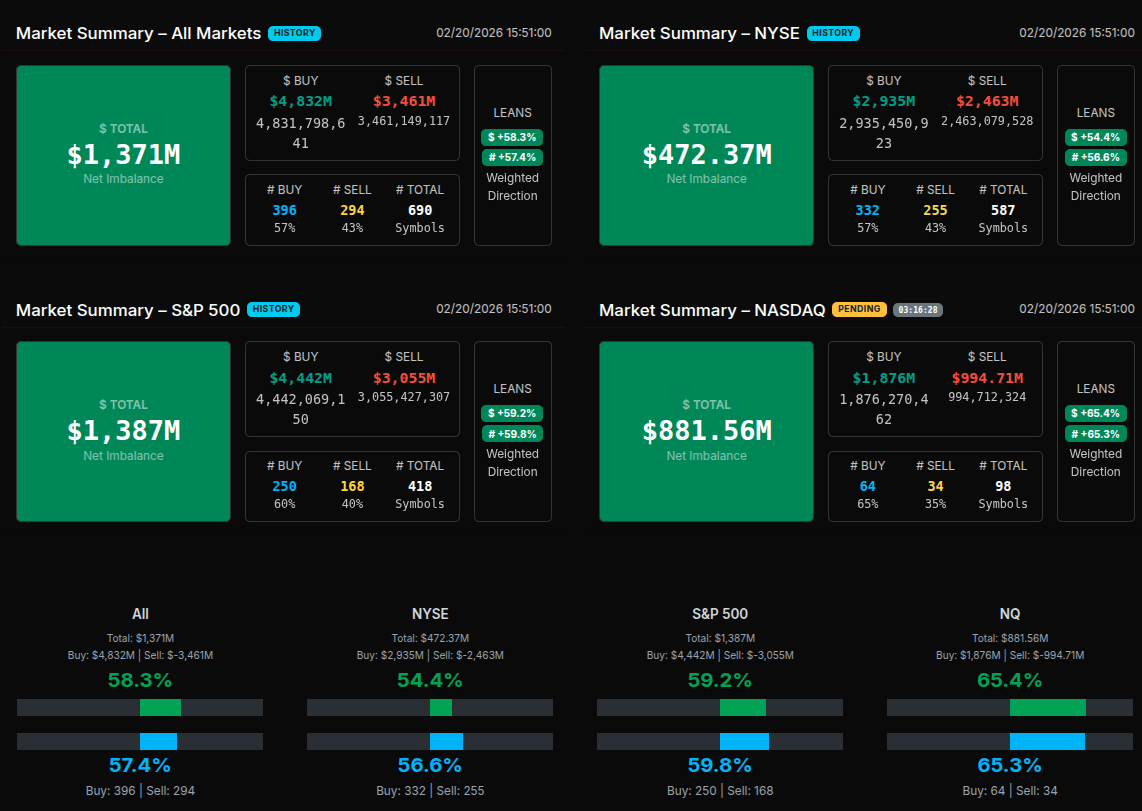
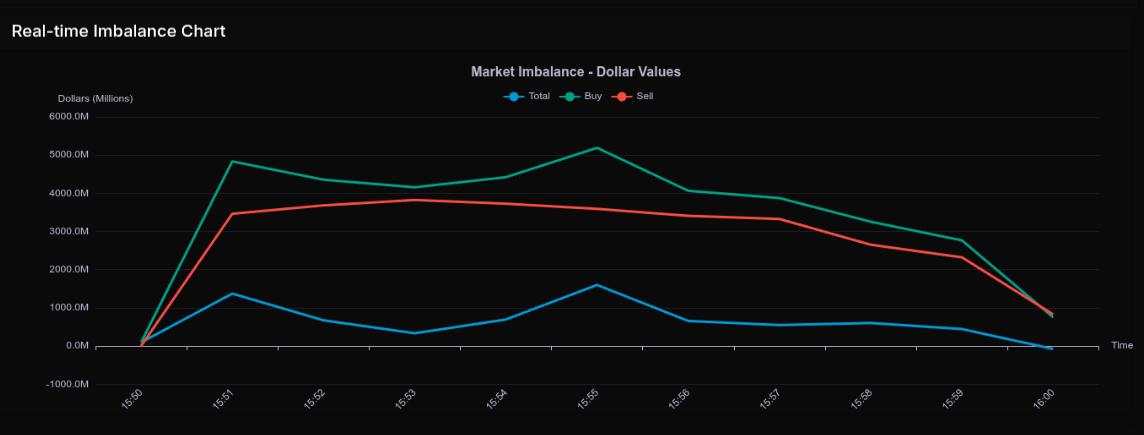
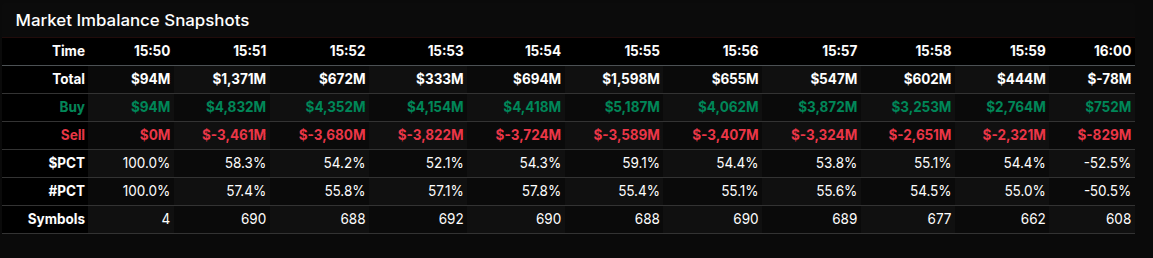
The February 20th MOC session opened with a firm bid and built steadily into the 15:55 snapshot before fading sharply into the 16:00 print. At 15:50, the market showed a modest $94M buy imbalance, but by 15:51 that expanded aggressively to $1.37B net buy, driven by $4.83B of buy orders versus $3.46B for sale. From there, the tape rotated but held a constructive tone, peaking at 15:55 with $1.59B to buy. Into the close, however, buy pressure evaporated and the final snapshot flipped to a $78M sell imbalance, with -52.5% dollar lean, reflecting a late offset.
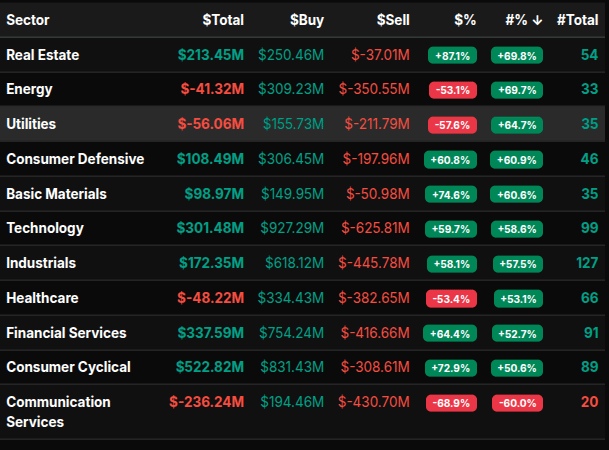
Sector flows were broadly constructive. Real Estate led with an +87.1% lean, indicating a wholesale-style buy program. Basic Materials (+74.6%) and Consumer Cyclical (+72.9%) also showed strong institutional demand. Communication Services stood out on the sell side at -68.9%, a notable wholesale sell imbalance. Energy (-53.1%), Utilities (-57.6%), and Healthcare (-53.4%) reflected more rotational selling pressure rather than outright liquidation, given their proximity to the 50% threshold.
Technology posted $301M to buy with a +59.7% lean, firmly positive but rotational. Financials were similar at +64.4%, while Industrials printed +58.1%. The strongest index-level pressure came from Nasdaq, which leaned +65.4%, just shy of the 66% wholesale threshold, suggesting aggressive growth buying into the bell.
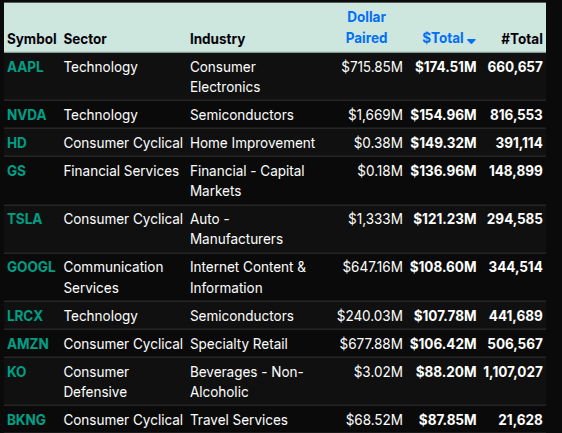
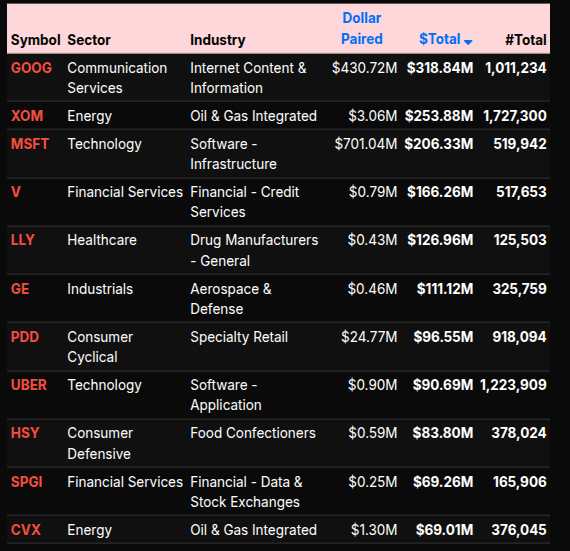
On the symbol level, the largest buy imbalances included MSFT ($206M), AAPL ($174M), NVDA ($155M), and GS ($137M). Consumer names like HD ($149M), TSLA ($121M), and AMZN ($106M) reinforced the cyclical bid. On the sell side, GOOG showed a sizable paired imbalance but net selling pressure, while energy heavyweights XOM and CVX also saw distribution.
Overall, the MOC reflected broad-based accumulation across cyclicals and tech, partially offset by targeted selling in Communication Services and defensive areas, before a late imbalance flip into the closing print.
Technical Edge
Fair Values for February 23, 2026
-
SP: 12.42
-
NQ: 53.38
-
Dow: 38.42
Daily Breadth Data 📊
For Friday, February 20, 2026
• NYSE Breadth: 61% Upside Volume
• Nasdaq Breadth: 53% Upside Volume
• Total Breadth: 54% Upside Volume
• NYSE Advance/Decline: 60% Advance
• Nasdaq Advance/Decline: 53% Advance
• Total Advance/Decline: 55% Advance
• NYSE New Highs/New Lows: 168 / 50
• Nasdaq New Highs/New Lows: 199 / 176
• NYSE TRIN: 0.94
• Nasdaq TRIN: 1.01
Weekly Breadth Data 📈
For Week Ending February 20, 2026
• NYSE Breadth: 55% Upside Volume
• Nasdaq Breadth: 56% Upside Volume
• Total Breadth: 55% Upside Volume
• NYSE Advance/Decline: 59% Advance
• Nasdaq Advance/Decline: 56% Advance
• Total Advance/Decline: 57% Advance
• NYSE New Highs/New Lows: 404 / 116
• Nasdaq New Highs/New Lows: 407 / 492
• NYSE TRIN: 1.19
• Nasdaq TRIN: 1.00

Today’s BTS Levels:
ES H
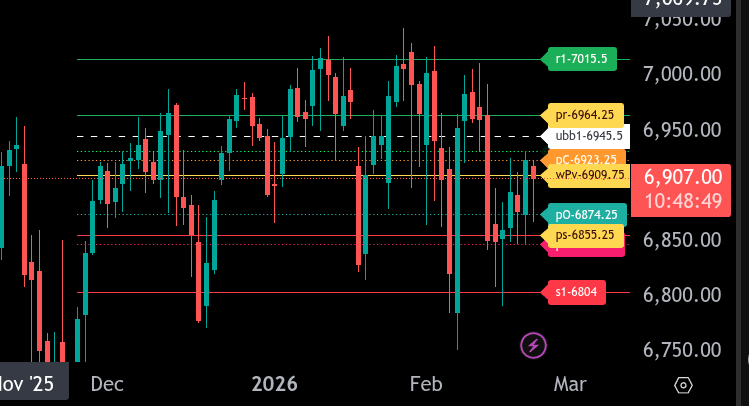
The bull/bear line for the ES is at 6909.75. This is the key pivot for today’s session. Holding above this level keeps buyers in short-term control, while sustained trade below it shifts momentum back to the sellers.
ES is currently trading around 6906.75, slightly below the bull/bear line, indicating early weakness in the Globex session. If price remains below 6909.75, look for a rotation down toward 6874.25. A break below 6874.25 opens the door to the lower range target at 6855.25. Below that, 6847.25 is additional support, with a deeper extension possible toward 6804.00 if selling accelerates.
On the upside, bulls need to reclaim 6909.75 and hold it as support. If acceptance develops above this level, first resistance comes in at 6931.50, followed by 6945.50. A sustained push through 6945.50 targets 6964.25, which is the upper range target for today. If momentum expands beyond 6964.25, 7015.50 becomes the next major resistance level.
Overall, the market is balanced around 6909.75. Trade location relative to this level will dictate intraday bias. Below it favors selling rallies into resistance, while holding above it favors buying dips into support.
NQ H
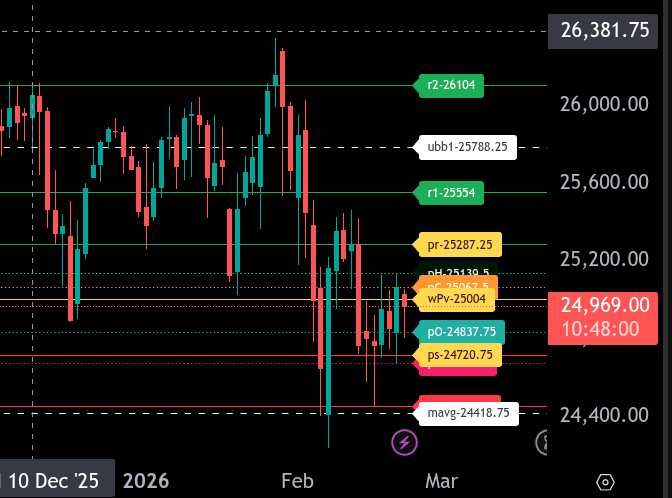
The bull/bear line for the NQ is at 25,004.00. This is the key pivot for today’s session and will determine directional control. Holding below this level keeps the market in a bearish posture, while acceptance back above it shifts momentum back to the bulls.
NQ is currently trading around 24,967.00, slightly below the bull/bear line, reflecting continued overnight weakness. As long as price remains under 25,004.00, sellers have the edge, and we look for rotation lower toward 24,837.75, followed by 24,720.75, which is today’s lower range target. A sustained break below 24,720.75 opens the door to 24,678.50 and potentially 24,454.25 if selling accelerates.
On the upside, the first resistance is 25,067.50, followed by 25,139.50. Reclaiming and holding above 25,004.00 puts 25,287.25 in play as the upper range target. A strong push through 25,287.25 could trigger short covering toward 25,554.00.
Support levels below current price: 24,837.75, 24,720.75, and 24,678.50.
Resistance levels above current price: 25,004.00, 25,067.50, 25,139.50, and 25,287.25.
Overall, the market remains bearish below 25,004.00. Bulls need acceptance back above that level to regain control. Until then, rallies into resistance are likely to find sellers, with focus on testing lower supports.
Calendars
Today’s Economic Calendar
This Week’s Important Economic Events
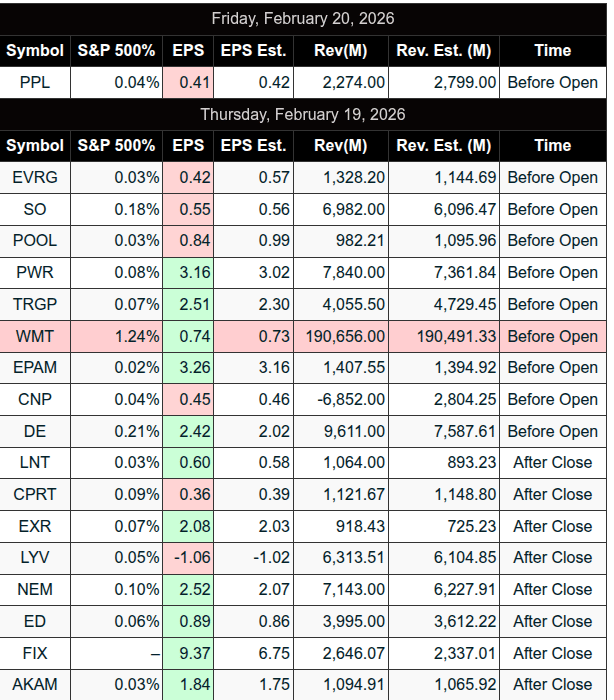
Upcoming Earnings – SP500

Recent Earnings
Room Summaries:
Polaris Trading Group Summary – Friday, February 20, 2026
“FRYDay” – Discipline Pays
The day began with David posting the Daily Trade Strategy (DTS) and key links, setting the tone for a structured and rule-based session. Early on, we saw strength in the plan as the BEAR CASE target at 6860 was fulfilled, confirming alignment with the projected downside objective right out of the gate.
Morning Session – Volatility Meets Discipline
Mid-morning brought unexpected news:
Breaking headline – Supreme Court strikes down Trump tariffs.
This injected volatility into the market, and David reinforced a key lesson:
“Normal ‘game-play’ regardless of SCOTUS decision – Follow your plan.”
That reminder was critical. News can create emotional reactions, but PTG methodology is built to handle volatility through structure, not impulse.
Major Wins – Strategy Execution
Open Range Strategy TRIFECTA!
David posted confirmation of a full Open Range Strategy trifecta — a high-probability, rule-based setup that delivered cleanly. This was a standout achievement of the session.
Later in the morning:
-
Cycle Day 1 Low Projection – Fulfilled
-
Cycle Day 1 High Range Projection – Fulfilled
Both sides of the projected range were achieved — a powerful demonstration of:
-
The accuracy of the 3-Day Cycle framework
-
Respect for structured projections
-
The market’s tendency to complete its measured objectives
David emphasized:
“Power of the 3 Day Cycle.”
This was a textbook example of how cycle projections frame the day’s expectations and allow traders to anticipate both extremes rather than react emotionally.
Key Lessons from the Day
-
Follow the Plan – Especially During News
The Supreme Court ruling created volatility, but the strategy remained the anchor. Discipline over headlines. -
Cycle Projections Provide Structure
When both high and low projections are fulfilled, it reinforces confidence in trusting the model rather than guessing. -
Open Range Strategy Continues to Deliver
The trifecta underscores the importance of mastering the opening framework — it often sets up the best opportunities of the session. -
Community & Process Matter
Traders asked about stops, entries (A10, A4), and mechanics — reinforcing that clarity in execution is just as important as the setup itself.
DTG Room Preview – Monday, February 23, 2026
Macro Focus
-
Market centered on US tariff uncertainty and upcoming US-Iran talks.
-
Supreme Court ruled Trump’s most sweeping tariffs illegal → initial bullish reaction Friday.
-
Trump followed with announcement raising baseline import tariffs from 10% to 15%, effective immediately.
-
Justification: Section 122 (Trade Act of 1974) citing a balance-of-payments crisis.
-
Economists largely dispute existence of such a crisis → legal challenges likely.
-
Bessent: Section 122 seen as a 5-month “bridge” while 232/301 investigations are conducted.
-
US Customs has halted collection of tariffs ruled illegal.
-
EU rejects any further US tariff increases, wants adherence to prior trade deal.
-
China reviewing ruling, calling for removal of unilateral tariff measures.
Geopolitics
-
US-Iran nuclear talks resume Thursday (Feb 26) in Geneva.
-
US increasing regional military presence.
-
Iran signaling openness to diplomacy but rejecting pressure tactics.
Earnings
-
Premarket: D
-
After close: OVV, OKE, KEYS, CIB, FANG
-
Tuesday AM: HD, AS, AMT, BNS, CEG, DDS, ELAN, FIS, FMS, KDP, NRG, VIV
Economic Calendar
-
8:30am ET – Fed Gov. Waller
-
10:00am ET – Factory Orders (delayed release)
Volatility / Flow
-
Friday: 40-point range on SCOTUS headline.
-
ES 5-day ADR: 82 handles (moderately elevated).
-
No whale bias overnight – large trader volume light.
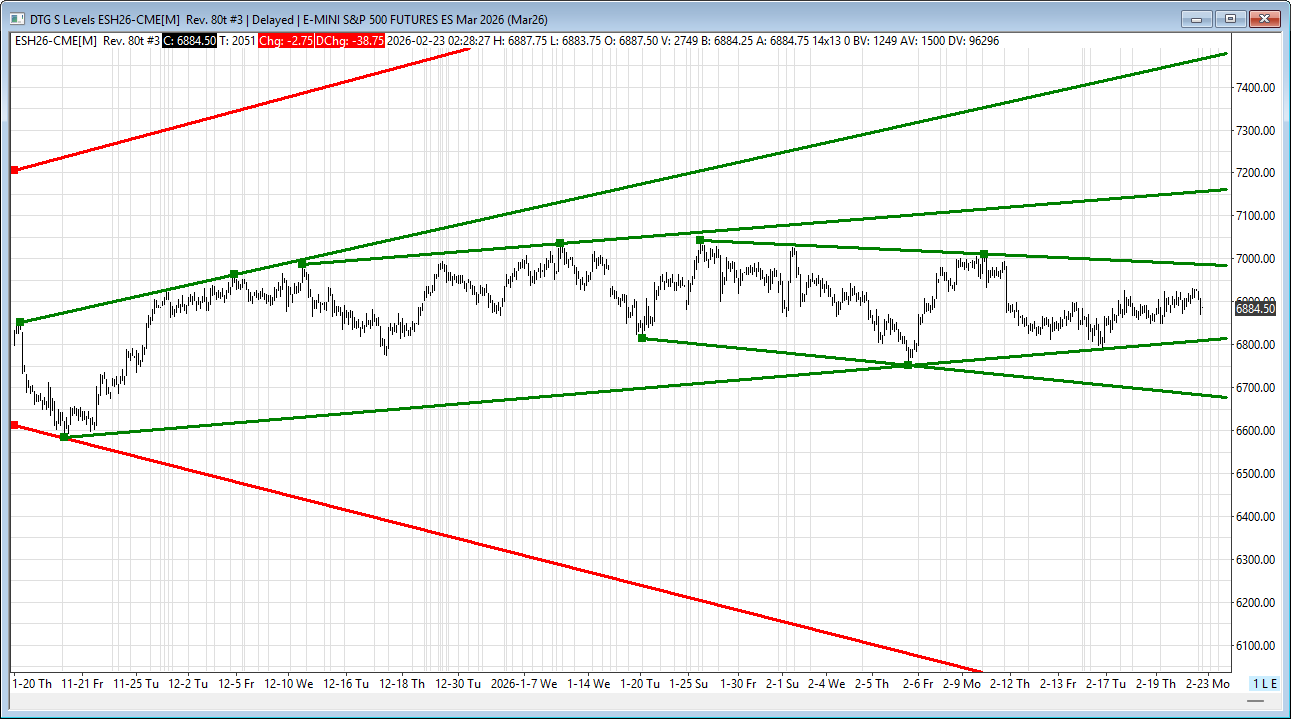
Technical Backdrop (ES)
-
3-month sideways consolidation under ATHs.
-
Trading near midpoint of short-term downtrend channel.
-
Still inside intermediate-term uptrend channel.
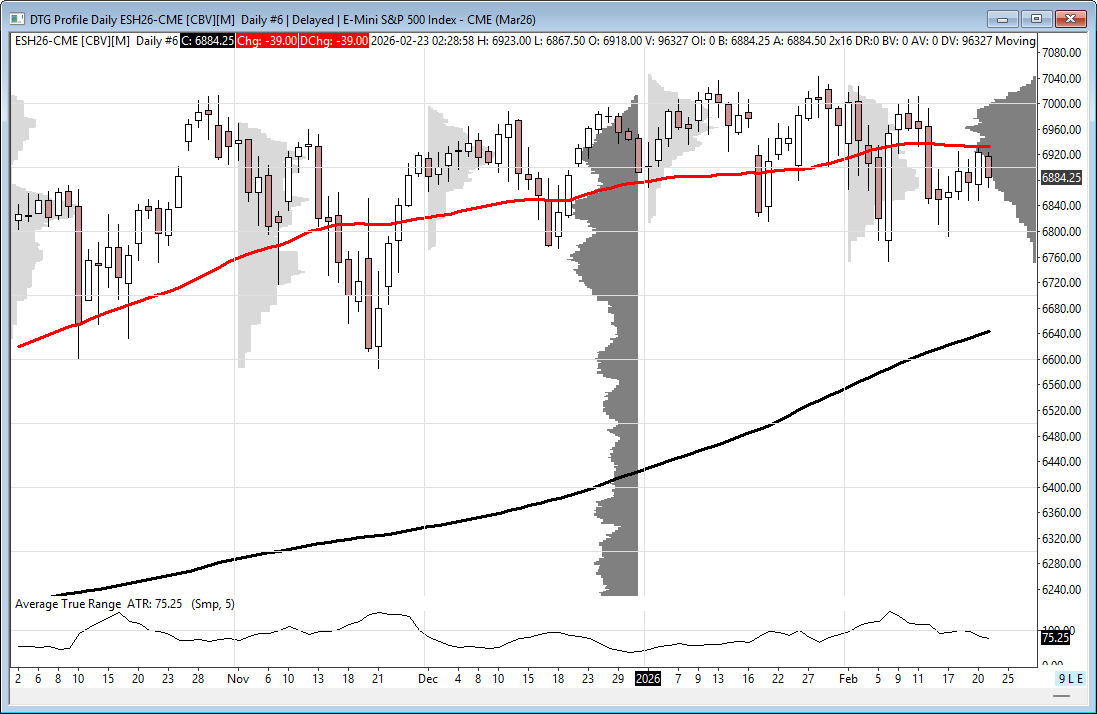
-
50-day MA (6933) capped Friday’s HOD → near-term resistance.
-
Both sides have room within current structure.
Potential TL Levels
-
Resistance: 6985/82s, 7160/65s
-
Support: 6810/13s, 6677/72s
Bottom Line
-
Macro headline risk elevated (trade + Iran).
-
Range conditions remain intact.
-
Expect two-sided trade within established consolidation unless new policy headlines shift momentum.
Affiliate Disclosure: This newsletter may contain affiliate links, which means we may earn a commission if you click through and make a purchase. This comes at no additional cost to you and helps us continue providing valuable content. We only recommend products or services we genuinely believe in. Thank you for your support!
Disclaimer: Charts and analysis are for discussion and education purposes only. I am not a financial advisor, do not give financial advice and am not recommending the buying or selling of any security.
Remember: Not all setups will trigger. Not all setups will be profitable. Not all setups should be taken. These are simply the setups that I have put together for years on my own and what I watch as part of my own “game plan” coming into each day. Good luck!
This post goes out as an email to our subscribers every day and is posted for free here around 2 PM ET. To get your real-time copy, sign up for the free or premium version here: Opening Print Subscribe.
Comments are closed