This post goes out as an email to our subscribers every day and is posted for free here around 2 PM ET. To get your real-time copy, sign up for the free or premium version here: Opening Print Subscribe.
5 Billion to Buy ‘Em on the MIM — ES Back-and-Fill Holds 6830 While the Stops Stack at 6930
Follow @MrTopStep on Twitter and please share if you find our work valuable!
FREE Two-Week Offer for the Opening Print Premium. Open up the Lean and other premium features for the next Two Weeks!
Our View
In the last two sessions, the 3:50 NYSE and NASDAQ imbalances have bought over $5 billion in stocks. Marlin would have better numbers than I do, but these were not the only big buy imbalances we have seen over the last few weeks.
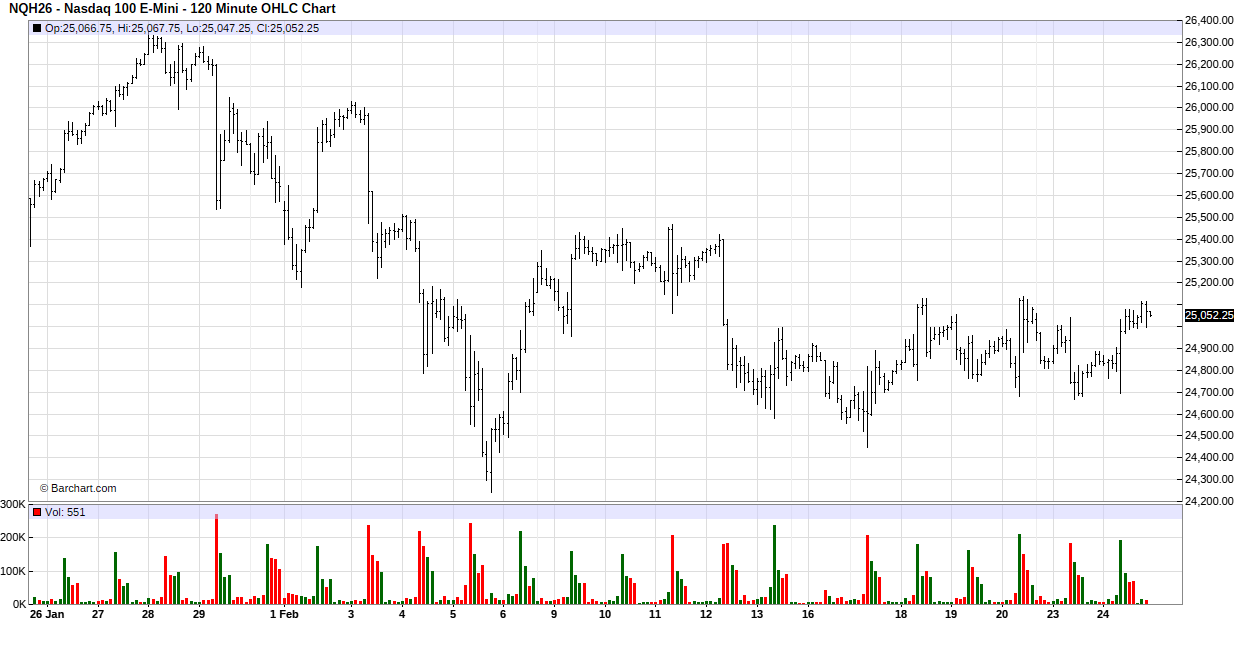
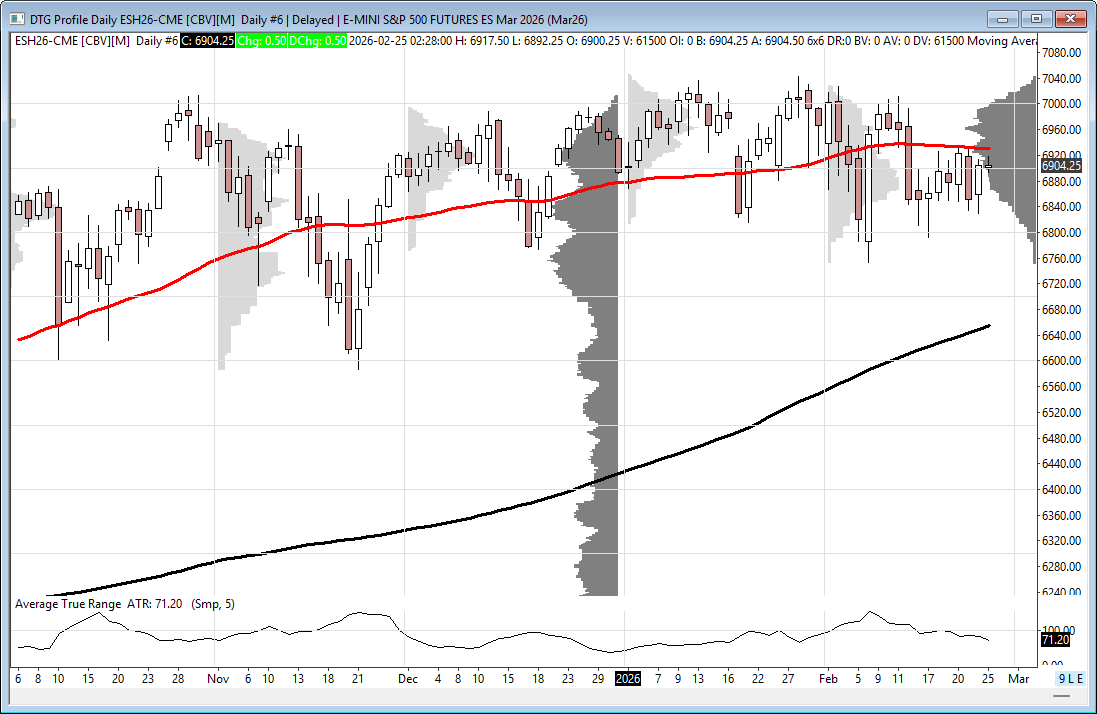
That said, I continue to point out the ES back-and-fill pattern that actually started around February 12th, or eight sessions ago, and again held that band yesterday when it held the 6830 level. While concentrating on the ES, the NQ has also been in its own back-and-fill pattern since February 12th, and below is a monthly chart of the NQH, which clearly shows the pattern.
Below is an ESH/NQH 3 Month Overlay chart.
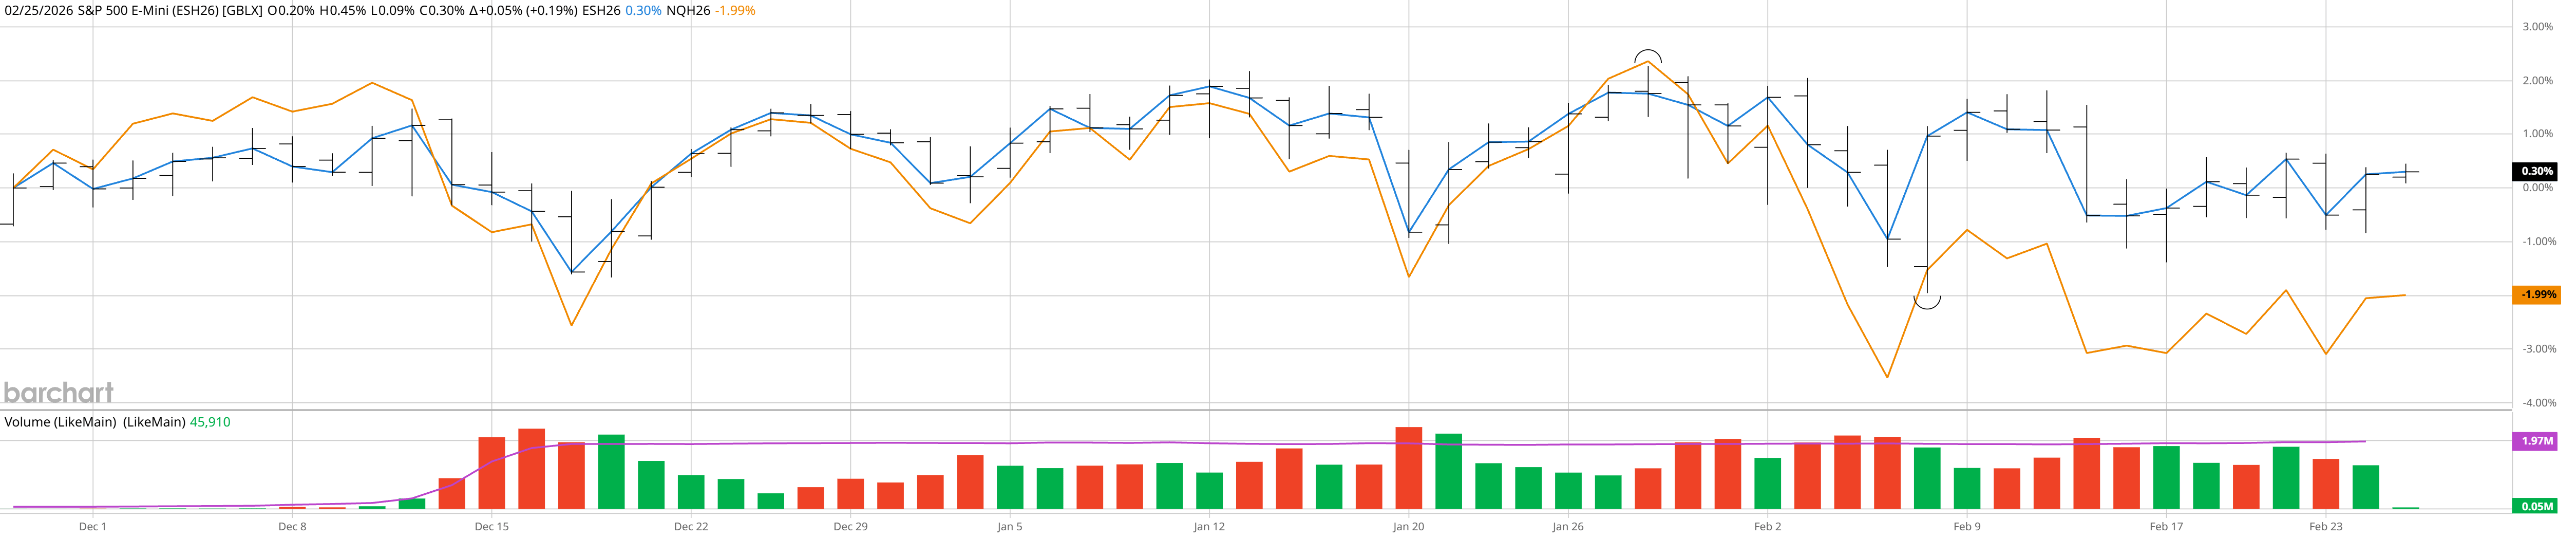
I can’t say for sure that the ES and NQ are out of harm’s way, but what I can say is this is a very distinct pattern.
Our Lean
It’s 8:59, President Trump is about to give his State of the Union address, and the ES and NQ are both higher on Globex. In addition to Lowe’s and Nvidia reporting today, there are two Fed speakers and a 2 Yr note auction. While I remain a cautious bull, the ES is up against big resistance above at the 6920–6930 level, but this area is also laced with buy stops.
Our lean: the ES has been up 4 out of the last 6 sessions and appears to be firming up. I cannot rule out selling a big gap up, but ideally, I think buying the weakness has been working. The gaps remain tradable, especially after a double pump.
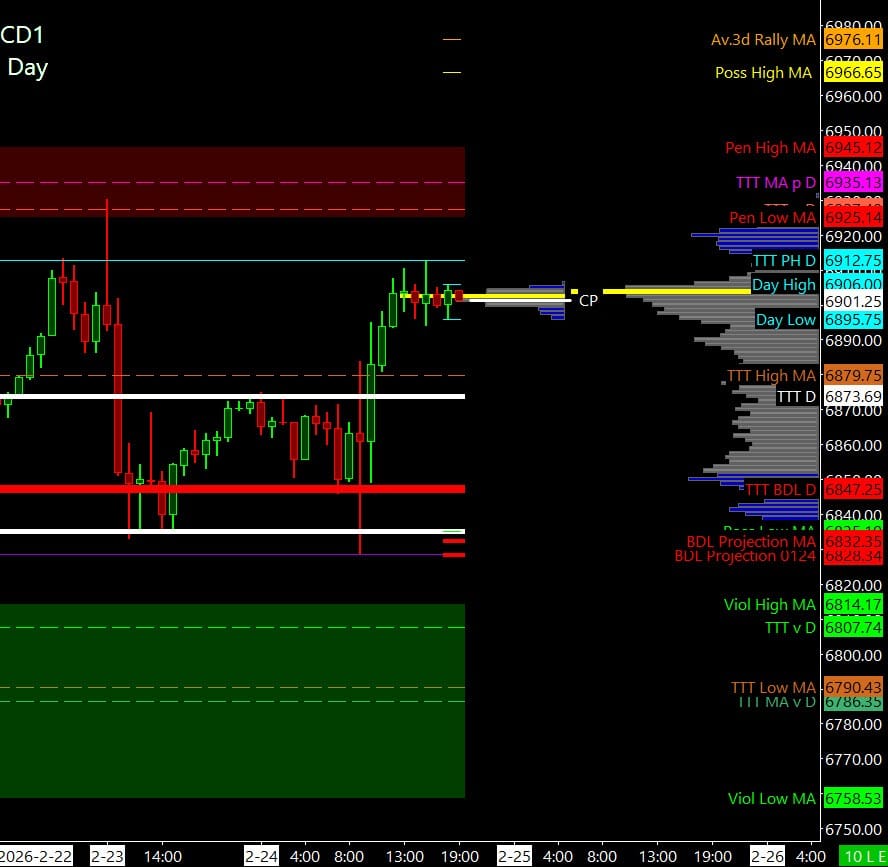
AI Volume Profile areas (VAH, POC, VAL) are clearly highlighted and integrated into the resistance/support structure. These are key reference points from market profile/volume profile analysis:
VAH (Value Area High): 6,912.16
POC (Point of Control): 6,898.00 / 6,897.25 (tight cluster – often treated as a single heavy volume node)
VAL (Value Area Low): 6,858.25 / 6,854.90 (tight cluster)
Resistance Levels (above current/VAH zone)
Value Area / Fair Value Zone
Support Levels (below VAL zone)
6,959.50
VAH → 6,912.16
VAL → 6,858.25 / 6,854.90
6,952.60
Between VAH and VAL (fair value / balanced area)
6,850.58
6,943.64
POC → 6,898.00 / 6,897.25 (highest volume node)
6,832.82
6,939.07
VAL → 6,858.25 / 6,854.90
6,829.50
6,934.83
6,933.50
6,931.96
6,931.65
6,926.36
6,917.50
6,916.69
6,912.75
VAH → 6,912.16

Market Recap
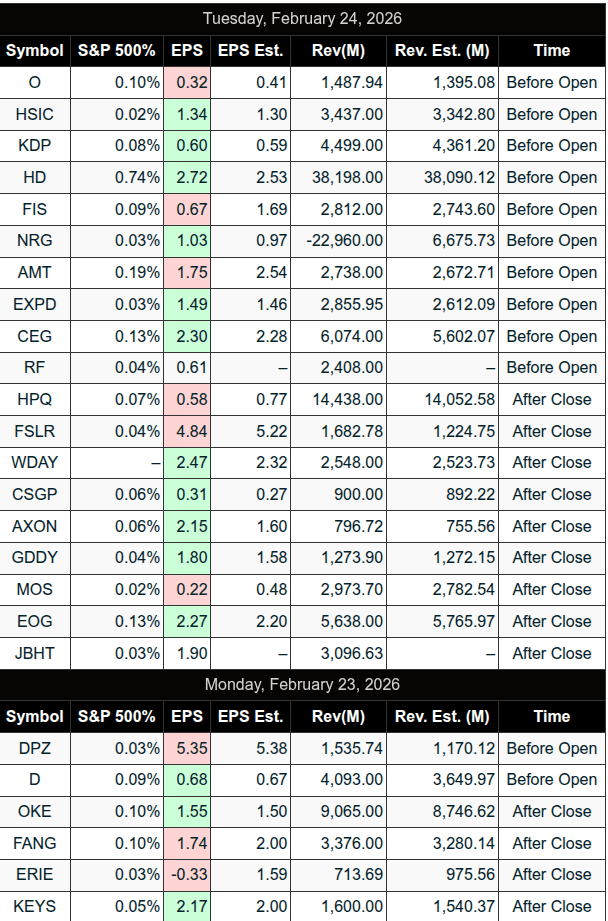
The ES rallied up to 6875.00 and traded down to 6845.75 on Globex after Home Depot beat its earnings estimate for the first time in a year, as demand for projects remained low, and opened Tuesday’s regular session at 6847.50, down 11 points or -0.16%.
After the open, the ES traded 6850.75, dropped down to 6828.50 at 9:35, then rallied up to 6883.75. The ES sold off down to higher low 6849.25 at 10:00 (sell program into the half hour), then rallied up to 6895.00 at 10:40. It pulled back to 6880.75 at 10:55, rallied up to a new high at 6898.25 at 11:10, and pulled back to 6880.74 at 11:30. The ES then rallied up to 6907.50 at 12:25.
The ES pulled back to 6898.75, then rallied back up to 6910.50 at 1:00. It pulled back to 6898.25 at 1:30 and rallied up to a lower high at 6908.25 at 1:45. The ES pulled back to 6895.50 at 2:15, then rallied up to a lower high at 6906.00 at 2:50. It pulled back to 6894.00 at 3:15 and traded back up to 6904.75 at 3:48. The ES traded 6904.25 as the 3:50 imbalance showed $3.4 billion to buy. It shot up to 6912.75, sold back off down to 6903.00, and traded 6903.25 at the 4:00 cash close.
After the 4:00 cash close, the ES traded down to 6899.00 and settled at 6903.75, up 52.25 points or +0.76%. The NQ settled at 25,025.75, up 266 points or +1.07%, the YM settled at 49,236, up 387 points or +0.79%, and the RTY settled at 2,655.00, up 28.70 points or +1.09% on the day.
In the end, it was kind of like the old Sonny & Cher song, “The Beat Goes On”. In terms of the ES and NQ’s overall tone, I am not at all surprised by the rip. In yesterday’s lean, I mentioned trading the gaps and pointed out the MrTopStep trading rule that the ES tends to go sideways to down after a big up day (last Friday) and tends to go sideways to up after a big down day (Monday). I did say we could see a bounce, but I thought the rally could fail, which didn’t happen. In terms of the ES’s overall trade, volume was the lowest of the last 10 sessions at 1.276 million contracts traded.
Today should be another day of “whipsaw” trade, with Lowe’s reporting before the opening bell and Nvidia after the closing bell.
Wed Feb 25
Before open: Lowe’s (LOW)
09:35 Barkin (Fed)
11:00 Schmid (Fed)
5Y Note auction ($70B)
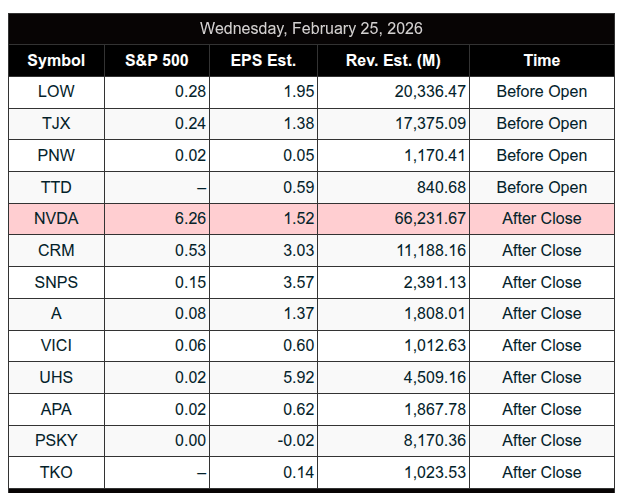
After close: Nvidia (NVDA), Salesforce (CRM)
There are no major banks that are negative on Nvidia earnings today or have a negative (Sell, Underperform, or Bearish) outlook or rating on NVIDIA (NVDA) ahead of its fiscal Q4 earnings report.
Goldman Sachs is notably bullish ahead of the report. Their analyst (Jim Schneider) expects a beat-and-raise quarter, with:
Q4 revenue forecast of ~$67.3 billion (about $2 billion above consensus/Street estimates at the time of their note, e.g., vs. ~$65.6B Street).
Q4 EPS above consensus by ~5% (specific figure around $1.59 in some references).
They also stand ~8% above Street for next quarter (Q1) revenue and 9% on EPS.
They maintain a Buy rating with a $250 price target, citing strong AI demand, hyperscaler capex trends, and Rubin GPU ramp-up later in 2026.
Longer-term, they model significant growth through 2028 (e.g., FY2026 revenue ~$215B, FY2027 ~$383B).
JPMorgan (J.P. Morgan) Estimates
JPMorgan (analyst Harlan Sur) is also positive, reiterating an Overweight (Buy equivalent) rating with a $250 price target. They anticipate another beat-and-raise quarter, driven by strong execution, volume growth, and pricing power in AI chips.
They expect revenue to exceed the ~$65.6B consensus.
Guidance could come in at $74–75 billion for the next quarter (above consensus).
Specific Q4 revenue/EPS numbers aren’t as explicitly detailed in recent public notes as Goldman’s, but they align with expectations of upside despite high bars set by the market.
Guest Posts
Polaris Trading Group
S&P 500 (ES)
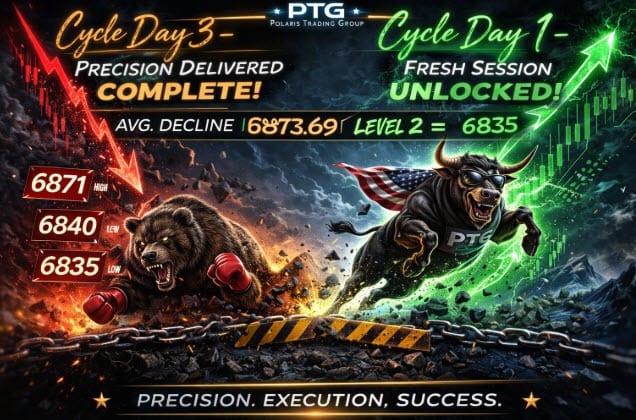
🔄 Transition: Cycle Day 3 → Cycle Day 1
Reset. Reload. Re-engage.
The emotional excess of CD3 fades into the background…
The inventory clears. The late shorts exhale. The late longs rethink their life choices.
And just like that —
🎬 Cue the opening bell of a brand-new Cycle Day 1.
This is not continuation energy.
This is structure-building energy.
🧭 What CD1 Is All About
Cycle Day 1 is the framework session.
It establishes:
-
The dominant side of pressure
-
The tone for the next 72 hours
-
The location of trapped participants
-
The reference points institutions will defend or attack
No drama. No hero trades.
Just positioning.
📉 Decline Roadmap
Average Decline Levels:
-
Level 1: 6873.69
-
Level 2: 6835.00
These are not “panic numbers.”
They are inventory adjustment zones.
If price rotates down into Level 1:
-
Expect responsive buyers to test the waters.
Watch for tempo — slow bleed vs. acceleration.
If Level 2 comes into play:
-
That’s where weak-handed longs start negotiating with reality.
-
Acceptance below there? Now we’re talking about initiative sellers.
🧠 CD1 Mindset
-
Early direction can be misleading.
-
The real tell is how price behaves at extremes.
-
Does it build value… or reject it?
Remember:
CD1 doesn’t need to be flashy.
It needs to be informational.
Let the market show its hand.
We just read the tape.
🎯 New cycle. Clean slate.
Let’s build the map.
🎯 Cycle Day 1 Focus
Scenarios for today’s trade
🟢 Bull Case — Buyers Stay in Control
Acceptance north of 6905 ±5
Upside objectives:
• 6915
• 6920
• 6925
🔴 Bear Case — Rotation / Reset
Acceptance south of 6905 ±5
Downside objectives:
• 6895
• 6890
• 6885
📊 Key Reference Levels
• PVA High Edge: 6910
• PVA Low Edge: 6878
• Prior POC: 6905
⚠️ Tactical Takeaway
Of course, nothing changes for PTG…Simply follow your plan. Take only Triple A setups and manage the $risk. ALWAYS HAVE HARD STOP-LOSSES in-place on the exchange.
PTG’s Primary Directive (PD) is to ALWAYS STAY IN ALIGNMENT with the DOMINANT FORCE.
— PTG
MOC Recap
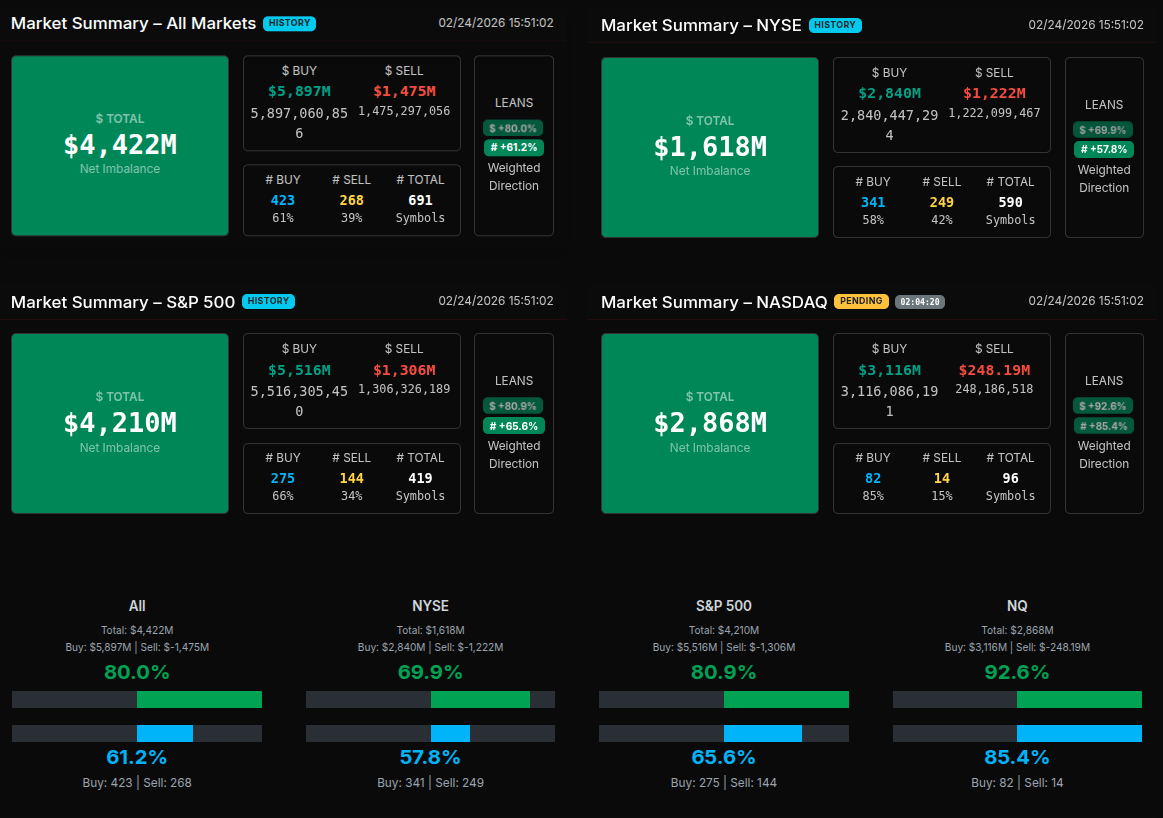
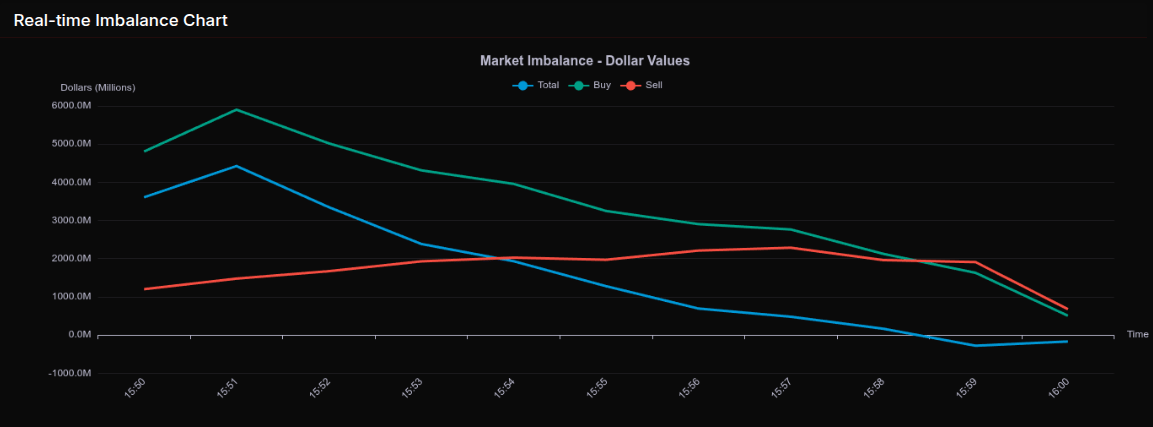
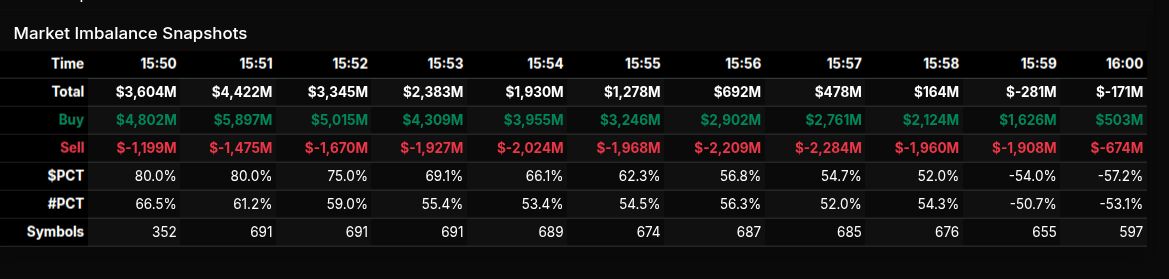
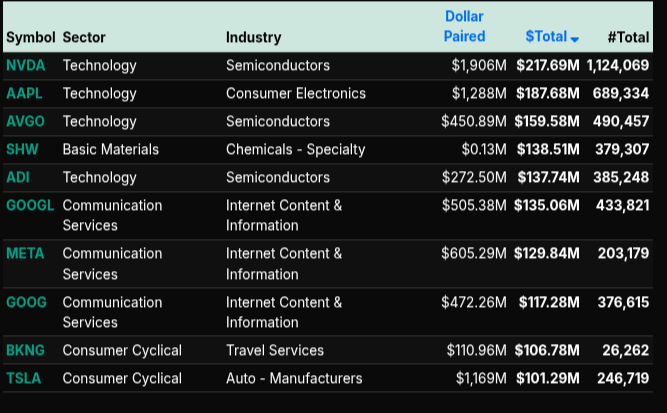
The February 24th MOC session opened with an aggressive institutional bid and never looked back until the final minute flip. At 15:50, total imbalance printed $3.6B to buy, with $4.8B in buy orders versus $1.2B for sale, producing an 80% dollar lean and 66.5% symbol participation. One minute later, buy pressure expanded sharply to $5.9B versus $1.47B for sale, pushing the net imbalance to $4.4B and maintaining an 80% lean. This was broad, programmatic accumulation rather than rotational flow.
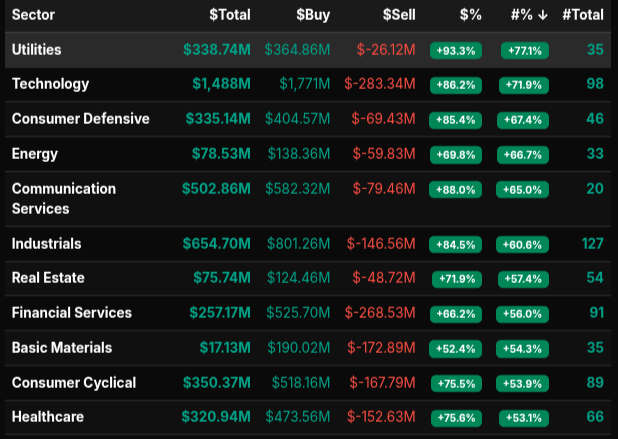
Sector data confirmed wholesale buying. Utilities led with a +93.3% dollar lean, Technology +86.2%, Communication Services +88.0%, and Consumer Defensive +85.4%. Energy printed +69.8% while Industrials showed +84.5%. When readings exceed +66%, it reflects decisive institutional demand, and nearly every major sector crossed that threshold. Even Financials, at +66.2%, sat right on the line of broad accumulation. There was no meaningful defensive rotation; it was market-wide demand.
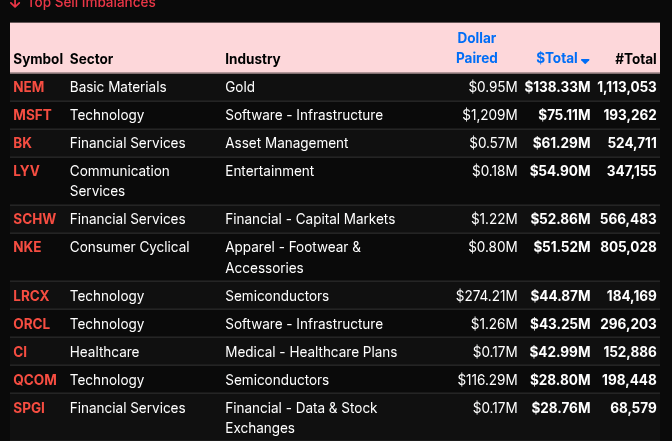
On the symbol level, leadership concentrated in mega-cap technology and growth. NVDA ($217.7M), AAPL ($187.7M), AVGO ($159.6M), ADI ($137.7M), and MSFT (despite appearing on the sell list earlier) reflected heavy paired activity but net buy dominance. Communication names GOOGL, GOOG, and META all showed strong closing bids. Consumer names like TSLA and BKNG also leaned positive. Notably, there were no symbols with a -66% extreme sell skew, reinforcing that this was not distribution but accumulation.
At 15:58, the imbalance compressed to $164M as sell programs rose, and by 15:59, the tape briefly flipped negative (-$281M, -54%). The 16:00 print settled at -$171M with a -57% lean, reflecting late offsetting flow rather than true sell-side control.
Overall, this MOC reflected broad-based institutional buying across Technology, Communication Services, Industrials, and Utilities, with extreme positive leans signaling wholesale market-on-close demand before a routine balancing rotation into the bell.
Technical Edge
Fair Values for February 25, 2026:
-
SP: 12.51
-
NQ: 51.49
-
Dow: 41.69
Daily Market Recap 📊
For Tuesday, February 24, 2026
• NYSE Breadth: 68% Upside Volume
• Nasdaq Breadth: 76% Upside Volume
• Total Breadth: 75% Upside Volume
• NYSE Advance/Decline: 65% Advance
• Nasdaq Advance/Decline: 68% Advance
• Total Advance/Decline: 67% Advance
• NYSE New Highs/New Lows: 171 / 79
• Nasdaq New Highs/New Lows: 226 / 221
• NYSE TRIN: 0.87
• Nasdaq TRIN: 0.64
Weekly Market 📈
For the week ending Friday, February 20, 2026
• NYSE Breadth: 55% Upside Volume
• Nasdaq Breadth: 56% Upside Volume
• Total Breadth: 55% Upside Volume
• NYSE Advance/Decline: 59% Advance
• Nasdaq Advance/Decline: 56% Advance
• Total Advance/Decline: 57% Advance
• NYSE New Highs/New Lows: 404 / 116
• Nasdaq New Highs/New Lows: 407 / 492
• NYSE TRIN: 1.19
• Nasdaq TRIN: 1.00

Trading Room Summaries
Polaris Trading Group Summary – Tuesday, February 24, 2026
Cycle Day 3 – Precision & Alignment
The day began with Manny setting the tone: “New day, fresh start.” As always, the focus was on consistency, clean setups, and disciplined execution. David reinforced the structure with the Daily Trade Strategy and emphasized PTG’s Primary Directive: Stay aligned with the dominant force and always manage risk with hard stops.
Overnight Context
Both the upper and lower DTS targets were fulfilled overnight, signaling a balanced but active market heading into the regular session. This set up a classic Cycle Day 3 environment.
Key pivot: 6850 ±5 (Prior POC)
-
Above = Bull case (6865 → 6875)
-
Below = Bear case (6845 → 6835)
Early Session – Bear Case Plays Out First
The early lean favored sellers.
-
Price accepted below 6850.
-
The 6835 downside target was fulfilled, completing the bear objective.
-
A CL Open Range short was called with scaling to Target 2.
-
Put Wall reference (SPX 6800 / ES 6812) provided important context.
After weak sellers pushed into target, buyers stepped in aggressively and snatched control. This was a key shift. The downside completed, and responsive buying took over.
Lesson: When targets are fulfilled and sellers fail to extend, be ready for control to rotate.
Mid-Morning – Bulls Wrestle Control
David noted that bulls had taken control and the strategy shifted to staying aligned on dips.
There was discussion around:
-
A4 setups
-
Open Range strategy
-
Using alignment tools (1-min zig-zag as higher timeframe context for 750T)
-
Adapting to “wild-card” rhythms
Flexibility was emphasized without abandoning structure.
Lesson: Entries matter, but trade management and alignment matter more.
Afternoon – 3-Day Cycle Precision
After lunch, the market continued higher.
Cycle Day 3 fulfilled its Range High Projection at 6908.61.
David highlighted the remarkable precision of the 3-Day Cycle framework. What began as a rotation below 6850 evolved into a full bullish expansion day once buyers reclaimed control.
The afternoon session was relatively quiet after achieving the projected range high — a textbook example of how the cycle often completes its objective before momentum fades.
Major Takeaway:
-
Early bear objective completed.
-
Buyers regained control.
-
Staying aligned with dominant force led to participation in the move toward the 6908 projection.
-
The cycle structure delivered with precision.
Positive Themes from the Day
-
Clean execution of both bull and bear scenarios.
-
Respect for key levels (6850 pivot was critical).
-
Open Range and A4 discussions added tactical depth.
-
Strong reinforcement of disciplined risk management.
-
Excellent real-time adaptation when control shifted.
Core Lessons Reinforced
-
Let targets complete — then assess control.
-
Acceptance above/below key pivots dictates bias.
-
Don’t force trades in chop.
-
Alignment with dominant force is non-negotiable.
-
The 3-Day Cycle framework continues to prove its edge.
Overall Tone of the Day:
Structured, disciplined, flexible — and another strong example of trusting the process.
Cycle Day 3 delivered both sides of the playbook, but traders who stayed aligned and patient were rewarded.
Discovery Trading Group Room Preview – Wednesday, February 25, 2026
Primary Catalysts
-
Trump’s State of the Union (SOTU)
-
Nvidia (NVDA) earnings after the bell
-
U.S.–Iran nuclear talks (Thursday)
SOTU & Political Backdrop
-
Trump stated tariff “deals are all done” and called for congressional action.
-
Suggested tariffs could substantially replace income tax revenue.
-
Current tariff revenue (~$30B/month) remains a small fraction of income tax collections.
-
Polling remains weak:
-
~41% approve of economic handling; ~56% disapprove.
-
Inflation approval numbers worse.
-
Post-SOTU polls showed majority viewed speech as “not strong.”
-
-
Oil near 7-month highs ahead of U.S.–Iran talks.
-
U.S. military presence in Middle East at largest level since 2003.
-
Trump claimed Iran is reconstituting nuclear program → increasing geopolitical risk premium.
Earnings Focus – Nvidia in Spotlight
-
NVDA reports after the bell.
-
Stock has traded sideways since June → large base forming.
-
NVDA +3% YTD vs INTC +25% YTD.
-
Market focused on AI growth outlook into 2027–2028.
-
AI expansion continues across:
-
PCs & smartphones
-
Enterprise software
-
Gaming & social media
-
Advertising
-
Appliances & security
-
Autos
-
-
GTC 2026 event approaching → potential major product announcements.
Other Earnings
-
Premarket: ABEV, HSBC, LOW, TJX, BMO, DEO, NU, OC, PNW, SARO
-
After Close: NVDA, CRM, SNOW, SNPS, ZM, TKO, UHS, VICI, APA, HEI, PR, PSTG, TCOM
-
Thursday AM: BABA, WBD, CM, LNG, TD, SRE, ARGX, PEG, VST, and others
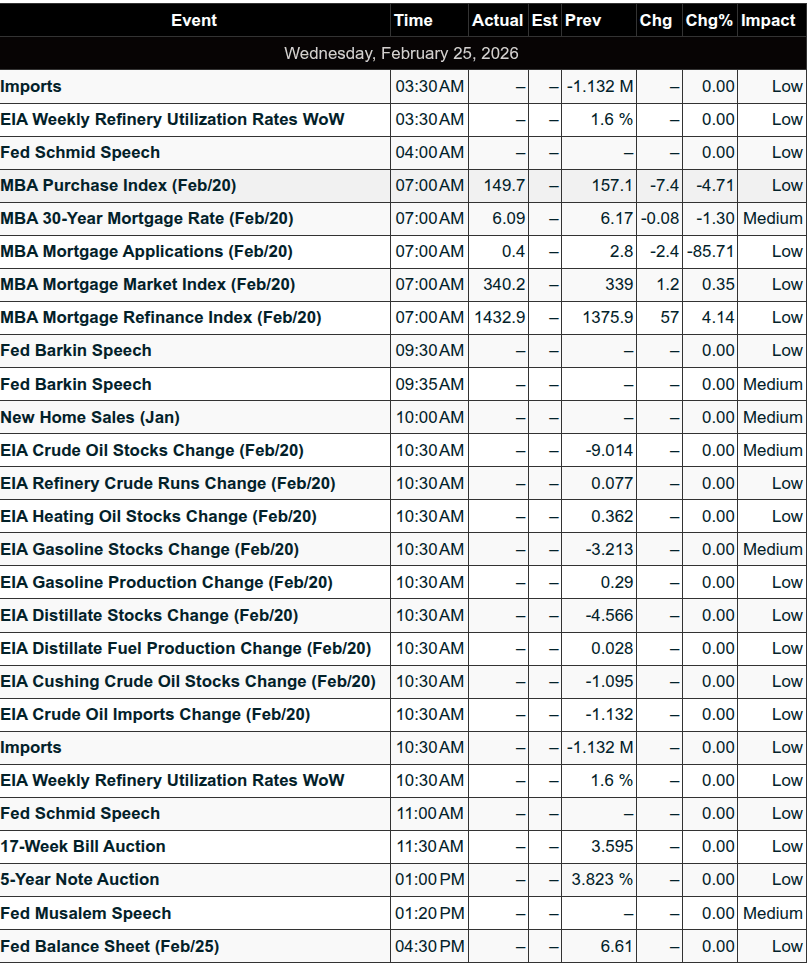
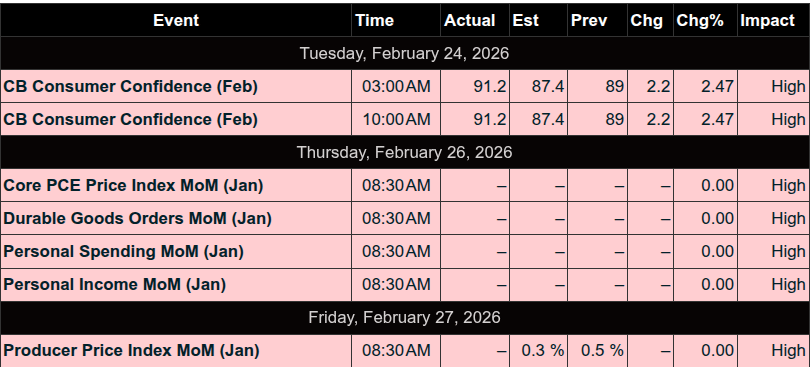
Economic Calendar
-
Crude Oil Inventories – 10:30am ET
-
Fed Speakers:
-
Barkin – 9:30am ET
-
Schmid – 11:00am ET
-
Musalem – 1:20pm ET
-
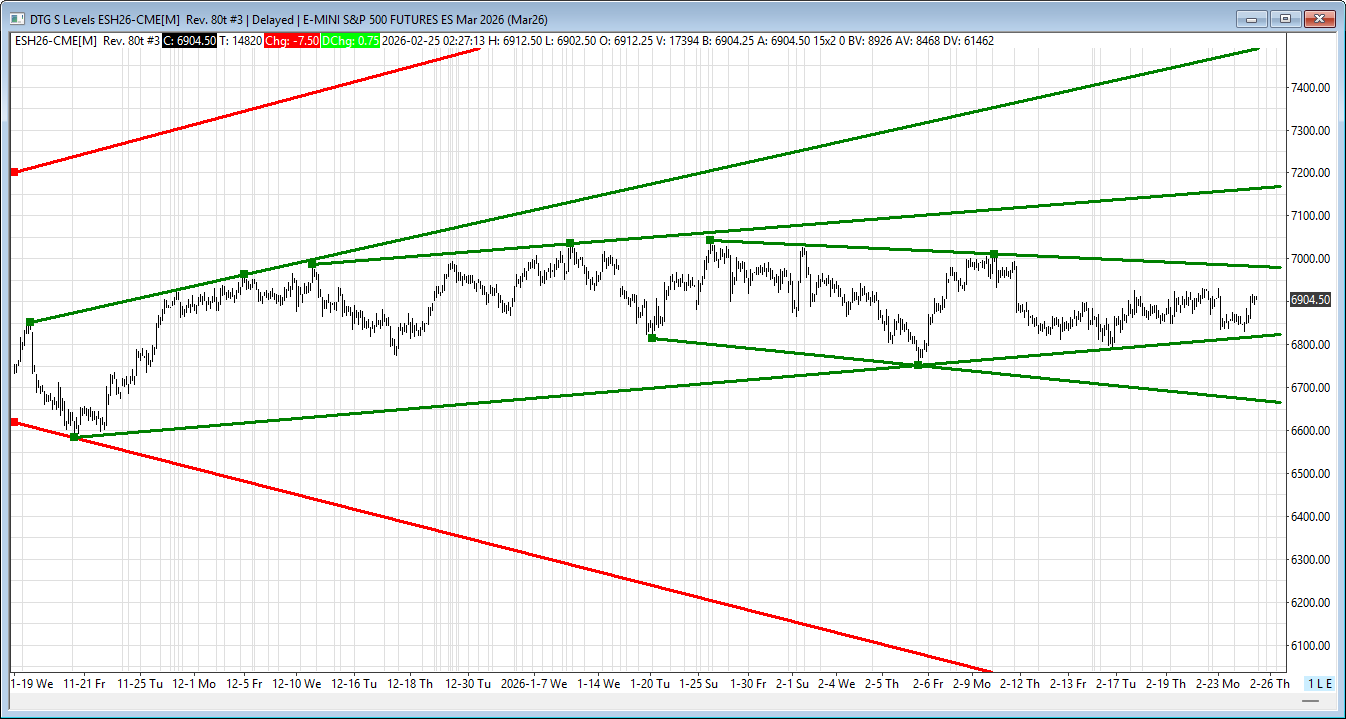
ES Technical Picture
-
Volatility moderately elevated.
-
5-day average range: ~83 points.
-
3+ month sideways consolidation under all-time highs.
-
No significant overnight large trader (“whale”) bias.
Key Technical Notes
-
ES 50-day MA (6930) capped highs 4 of last 5 sessions.
-
Price holding above intermediate-term channel bottom (short-term bullish).
-
Short-term channel top + intermediate-term channel bottom beginning to squeeze.
-
Break of either boundary could trigger substantial move.
-
Both bulls and bears have room intraday ahead of NVDA catalyst.
Key Levels
-
Resistance: 6982/79s, 7168/73s
-
Support: 6819/22s, 6663/58s
Bottom Line:
Markets remain range-bound but coiled. NVDA earnings and geopolitical developments are the likely catalysts for the next directional move.
Affiliate Disclosure: This newsletter may contain affiliate links, which means we may earn a commission if you click through and make a purchase. This comes at no additional cost to you and helps us continue providing valuable content. We only recommend products or services we genuinely believe in. Thank you for your support!
Disclaimer: Charts and analysis are for discussion and education purposes only. I am not a financial advisor, do not give financial advice and am not recommending the buying or selling of any security.
Remember: Not all setups will trigger. Not all setups will be profitable. Not all setups should be taken. These are simply the setups that I have put together for years on my own and what I watch as part of my own “game plan” coming into each day. Good luck!
This post goes out as an email to our subscribers every day and is posted for free here around 2 PM ET. To get your real-time copy, sign up for the free or premium version here: Opening Print Subscribe.
Comments are closed