This post goes out as an email to our subscribers every day and is posted for free here around 2 PM ET. To get your real-time copy, sign up for the free or premium version here: Opening Print Subscribe.
Globex Gone Wild: Triple Volume, Gap ‘n Trap Action, and a Thursday-Low Hunt Into FRYday
Follow @MrTopStep on Twitter and please share if you find our work valuable!
Our View
It’s 9:30, and I am still at it. The Kurds are in eastern Iran, crude oil has jumped up to 77.42, up 2.5%, the ES rallied up to 6900.75 and just sold off down to 6857.25, gold rallied up to $5,203 and is on its high, Goldman Sachs is unloading private credit to retail investors which is very similar to what happened during the 2008 credit crisis, Morgan Stanley laid off 2,500 employees, Apple is lowering prices, China’s growth is slowing and Russia is gaining ground in Ukraine as Iranian missiles are depleting stocks piles of Patriot interceptors. Need I say more? As I said on Twitter, this is a total crazy town.
It’s not just the geopolitical situation that is evolving, but there is a load of economic reports, Fed speakers and the week one options expiration going into the end of the week. I know the ES and NQ have rallied, but I still think things are very unstable. I started watching the TV last Friday and have had it on more than at any time since the COVID-19 pandemic hit, but I had to turn it off again and will keep it that way. As the old saying goes, no news is good news.
Our Lean
Since last Friday, Globex volume has ranged from 550k a day to 630k, nearly triple the daily average. I think the ES is going back down, but when the futures open way down on oversized volume, they tend to bounce, and when they gap up on high volume, they tend to sell off. Yesterday the ES gapped high, sold off and then ripped, but I don’t think that will be the case today. The PitBull mentioned his rule about looking for a Thursday low before the FRYday expiration, and I don’t doubt that, but I doubt anyone wants to be long going into the weekend. I’m sorry I can’t be more direct, but when there are big ranges like we have been seeing, it’s hard to call the direction because it changes so much.
Signed,
The Pessimistic Bull
AI ES Quick Profile Analysis
-
Balance vs. Imbalance: With the “Latest” price ($6,860.00$) sitting just below the “Previous Close” ($6,876.00$), the market is currently testing the lower boundary of yesterday’s value.
-
The Pivot Confluence: There is a heavy “Support Cluster” between 6,847.83 (Pivot Point) and 6,857.25 (Session Low). If the price holds here, it suggests a return to the POC ($6,876.00$).
-
Expansion Targets: A break above 6,902.44 (1 Std Dev Resistance) shifts the profile into an “Imbalance” state, targeting the 2nd Pivot Resistance at 6,968.33.
Price Level Ladder
Resistance
Neutral / Pivot
Support
6,987.75
6,886.50
6,847.83
6,968.33
6,880.88
6,842.61
6,952.75
6,876.00
6,838.61
6,937.95
6,865.13
6,830.58
6,932.25
6,864.61
6,830.20
6,931.50
6,860.00 (Latest)
6,801.67
6,923.25
6,857.25
6,800.95
6,922.17
6,855.75
6,773.55
6,921.80
6,851.72
6,727.33
6,919.14
6,849.56
6,718.75
6,913.39
6,910.55
6,906.65
6,902.44
6,900.75
6,899.67
6,898.51
6,889.13
Guest Posts:
Dan @ GTC Traders
People Tend to Seek Excitement Over a Good Trading Process
There is an old quote attributed to Richard Dennis …
“I always say that you could publish my trading rules in the newspaper and no one would follow them. The key is consistency and discipline “
His subsequent experiment proved the truth of this. Many failed simply because they could not follow the very clear process that he gave them.

The error, is simply a human failing. Simply look at Richard’s experiment. Most profitable trading processes contain something uncomfortable inside them. Drawdowns. Long periods of inactivity. Losing streaks. Signals that “ f e e l “ wrong when they fire. “Yes, it says I should take this trade … but this time …” or “Yes … it says I should stay in this trade, but the drawdown is so great and uncomfortable that if this one time I ….”
A system that produces positive expectancy over time rarely feels pleasant in the short run. So what do people do? What is the human response? If a process works, human beings immediately feel the need to improve it. Adjust it. Optimize it. Add a filter here. They want to quote – unquote ‘improve it’. They want to smooth the drawdowns. So they add “confirmation indicators” (what a joke that is). They skip trades that make them uneasy. They tighten stops. They widen stops. They optimize parameters on past data. Remove a rule there. Tweak the entry. Delay the exit. Because you know … they want to “make it better.” And in doing so they usually destroy the very properties that made the system profitable in the first place. By the time they are finished “improving” the system… the edge is gone and they are hemorrhaging money.
Richard Dennis would remain profitable for a very simple reason. He followed the process.
There is another human complication that fascinates me even more.
Boredom.
Give someone a profitable strategy that does exactly what it is supposed to do… and eventually they grow tired of it. It becomes routine. Mechanical. Predictable. The novelty and the rush and ‘excitement’ disappears. And it is at that moment they begin looking for something that will give them a beautiful adrenaline rush.
Years ago a mentor of mine told me something interesting. One of the first questions a prospective trader should ask themselves is simple.
Why do you want to become a trader? The answers were fascinating.
Some wanted to prove they were smart. Others wanted to prove they were just as capable as the professionals they saw on television. One person reportedly said they wanted to show their mother-in-law they could amount to something.
Only a handful answered with the obvious response: To make money.
Which is ironic… because that is the entire purpose of trading.
What many people actually want is excitement. Adrenaline. The emotional rush of being right. The thrill of putting on a large position and watching the market move. And excitement is almost always the enemy of consistent profitability.
At our private proprietary firm we publish a daily note every morning. It reviews the macro landscape. Interest rates. Credit markets. Commodity movements. Cross-asset behavior. We then copy the note and publish it over on GTC Traders. The purpose is simple… awareness. We don’t publish that note, to find ‘trades’. We are simply attempting to anchor us in the environment we are trading in. But we say this very clearly in every single note at GTC Traders. We do not trade off of it. The daily note is not a signal generator. It is not a trading system. It is not an instruction set for placing trades. It is simply a way to stay grounded in the landscape.
Some people probably find that boring.
But boring is often effective.
When someone asks us about high yield spreads or the Treasury curve, we do not have to pull up charts and start investigating. We already know the terrain because we look at it every single day.
And according to our heuristics, right now that terrain argues for something very specific.
Stanley Druckenmiller once said something that stuck with me.
“The way to build long-term returns is through preservation of capital and home runs.”
Right now… preservation comes first.
Interest rates alone have us somewhat befuddled. The signals across the curve are not particularly clean. Other heuristics we have described in this space are telling us to be conservative. Which means the correct posture is restraint. So we are running a number of grey box programs tuned specifically for linear return profiles. It’s not exciting or particularly flashy. Just structured processes designed to grind out consistent returns while preserving capital.
And to be honest… watching that play out day by day is not thrilling. Just like the “Daily Note” is not ‘thrilling’. The 3:00 PM Trade Review we put out each day. We go through the programs. Preset maneuvers we know we may take, or not take.
Rinse.
Repeat.
But trading is not supposed to be thrilling. Trading is about making money. And we are making money.
The way to build an exceptional track record is through disciplined processes that are often repetitive, mechanical, and occasionally dull.
Eventually the environment will change. Eventually the time will come to tune programs for more absolute return profiles. And trust us … we enjoy 30 to 50 percent years just as much as anyone.
But markets move through regimes. And right now the correct regime response is discipline. Not excitement. And most definitely not constant tinkering.
Just process.
Until next time, stay safe and trade well.
Jeff Hirsch from the Stock Trader’s Almanac @AlmanacTrader
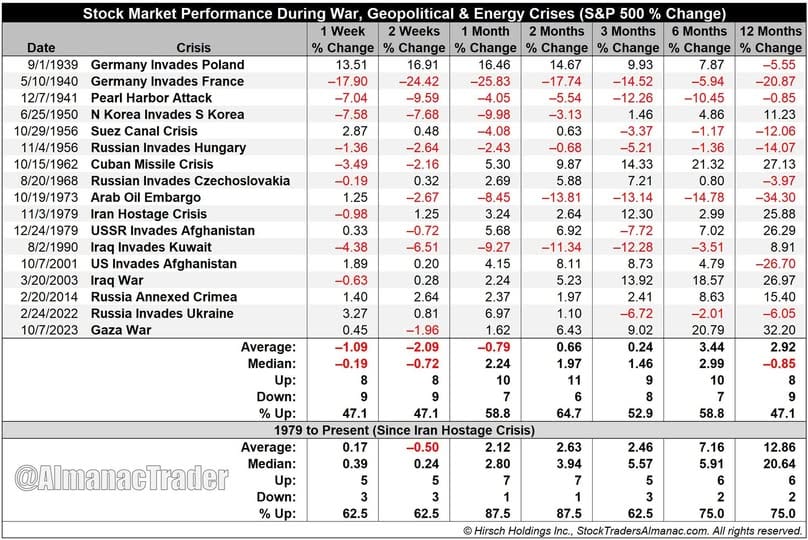
S&P 500 Performance During War, Geopolitical & Energy Crises
Resilient market holding up to Iran war. Since the Iran hostage crisis in 1979, S&P 500 has not been easily derailed by conflict, invasion and/or energy price spikes.
This is a serious geopolitical moment, and we continue to hope for safety for civilians and service members across the region. But from an investment standpoint, market moves fit squarely within the historical norms of geopolitical shocks and energy crises. So far, nothing in the market suggests this is the beginning of a major bear market or a replay of past energy crises. JeffHirsch.Tumblr
Market Recap:
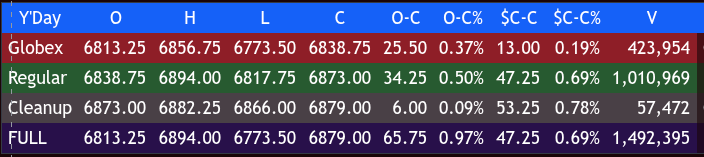
The ES traded down to 6773.50 and rallied up to 6856.00 on Globex after the NY Times reported Operatives from Iran’s Ministry of Intelligence made an indirect outreach to the CIA—via a third country’s spy agency—offering to discuss terms for ending the conflict. This happened about a day after the U.S. and Israeli strikes began. Wednesday’s regular session opened at 6838.75 after oversized Globex volume of 616k contracts traded.
After the open, the ES quickly shot up to 6858.00, sold off down to 6836.25 in the first minute, rallied back up to 6851.00, sold off down to 6818.50, traded up to 6840.00 at 9:45, sold off down to 6818.50, and rallied up to 6886.00 at 10:30. At 10:45, the ES pulled back to 6861.25, rallied up to 6892.25 at 11:00, sold off down to 6864.50 at 11:20, and rallied up to a lower high at 6887.75 at 11:45. After midday, the ES back and filled 6888.50 at 1:00, pulled back to 8876.50 at 1:20, rallied up to a new high at 8894.500 at 2:50, sold off down to 6877.25 at 3:20, and traded back up to 6889.00 at 3:40. The ES traded 6885.00 as the 3:50 cash imbalance showed $900 million to sell, and traded 6873.00 on the 4:00 cash close.
After 4:00, the ES sold off down to 6866.00, traded back up to 6882.50 at 4:50 and settled at 6876.00, up 51 points or +0.75%. The NQ settled at 25128.25, up 372 points or +1.50%, the YM settled at 48796, up 236 points or +0.49%, and the RTY settled at 2637.60, up 25.50 points or +0.89% on the day. GCG26 (gold futures) closed up 0.23%, BTH26 (bitcoin futures) closed up 7.27%, BZM26 (bond futures) closed down -0.19% (down 3 days in a row) and the DXY (US dollar index) closed down 0.28% on the day.
In the end, it was a sellable gap up that got bought with the NQ leading the other indices higher. In terms of the ES’s overall tone, it was firm but stopped at its resistance just below and above 6900. In terms of the ES’s overall trade, 616k traded on Globex and 880k traded on the day session for a total of 1.496 million contracts traded, the lowest in the last 5 sessions.
In all honesty, I have no idea how the war with Iran will end up or when it will end, and it remains front and center, but there are five key points in this fast-moving situation:
Rules were taken from the Wall Street Journal, nothing else.
-
Leadership decapitation — The killing of Supreme Leader Khamenei and other senior figures has created a major power vacuum in Tehran.
-
Iran’s retaliation — Iran launched multiple barrages of missiles and drones at Israel, U.S. assets, and Gulf states, hitting civilian and military targets.
-
U.S.-Israeli objectives — The ambitious goal is regime change or severe weakening of the Islamic Republic, including obliterating nuclear programs and military capacity.
-
Regional escalation — Attacks have spread to Gulf neighbors and other sites, with Iran targeting U.S. embassies/consulates and NATO-related areas in some reports.
-
Uncertain aftermath — Popular discontent in Iran is high due to economic woes and past suppression, but the regime’s resilience (police state apparatus) may allow it to endure despite the blows; mixed reactions among Iranians (fear, anger, or cautious hope for change).
There are more countries joining the US and Israel, but the future of Iran remains very uncertain. Will a regime change remove the ruling party, and will a more moderate government take over? I don’t have the answer to that, but what I do know is it is very volatile, and it is going to remain that way. The US has made 2,500 strikes and Iran’s ballistic missile strikes are becoming less frequent, but like I keep saying, this is far from over.
On Tap
THURSDAY, MARCH 5
8:30 am – Initial Jobless Claims
8:30 am – U.S. Productivity
8:30 am – Import Price Index
8:30 am – Import Price Index ex-Fuel
1:15 pm – Fed Vice Chair for Supervision Michelle Bowman speaks
7:00 pm – Chicago Fed President Austan Goolsbee speaks
FRIDAY, MARCH 6
8:30 am – U.S. Employment Report
8:30 am – Unemployment Rate
8:30 am – Hourly Wages
8:30 am – Hourly Wages YoY
10:15 am – San Francisco Fed President Mary Daly speaks
1:30 pm – Cleveland Fed President Beth Hammack speaks
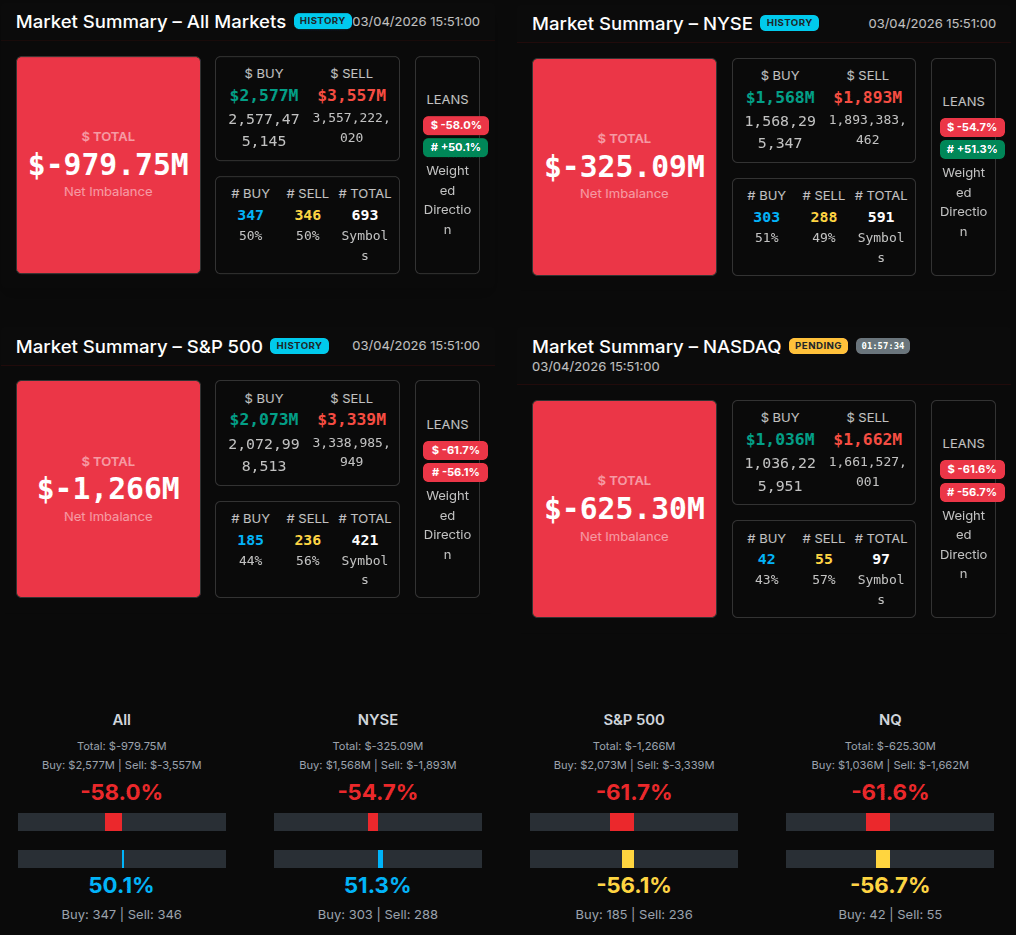
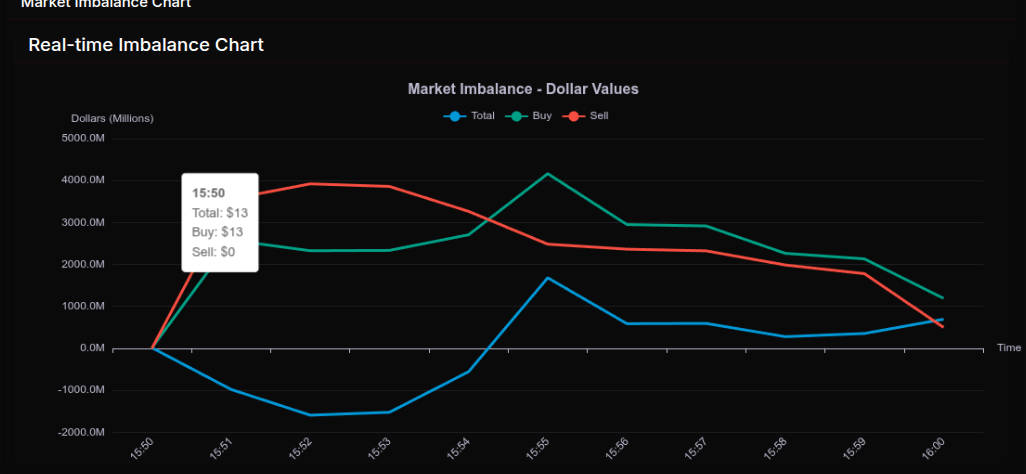
MiM
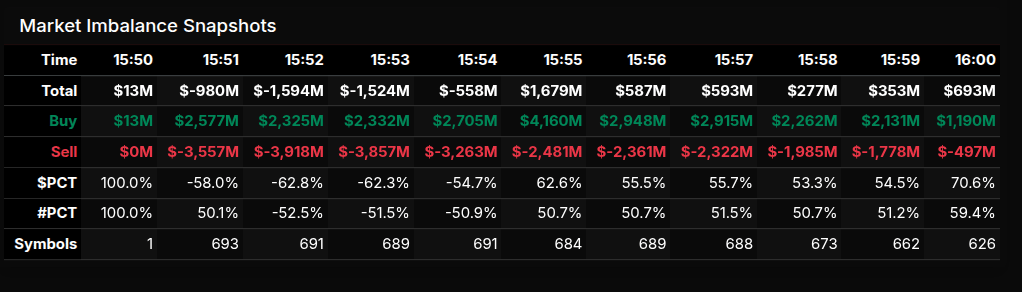
Into the 3:50 pm window, the tape started deceptively calm, printing a tiny +$13M at 15:50 before sellers hit the button hard. By 15:51, the net imbalance was roughly -$980M, and the market stayed heavy through 15:52–15:53, bottoming near -$1.59B. That early pressure carried a clear sell-tilt: All Markets showed about -58% dollar lean while the symbol-count lean was near +50%, a tell that the selling was concentrated in size rather than broad-based across names (more “tape weight” than “tape width”). The S&P and Nasdaq were the epicenter, both around -61% dollar lean in that same snapshot, flirting with wholesale sell conditions even if not quite at the -66% extreme.
The story changed quickly. At 15:54, the sell imbalance had already moderated (-$558M), then a sharp buy program flipped the tape at 15:55 to about +$1.68B with a +62.6% dollar lean. That’s not the +66% “full send” threshold, but it’s an emphatic pivot, and it reframed the close as a buy-to-neutral finish rather than a capitulation. From there, imbalances stayed positive but cooled into the bell: +$587M (15:56), +$593M (15:57), +$277M (15:58), +$353M (15:59), ending around +$693M at 16:00 with a +70.6% dollar lean.
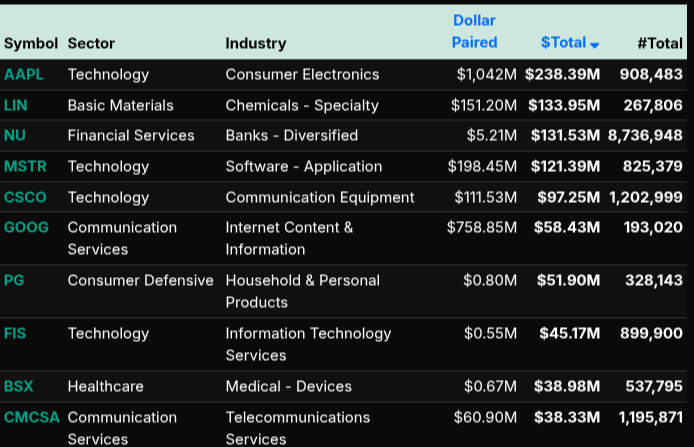
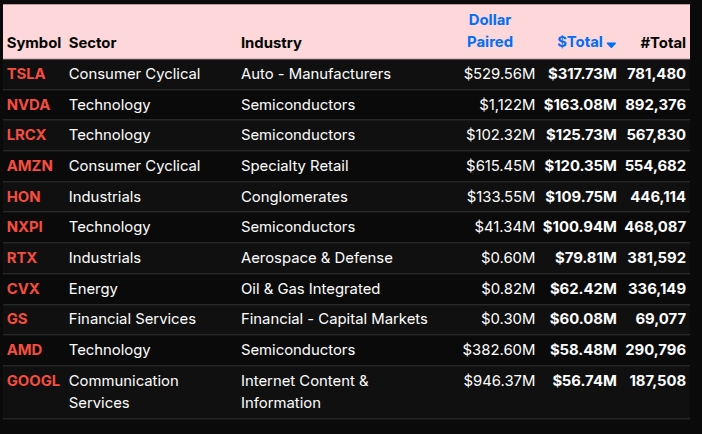
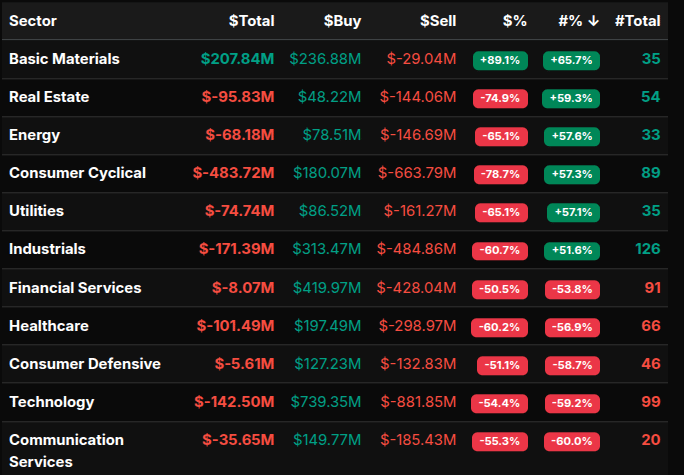
Sector flows leaned defensive/rotational early, but with clear outliers. Basic Materials was the standout bid (+$207.8M, +89% lean), while Consumer Cyclical (-$483.7M, -78.7% lean), Real Estate (-$95.8M, -74.9%), and Energy (-$68.2M, -65.1%) absorbed the brunt of liquidation. On the single-name tape, selling pressure was most notable in TSLA, NVDA, AMZN, and semis (LRCX/NXPI/AMD), while dip-buying showed up in mega-cap and quality names like AAPL, LIN, NU, MSTR, CSCO, GOOG, and PG.
Technical Edge
Fair Values for March 5, 2026
-
S&P: 7
-
NQ: 32.77
-
Dow: 42.9
Daily Breadth Data 📊
For Wednesday, March 4, 2026
-
NYSE Breadth: 67% Upside Volume
-
Nasdaq Breadth: 74% Upside Volume
-
Total Breadth: 72% Upside Volume
-
NYSE Advance/Decline: 64% Advance
-
Nasdaq Advance/Decline: 69% Advance
-
Total Advance/Decline: 67% Advance
-
NYSE New Highs/New Lows: 74 / 19
-
Nasdaq New Highs/New Lows: 98 / 102
-
NYSE TRIN: 0.89
-
Nasdaq TRIN: 0.76
Weekly Breadth Data 📈
For the Week Ending Friday, February 27, 2026
-
NYSE Breadth: 52% Upside Volume
-
Nasdaq Breadth: 55% Upside Volume
-
Total Breadth: 54% Upside Volume
-
NYSE Advance/Decline: 43% Advance
-
Nasdaq Advance/Decline: 46% Advance
-
Total Advance/Decline: 45% Advance
-
NYSE New Highs/New Lows: 446 / 178
-
Nasdaq New Highs/New Lows: 576 / 554
-
NYSE TRIN: 0.70
-
Nasdaq TRIN: 0.68

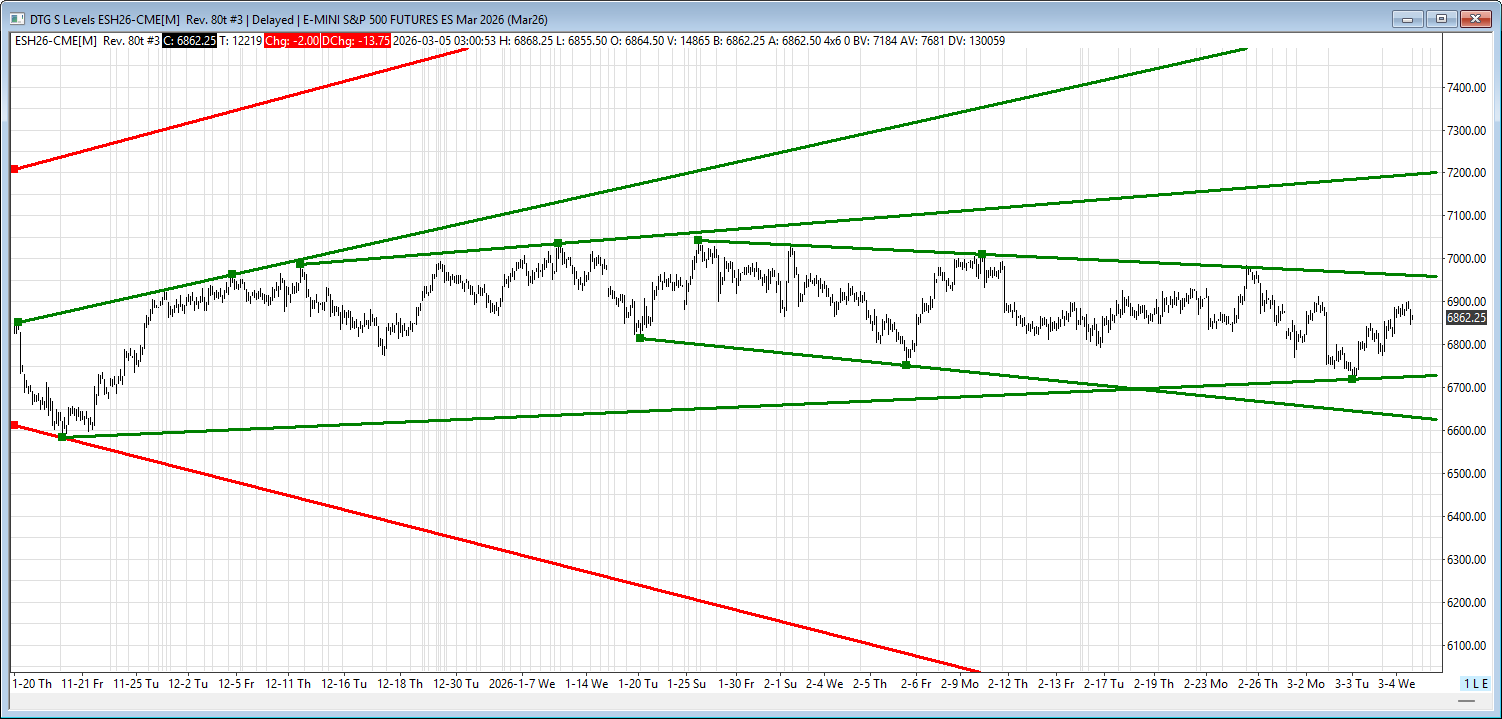
BTS Levels:
ESH2026
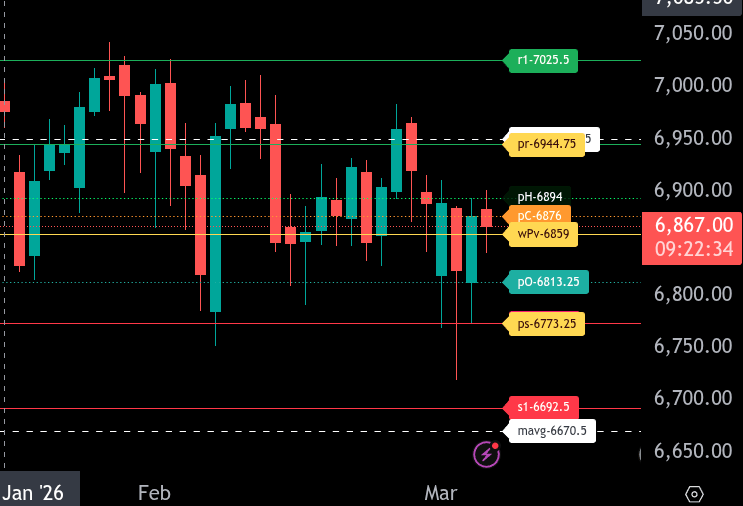
The bull/bear line for the ES is at 6859.00. Holding above this level keeps the bias constructive; losing it and failing to reclaim it turns the day back into a sell-the-rips environment.
ES is trading around 6867.50 in Globex, just above the bull/bear line. If buyers can defend 6859.00, look for a push into 6876.00 and then 6894.00. Above 6894.00, the next resistance band is 6944.75 our upper range target, with 6950.25 just above it. A clean acceptance above 6950.25 opens the door to 7025.50 as the next upside objective.
If ES slips back below 6859.00, expect downside pressure to rotate toward 6813.25. A break and hold below 6813.25 sets up the lower range target at 6773.25. If 6773.25 fails, the next major downside magnet is 6692.50.
Overall, bullish above 6859.00 with 6944.75–6950.25 as the key upside zone; bearish below 6859.00 with 6813.25 first, then 6773.25 as the main downside target.
NQH2026
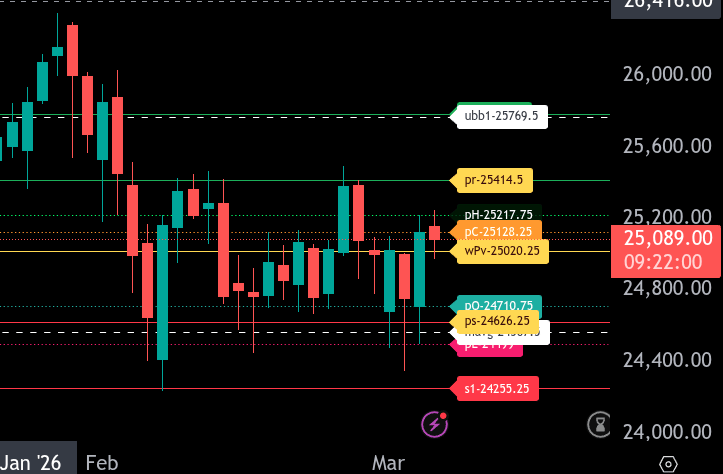
The bull/bear line for the NQ is at 25020.25. This is the key pivot for today. Holding above it keeps a bullish/buy-the-dip posture in play; losing it shifts momentum back to sellers.
NQ is trading around 25088.00 in the current Globex session, which is modestly above the bull/bear line. If price stays above 25020.25, look for rotations higher toward 25128.25 and then 25217.75. A clean break and hold above 25217.75 opens the door to 25414.50, which is the upper range target for today. If strength continues beyond 25414.50, next resistance is 25769.50 and then 25785.50.
If NQ loses 25020.25 and can’t reclaim it, expect downside pressure back into 24710.75. Below 24710.75, the lower range target is 24626.25. A break under 24626.25 can extend the move into 24567.50 and 24499.00. Deeper liquidation support sits at 24255.25.
Summary: bullish bias while above 25020.25, with upside targets of 25128.25, 25217.75, and 25414.50. Bearish below 25020.25, targeting 24710.75 then 24626.25, with lower supports at 24567.50, 24499.00, and 24255.25.
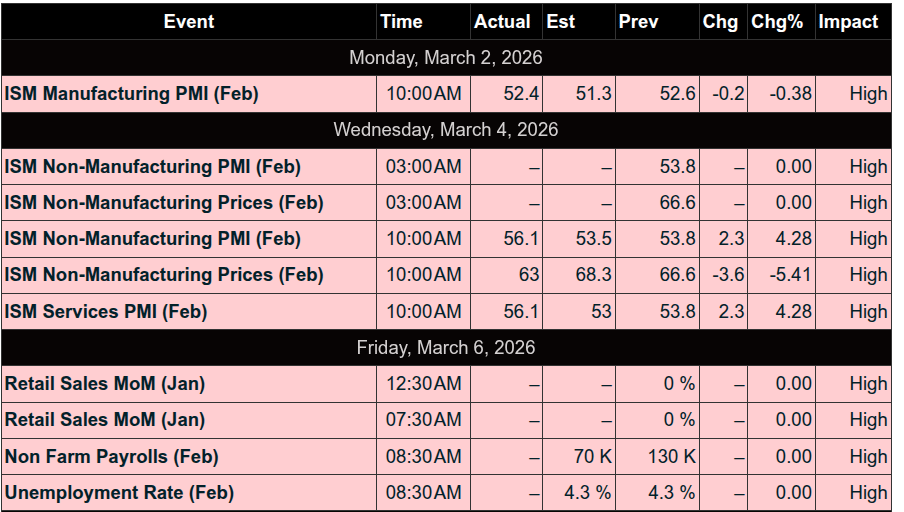
Economic Calendar Today

This Week’s High Importance
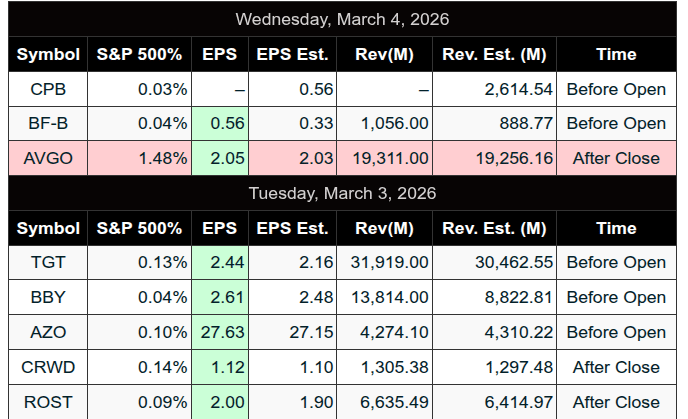
Earnings:
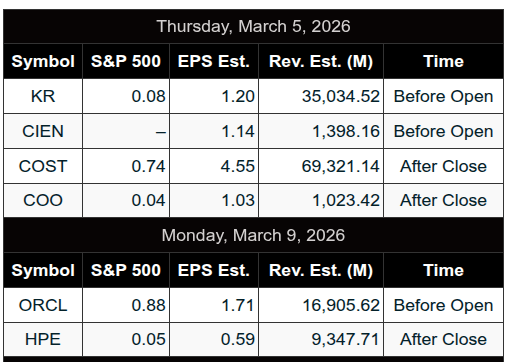
Recent
Trading Room News:
PTG Room Summary – March 4, 2026
Pre-market game plan
-
Cycle Day 3 focus: Acceptance north of 6815 ±5 was the key pivot.
-
Bull case: If buyers defended value above 6815 ±5, upside continuation stayed viable with objectives at 6840 → 6850 → 6865 (orderly, controlled tempo).
-
Bear case: If price failed to hold 6815 ±5, it opened a rotation/reset toward 6800 → 6790 → 6785 (inventory reset risk for late longs).
-
Key reference levels: PVA High Edge 6850, PVA Low Edge 6765, Prior POC 6826.
-
Standing rules: Traders stuck to Triple-A setups, managed $risk, and kept hard stops on the exchange, staying aligned with the Dominant Force.
Overnight context
-
Overnight price successfully back-tested the Cycle Day 1 low, aggressive buyers responded, and that push fulfilled the 3-Day Cycle Target (~6846.33) before the session really got going.
How the day proceeded
Morning: Buyers defended VWAP and the plan hit its targets
-
David identified an A10 pullback zone as a potential long location.
-
After the 10:00 am ISM release, the tape stayed constructive.
-
Price held a pullback into VWAP, and David noted the long lean remained intact.
-
The room then saw the primary objective play out as the DTS 6865 target was fulfilled, and David shifted focus to the next expansion levels: 6865 → 6901 → 6906.
Positive execution highlight
-
David executed cleanly with a first pullback ATR long, essentially “marching” with the dominant direction instead of chasing.
-
Peter shared a SIM trade and good trade management: scaling out T1/T2 and keeping a runner, reinforcing that structure and patience often added the most when the market extended.
Midday: 6885 acted like a ceiling and patience mattered
-
As price pressed higher, David emphasized that bulls still needed to break through 6885 and convert it into support.
-
The room described it as a “naval blockade” at the 85 level, matching the stall.
-
David observed there was no urgency to go after nearby liquidity—an environment where forcing trades usually underperformed simply waiting for clearer acceptance or rejection.
Afternoon / final hour: Strength held, but overtrading risk increased
-
David returned for the final hour and noted bulls were still hanging near the highs, trying to carry strength into the close.
-
He reinforced a key discipline point: there wasn’t a consistently compelling reason to trade past noon, and it “should have been a half-day” type of session once the best opportunities had already paid.
-
Into the close, the room noted a MOC sell imbalance around $900M, which helped explain late-day pressure/flow risk.
Best lessons from the day
-
The 6815 ±5 pivot kept traders anchored to structure instead of emotion.
-
VWAP pullback holds supported higher-probability longs versus chasing highs.
-
Hitting 6865 was a cue to raise standards, not increase activity.
-
When 6885 stalled price, waiting beat forcing.
-
Stopping earlier protected gains after the primary move had already delivered.
DTG Room Preview – Thursday, March 5, 2026
-
Theme / Macro driver
-
Market focus remains on the Middle East conflict
-
Day 6 of US/Israel–Iran conflict; attacks spreading across the region
-
NYT: Iranian leaders reportedly reached out to Trump for ceasefire talks
-
Trump offering naval escorts for tankers through the Strait of Hormuz → eased oil supply concerns
-
Risk watch: South Korean lawmaker warned conflict could disrupt key semiconductor-material supplies
-
South Korea manufactures ~2/3 of global semiconductors (per note)
-
-
-
China / geopolitics
-
Xi–Trump expected to meet in a few weeks (first time since 2017)
-
China held a large delegate meeting (~2,900) tied to approving the next “Five-Year Plan”
-
China growth slowing while India has surged to fastest-growing major economy
-
Despite tariff tit-for-tat and record trade surplus, China facing:
-
weaker domestic demand / consumer confidence
-
declines in housing, manufacturing, and infrastructure investment (last year)
-
-
-
Single-name / sector headlines
-
Alibaba (BABA)
-
Head of AI modeling Junyan (Justin) Jin resigned from Qwen
-
Departure post drew strong open-source support; BABA -5.3% in Hong Kong (per note)
-
Jin previously warned Chinese firms unlikely to surpass OpenAI/Anthropic due to differing R&D focus
-
-
Nvidia (NVDA) / Semi
-
NVDA reportedly stopped production of H200 chips intended for China
-
Asked TSMC to reallocate capacity toward Vera Rubin chips
-
Jensen Huang hinted NVDA may stop investing in OpenAI/Anthropic as IPO funding becomes likely
-
Note also mentioned recent licenses for limited H200 shipments to approved China customers
-
-
-
Earnings
-
Premarket: BABA, BILI, BJ, BURL, CNQ, CIEN, JD, KR
-
After the bell: COST, MRVL, PBR, COO, GAP
-
Friday AM: no earnings of interest (per note)
-
-
Economic calendar
-
7:30am ET: Challenger Job Cuts
-
8:30am ET: Unemployment Claims, Import Prices (15d), Nonfarm Productivity (28d), Unit Labor Costs (28d)
-
Friday: February Jobs Report = main event of the week
-
-
ES / volatility / positioning
-
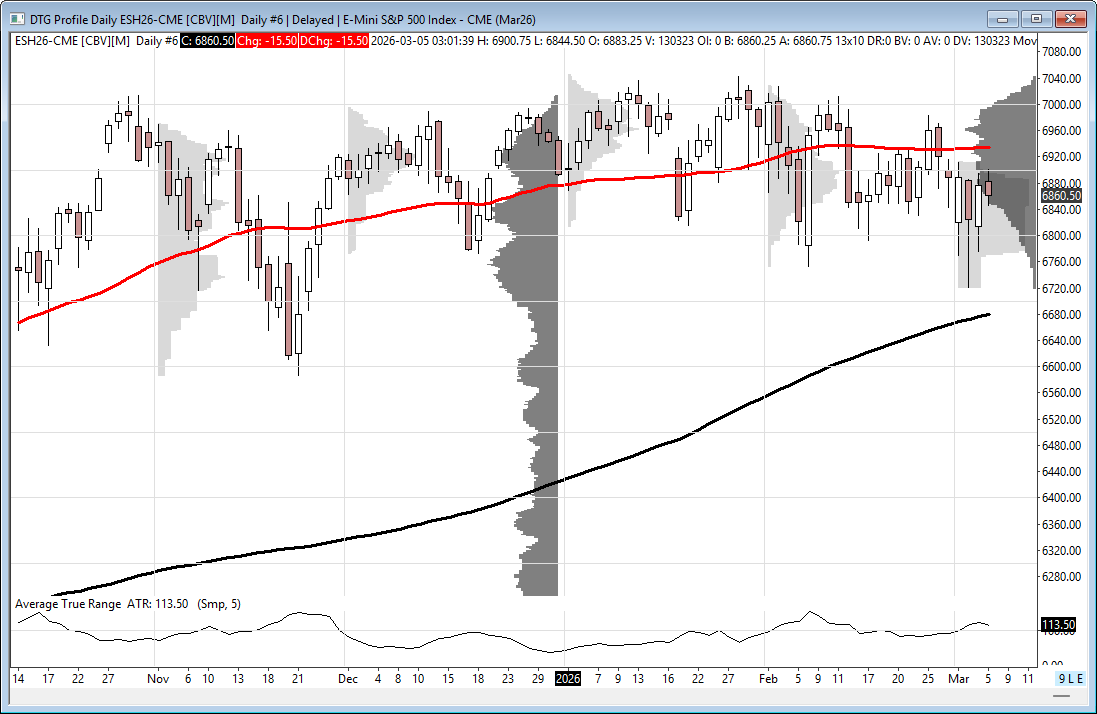
Volatility high but starting to plateau
-
ES still in a 4-month sideways consolidation under ATHs
-
ES 5-day ADR ~122.25 points (elevated on Iran conflict fears)
-
“Whale bias” leaning bullish into 8:30am ET data; overnight large-trader volume relatively light
-
-
ES technical levels
-
ES remains below 50-day MA (6934.25) → “loose” resistance overhead
-
Short-term downtrend channel top 6961/56s = resistance zone in play today
-
Bears have room down toward intermediate uptrend channel bottom 6728/33s
-
-
Potential trendline levels
-
TL Resistance: 6961/56s, 7205/10s
-
TL Support: 6728/33s, 6628/23s
-
Affiliate Disclosure: This newsletter may contain affiliate links, which means we may earn a commission if you click through and make a purchase. This comes at no additional cost to you and helps us continue providing valuable content. We only recommend products or services we genuinely believe in. Thank you for your support!
Disclaimer: Charts and analysis are for discussion and education purposes only. I am not a financial advisor, do not give financial advice and am not recommending the buying or selling of any security.
Remember: Not all setups will trigger. Not all setups will be profitable. Not all setups should be taken. These are simply the setups that I have put together for years on my own and what I watch as part of my own “game plan” coming into each day. Good luck!
This post goes out as an email to our subscribers every day and is posted for free here around 2 PM ET. To get your real-time copy, sign up for the free or premium version here: Opening Print Subscribe.
Comments are closed