This post goes out as an email to our subscribers every day and is posted for free here around 2 PM ET. To get your real-time copy, sign up for the free or premium version here: Opening Print Subscribe.
Follow @MrTopStep on Twitter and please share if you find our work valuable!
Our View
It seems to me that when the CL falls, the ES goes up, and when the CL goes up sharply, the ES falls — or does it? It sometimes works that way, but not always.
I remember there have been times in the past when crude oil was firm, and the ES went for the ride, like in periods of quantitative easing (like 2009–2013) or certain recoveries. The correlation has been strongly positive (e.g., up to +0.7 in rolling windows), as both benefit from liquidity and growth signals.
Pre-2009, it was often near zero or occasionally negative, with the old view that higher oil hurts consumers and non-energy companies (acting like a tax on the economy). But now my observed pattern holds in certain high-stress, geopolitically driven environments (like now, with oil volatility extreme and inverse correlation very strong), but it’s not a permanent truth across all market conditions.
The link is “complicated” and context-dependent—watch the cause of oil’s move (supply shock vs. demand strength) for better clues on how ES might react. If oil stays elevated long-term due to ongoing conflict, it could pressure stocks more broadly via inflation and growth hits, but history shows stocks often weather moderate spikes without major damage.
Over the last 5 sessions, the ES is down 1.86%; over the last month, it’s down 4.12%; and YTD it’s down 4.95%. The NQ is down slightly more: over the last 5 days it’s down 2.25%, over the last month it’s down 3.45%, and YTD it’s down 6.58%.
Our View
So far, I have been right, Iran is not backing down, and I don’t think it will anytime soon. So far, there have been some good sell-offs, and there have also been some good dead cat bounces. While it doesn’t seem like the end of the war is in sight, what if it is?
There have been stories that Iranian advisors have reached out to intermediaries about conditions the US and Israel must meet to end the war, but all three say they have no interest, as Israel invades Lebanon and opens a new front against Iran. Germany, Australia, and Japan say they won’t be joining U.S. efforts, and the U.K. and France say they are willing to discuss options.
I’m not sure what to say other than this is a big mess that will continue to cast dark clouds over the S&P and global markets.
The chart below is a 2-Hour 15-day $SPX, XLE (crude oil ETF) and JET (US Global Jet ETF)
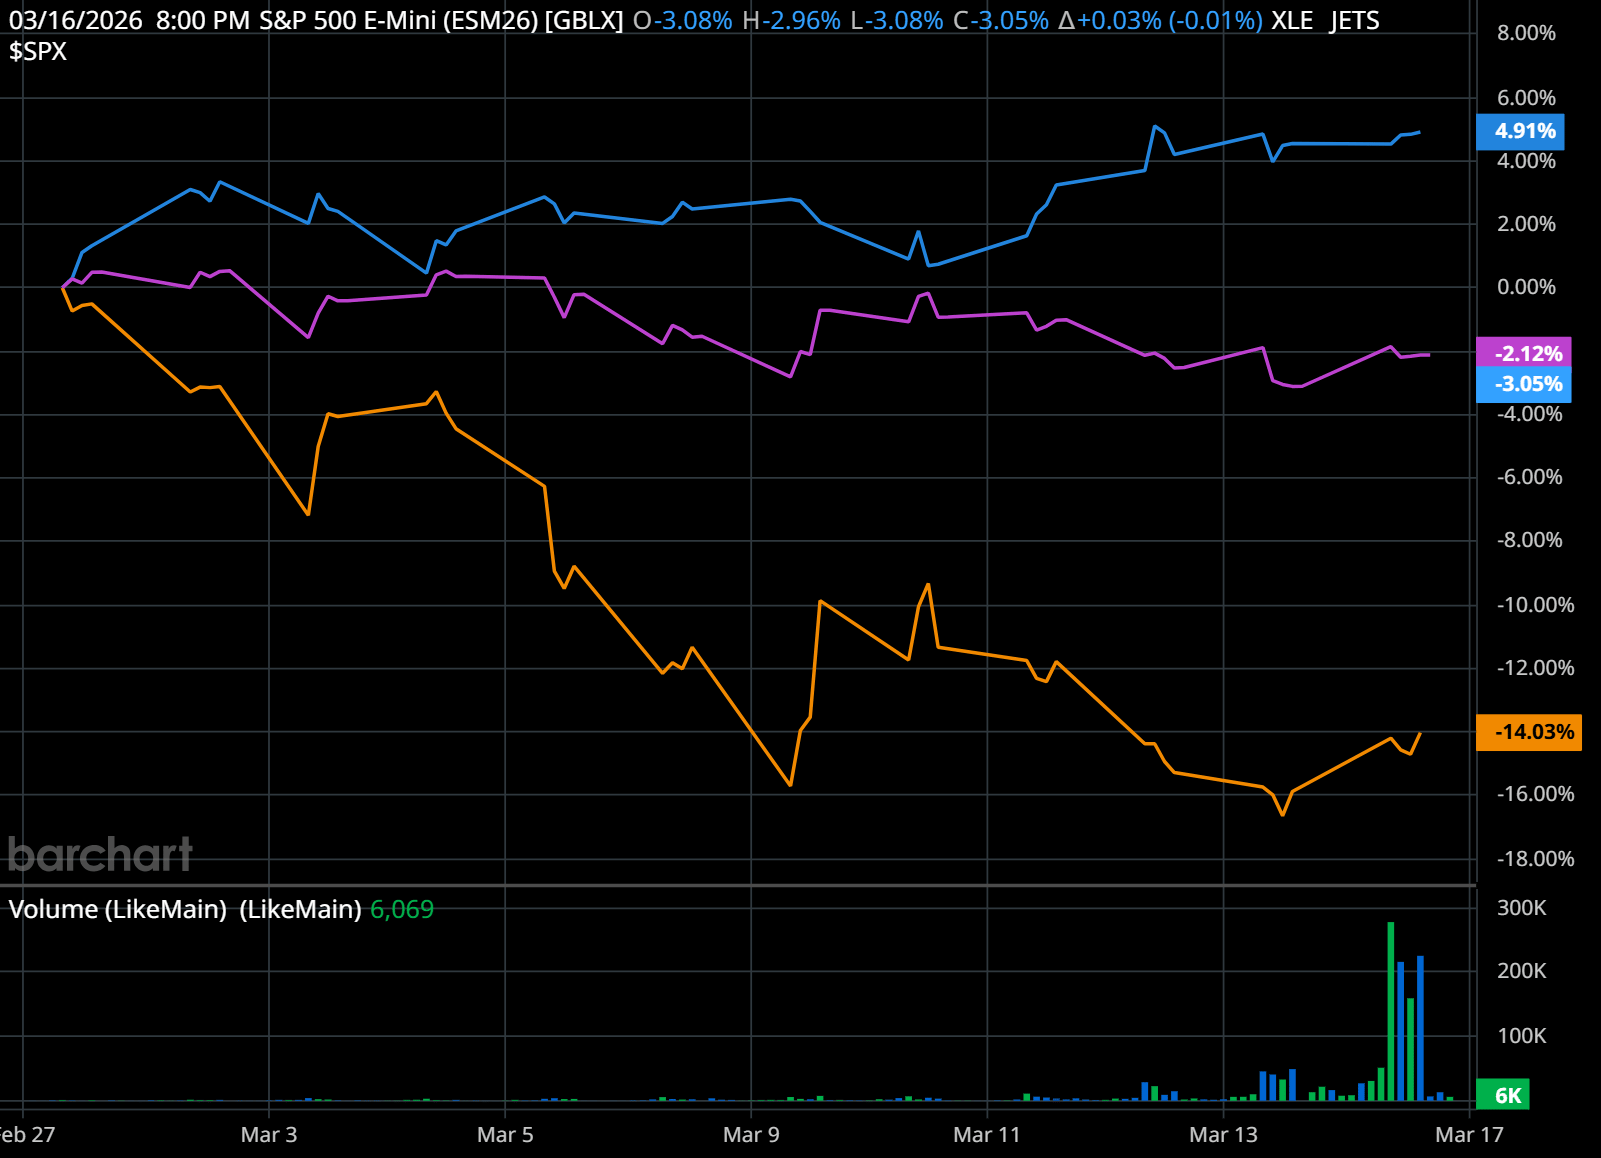
As you can see, this is a pretty ugly chart and not moving in a good direction. I try my best to remain upbeat, but there is not much to cheer about… even on winning days.
What we do know is that the Fed isn’t going to cut interest rates anytime soon. In fact, Monday showed a roughly 33% chance that the Fed won’t cut rates at all this year, according to CME Group. That was down from 39% on Friday but up from 4% at the end of last month.
I don’t have much else to say that I haven’t said.
Our Lean
As you can see from my good friend Jeff Hirsch’s piece about St. Pat’s Da’s Day, in the 11 times since 1950 that St. Patrick’s Day landed on a Tuesday, 9 of the last 11 have been up, with an average gain of 1.17%.
I hope he’s right, but it’s going to require the luck of Riley, and I must remind you I don’t drink green beer.
Our lean: That all said, I’m still a very pessimistic bull that believes all the bounces we have seen have been dead cats. If the ES gaps higher today, especially if we see high Globex volume, I’m a seller who would look to buy weakness if it feels like 40 or 50 points.
Always remember… Hope is not an option in trading, but proper risk management is.
CTAs (Commodity Trading Advisors, i.e., systematic trend-following funds) are reportedly shifting aggressively toward short positions in global equities, driven by recent market dynamics.
Key points from the post:
-
“Red wave”: This refers to a strong sell-off or downward momentum in equities, triggering CTA models to flip from long/neutral to short. It’s described as the cohort becoming net short by week’s end for the first time since “liberation day.”
-
1-week flat tape scenario: CTAs would need to sell ~$66 billion in global equities if markets trade sideways.
-
1-month flat tape scenario: This escalates to ~$91 billion in selling if the tape remains flat, pushing CTAs to net short global equities overall.
This aligns with broader recent reports on CTA positioning. Trend-following strategies have been de-risking rapidly due to volatility, rising yields, elevated energy prices, and breaches of key technical thresholds in indices like the S&P 500 and Nasdaq.
Banks like Bank of America and Goldman Sachs have flagged similar flows. CTAs started recent periods with sizable net long exposure (e.g., ~$180bn in some estimates) but have flattened or gone slightly short in spots via concentrated selling, especially in Europe, EM, and US tech-heavy names.
In flat or unchanged scenarios, systematic funds are modeled as net sellers across horizons, with weekly estimates in the tens of billions (some sources cite figures close to $66bn for 1-week flat, matching your post).
Shorter-term models have likely already flipped short, while longer-term ones hold residual longs but could add to selling pressure if the “red wave” persists.
This creates potential downside momentum: CTAs mechanically sell into weakness (or flat tape) as stops and trend signals trigger, which can amplify moves in already choppy or overbought conditions.
If this plays out (especially the flat-tape selling), it could pressure indices lower in the short term, as forced and algorithmic flows outweigh dip-buying in thin conditions. Watch for confirmation in futures positioning data or bank flow updates from Goldman and BofA.
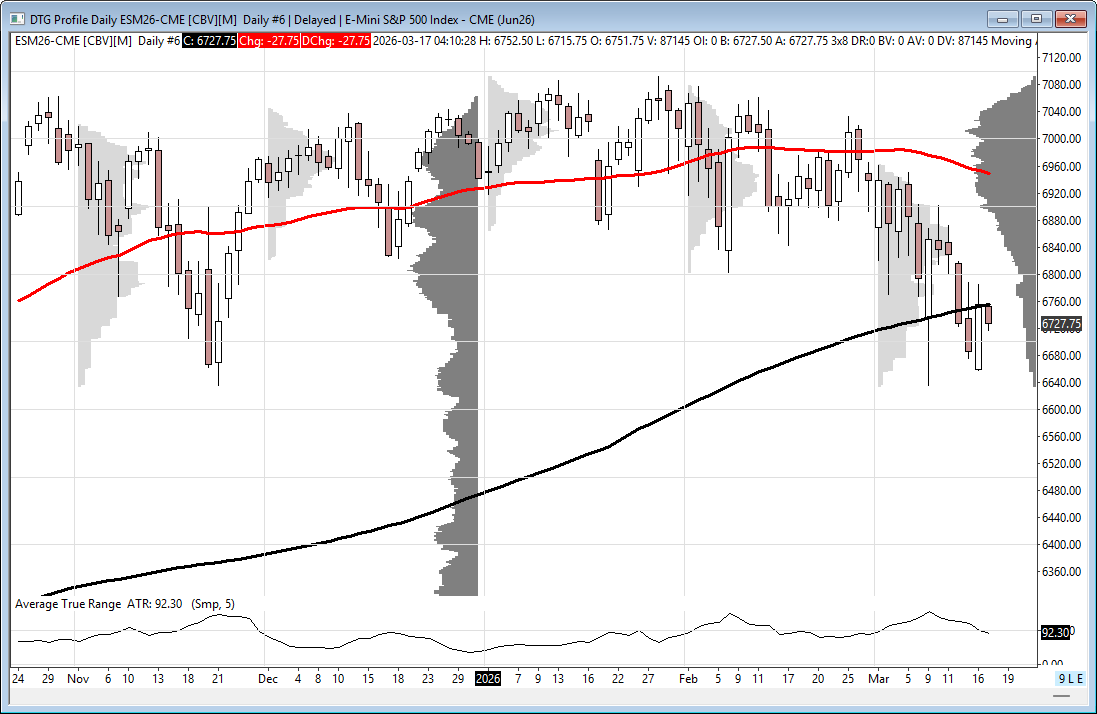
Claude AI ESM26 Expanded Market Profile & Structural Levels
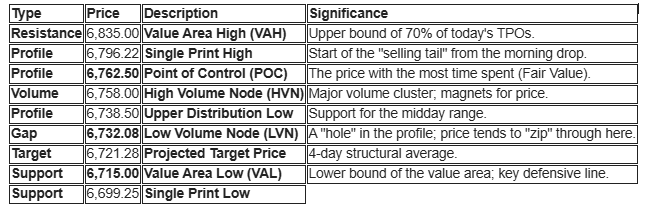
Structural Analysis for Today
-
The “Double Distribution” Setup: Yesterday’s profile is split. The market found value at 6,762.50, but the late-day slide into 6,738.50 created a secondary lower distribution. If we open below the 6,732.08 LVN, expect a fast move to test the VAL at 6,715.00.
-
The Single Print Zone (6,785 – 6,796): This area represents an “imbalance” where the market moved too fast for two-way trade. If we rally, expect heavy resistance at 6,796.22, as trapped sellers look to exit at breakeven.
-
Sentiment Shift: We are currently trading in the Lower Distribution. This is a bearish “Value Migration” lower. Bulls need to reclaim the POC (6,762.50) to stabilize the trend.
-
Trader’s Note: The distance between the POC (6,762.50) and the Latest Price (6,738.50) shows significant “overextension” to the downside. A mean-reversion move back to the POC is the high-probability play if the Pivot Point (6,732.08) holds on the open.

Guest Posts:
From Jeff Hirsch from the Stock Trader’s Almanac @AlmanacTrader
May Irish Eyes Smile on Wall Street ☘️
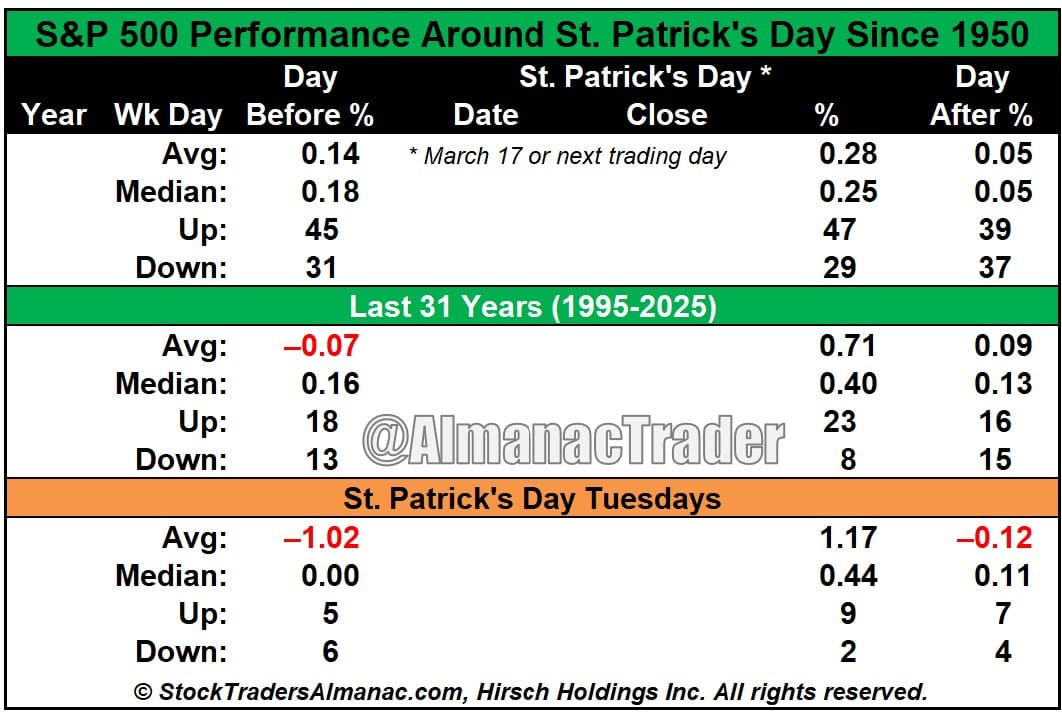
Seasonality around Saint Patrick’s Day has historically been favorable for the S&P 500.
Since 1995, the S&P 500 has finished higher 23 of the last 31 St. Patrick’s Day sessions, with an average gain of +0.71%.
Looking further back to 1950:
• St. Patrick’s Day: Avg +0.28%
• Day Before: Avg +0.14%
• Day After: Avg +0.05%
There’s also an interesting wrinkle this year: the holiday falls on a Tuesday. In the 11 years since 1950, when St. Patrick’s Day landed on a Tuesday:
• Up 9 times
• Average gain: +1.17%
The surrounding days have been more mixed:
• Mondays before: Up 5 / Down 6, Avg –1.02%
• Wednesdays after: Up 7 / Down 4, Avg –0.12% (skewed by the –5.18% Covid selloff in 2020)
With the first half of March coming in like a lion, perhaps a little luck o’ the Irish can help steady the tape.
Tom Incorvia – Blue Tree Strategies
On February 28th, headlines reported that the United States and Israel had launched airstrikes against Iran. The immediate reaction in the commodity markets was dramatic. Crude oil surged from the February 27th close of $67.32 to roughly $119 within six trading days, a move consistent with the market pricing in potential disruption to global energy supply and heightened geopolitical risk.
However, the reaction in the equity markets has been far more restrained, creating an interesting divergence. The S&P-500 ETF — SPDR S&P 500 ETF Trust — is down only about 2.5% since the start of the conflict, highlighting a notable degree of resilience in the broader equity market. In the face of a geopolitical shock that has driven a historic surge in crude oil, a relatively modest pullback in the SPY suggests that institutional capital has not yet interpreted the situation as a systemic risk event. From a technical standpoint, the limited downside response indicates that the broader market may still be viewing the situation as a contained geopolitical flare-up rather than the beginning of a prolonged global conflict.
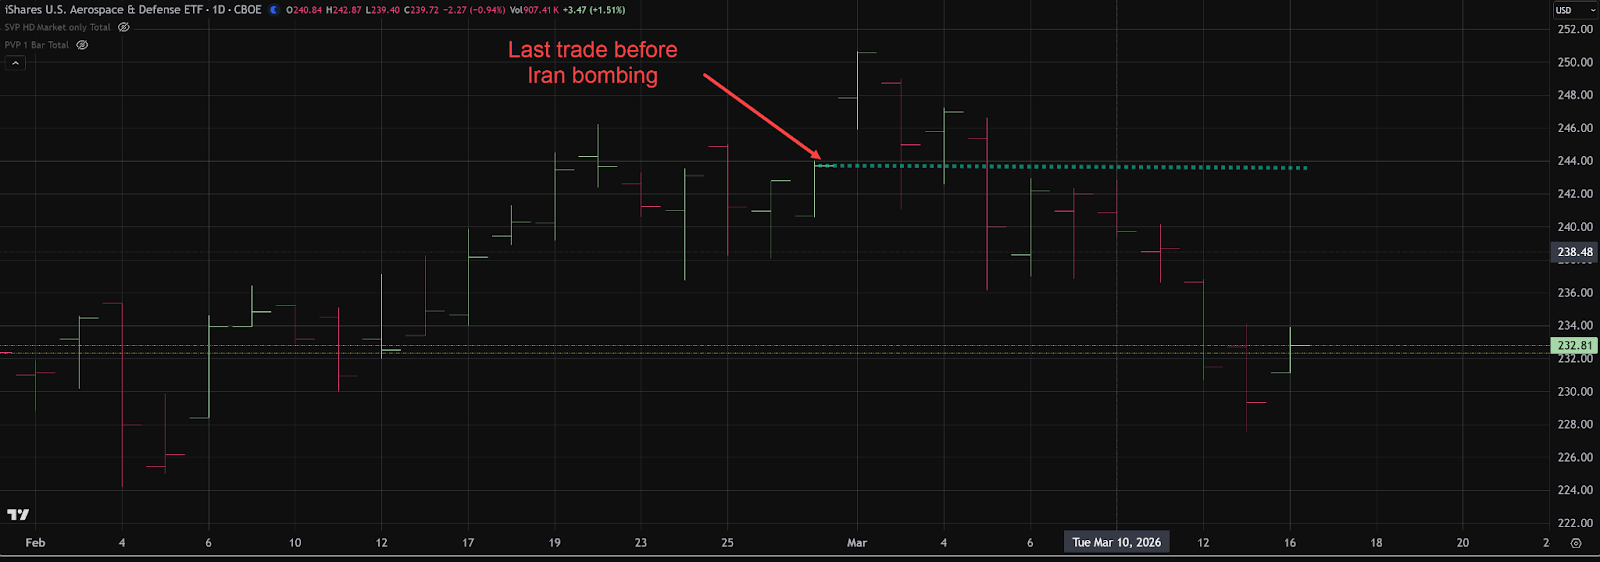
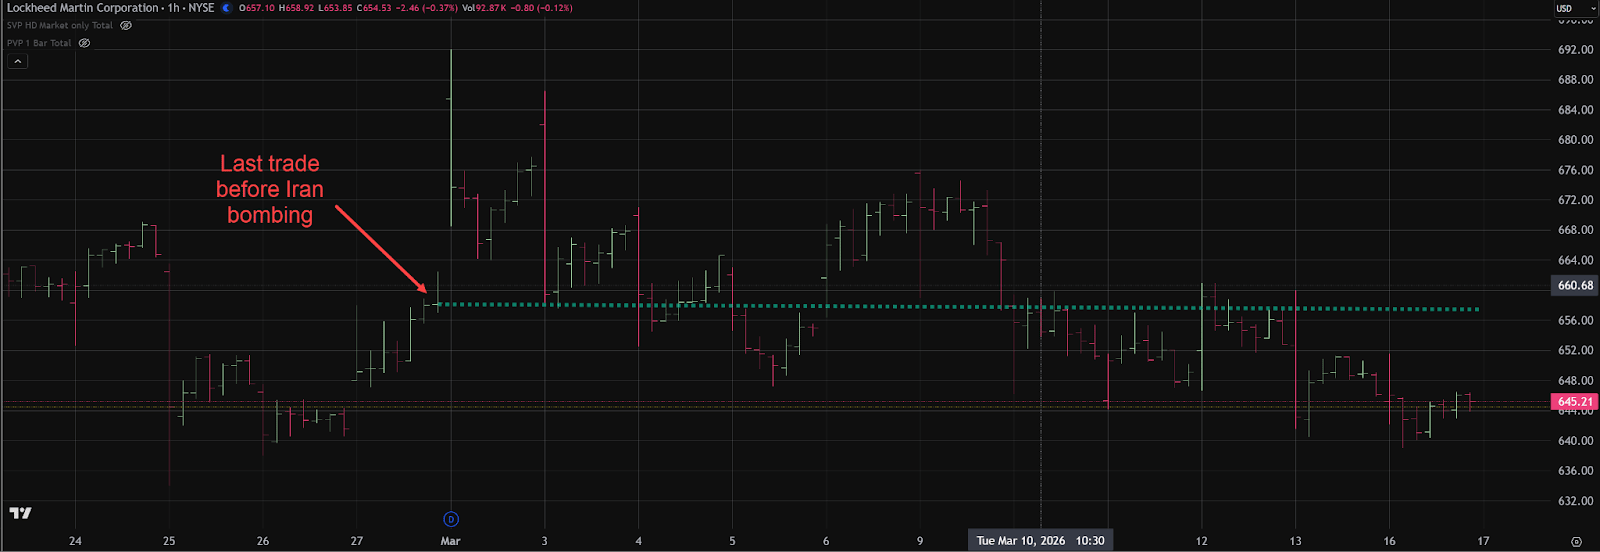
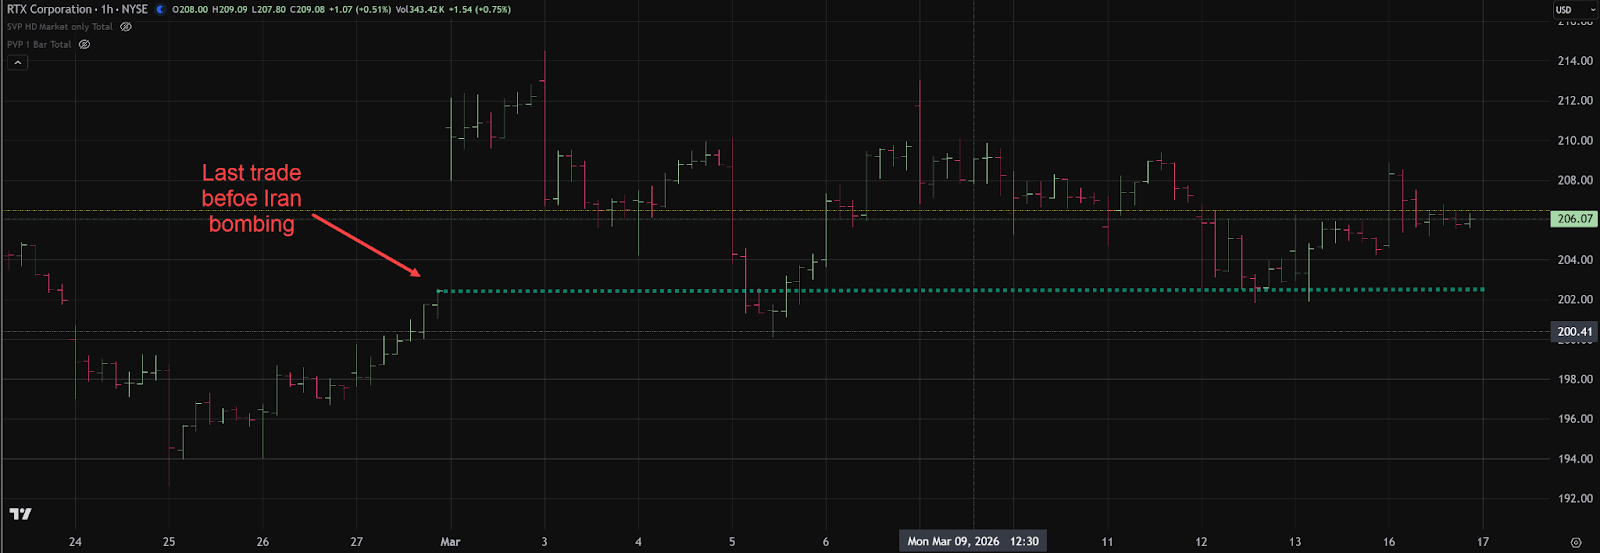
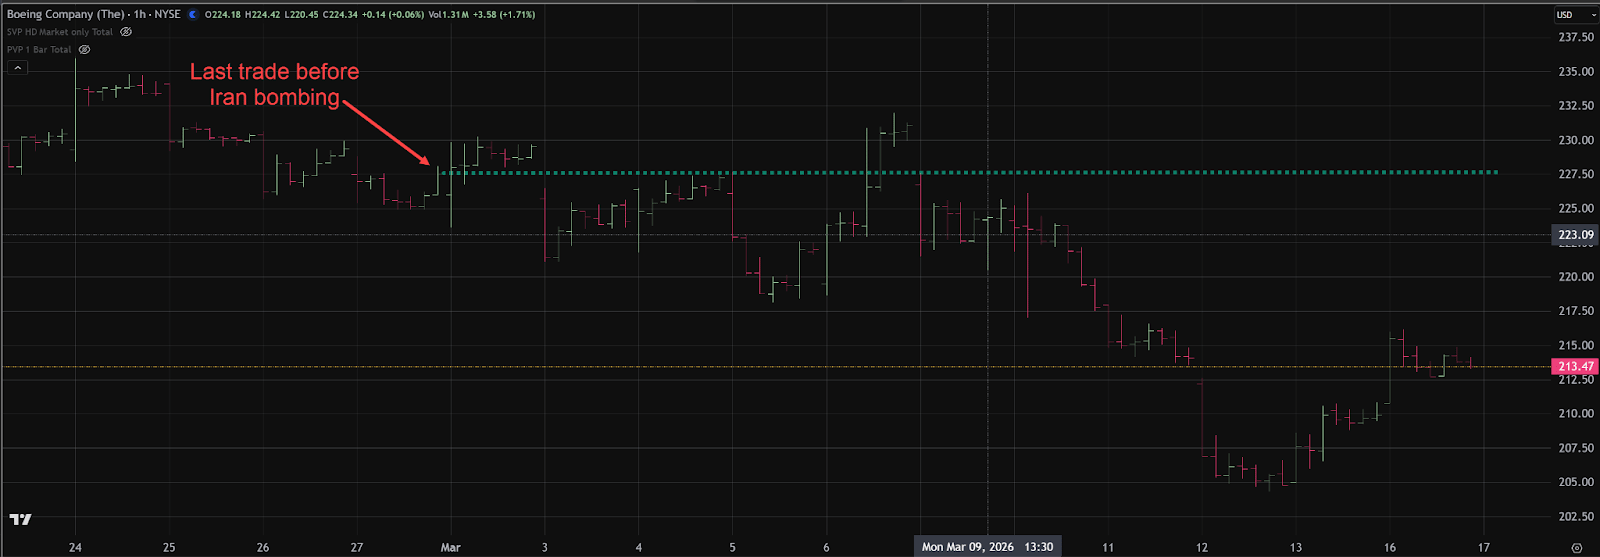
An even more notable divergence appears within the Aerospace and Defense sector, which historically attracts inflows during periods of escalating geopolitical tension. The iShares U.S. Aerospace & Defense ETF — iShares U.S. Aerospace & Defense ETF — is down approximately 4.5% since the conflict began, indicating that institutional capital has not aggressively rotated into the sector.
Looking at several of the largest weighted components within ITA reinforces this lack of confirmation:
-
Lockheed Martin: –2.0%
-
RTX Corporation: +1.7%
-
Boeing: –6.0%
You can purchase Tom’s Course on Volume Profile here.
Manny Payano – @manny_trends
The Case for ES 7450-7500 (Updated)
I know I am probably going to catch some heat for this after last week’s price action, but that usually comes with the territory when you try to look past the last candle.
Markets rarely move in straight lines, but they do tend to move in recognizable rhythms.
One pattern that has stood out to me since the COVID lows is the way this bull market has advanced. We have seen strong rallies followed by meaningful pullbacks that reset positioning before the next leg higher begins.
What is interesting is that those pullbacks have consistently landed near the same level.
The 50% Fibonacci retracement.
And each time that reset occurred, the market eventually pushed to a new extension higher.
That pattern has now played out more than once in this cycle.
And that matters.
A Pattern the Market Has Repeated
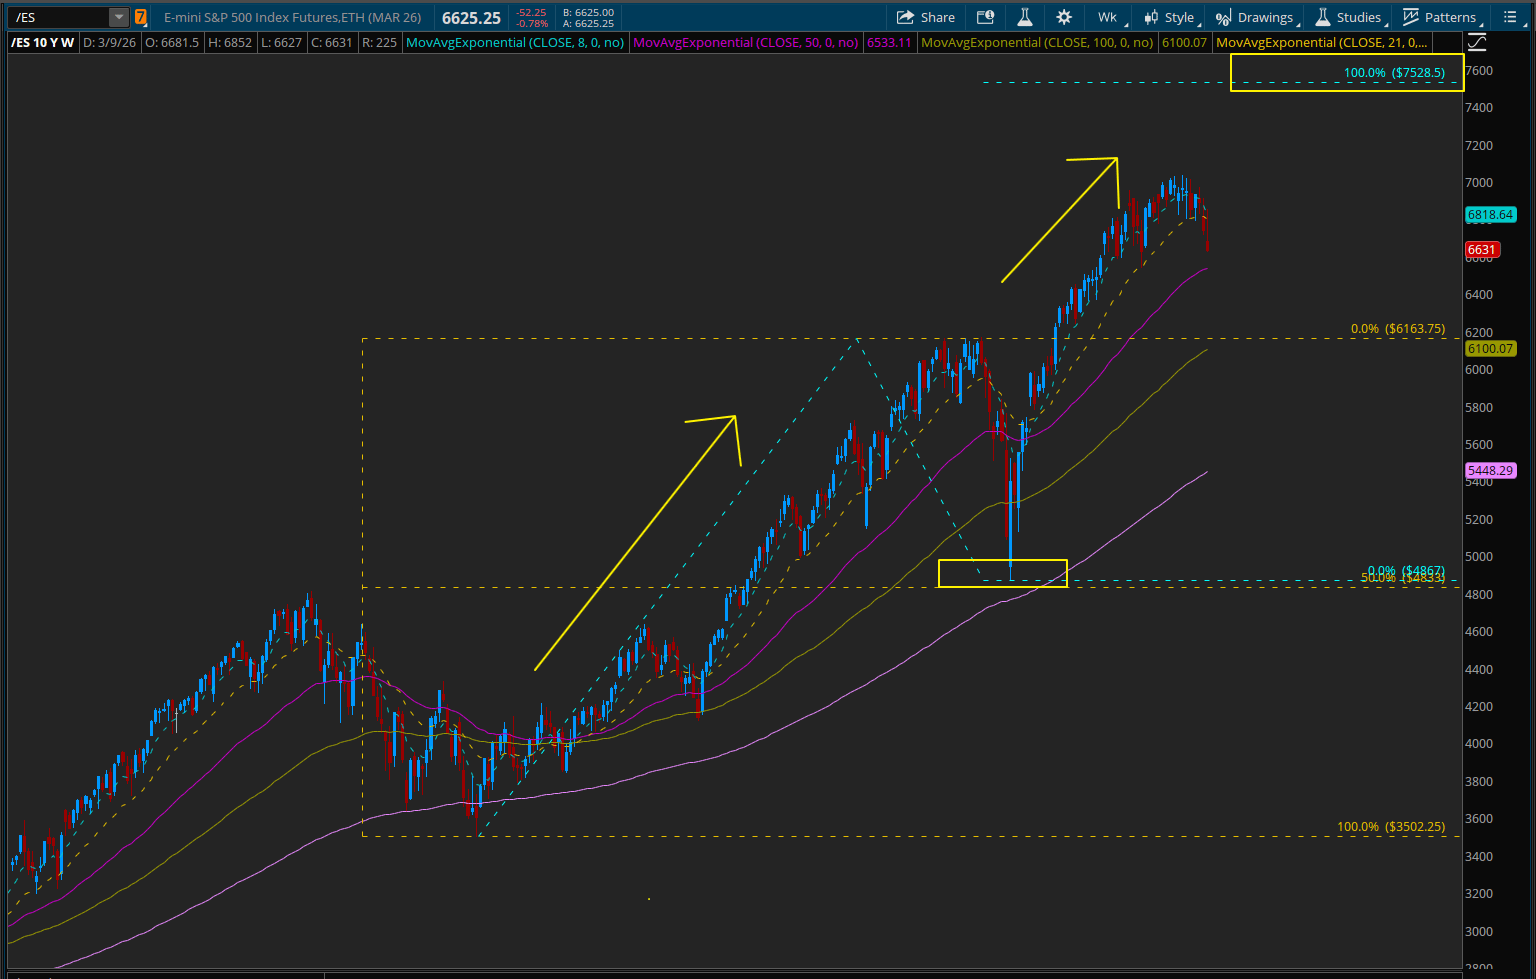
Starting from the COVID lows, the market rallied aggressively before pulling back roughly 50% of the prior advance. After that reset, the next leg carried price to a full 100% extension of the move.
We saw that behavior following the COVID recovery phase.
Then we saw it again after the 2022 bear market reset.
Strong advance.
Meaningful retracement.
Then continuation to new highs.
Markets evolve, but they also have a funny habit of repeating themselves.
When the same structural rhythm shows up multiple times within the same bull market, it tends to get my attention.
The Measured Move Target
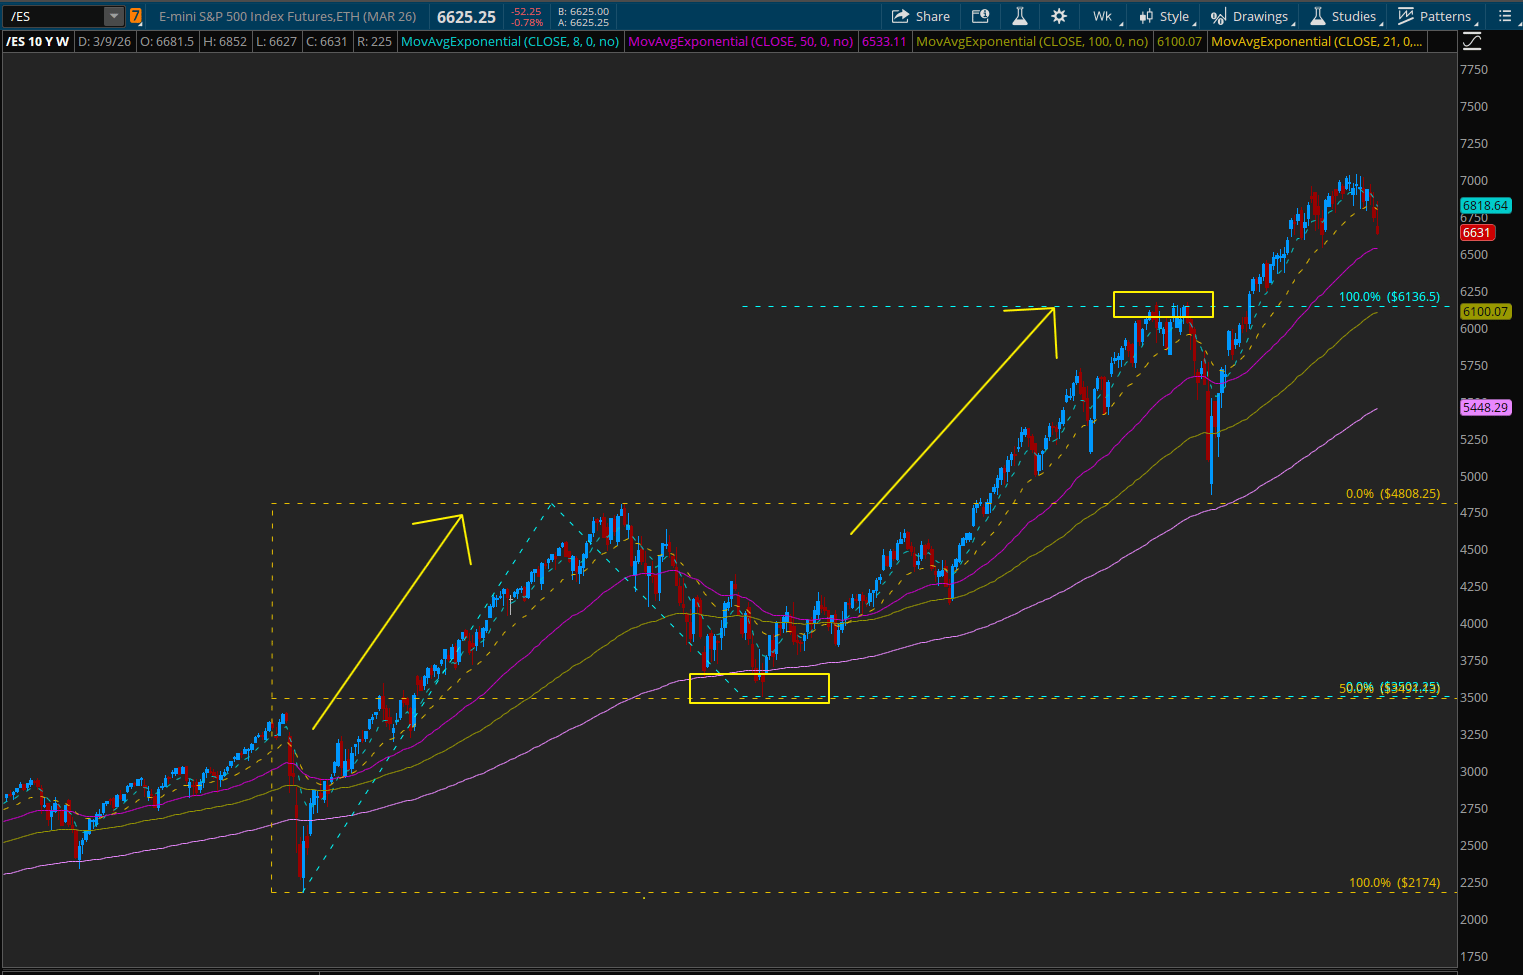
If the current cycle continues to follow the same structure, the measured move projection continues to point toward the ES 7450-7500 region.
That level represents the next logical extension based on the magnitude of the previous legs higher.
Of course, markets do not move in straight lines. They never do.
But when multiple cycles inside the same trend produce similar extensions, it creates a roadmap that deserves attention.
Markets have a funny way of repeating themselves.
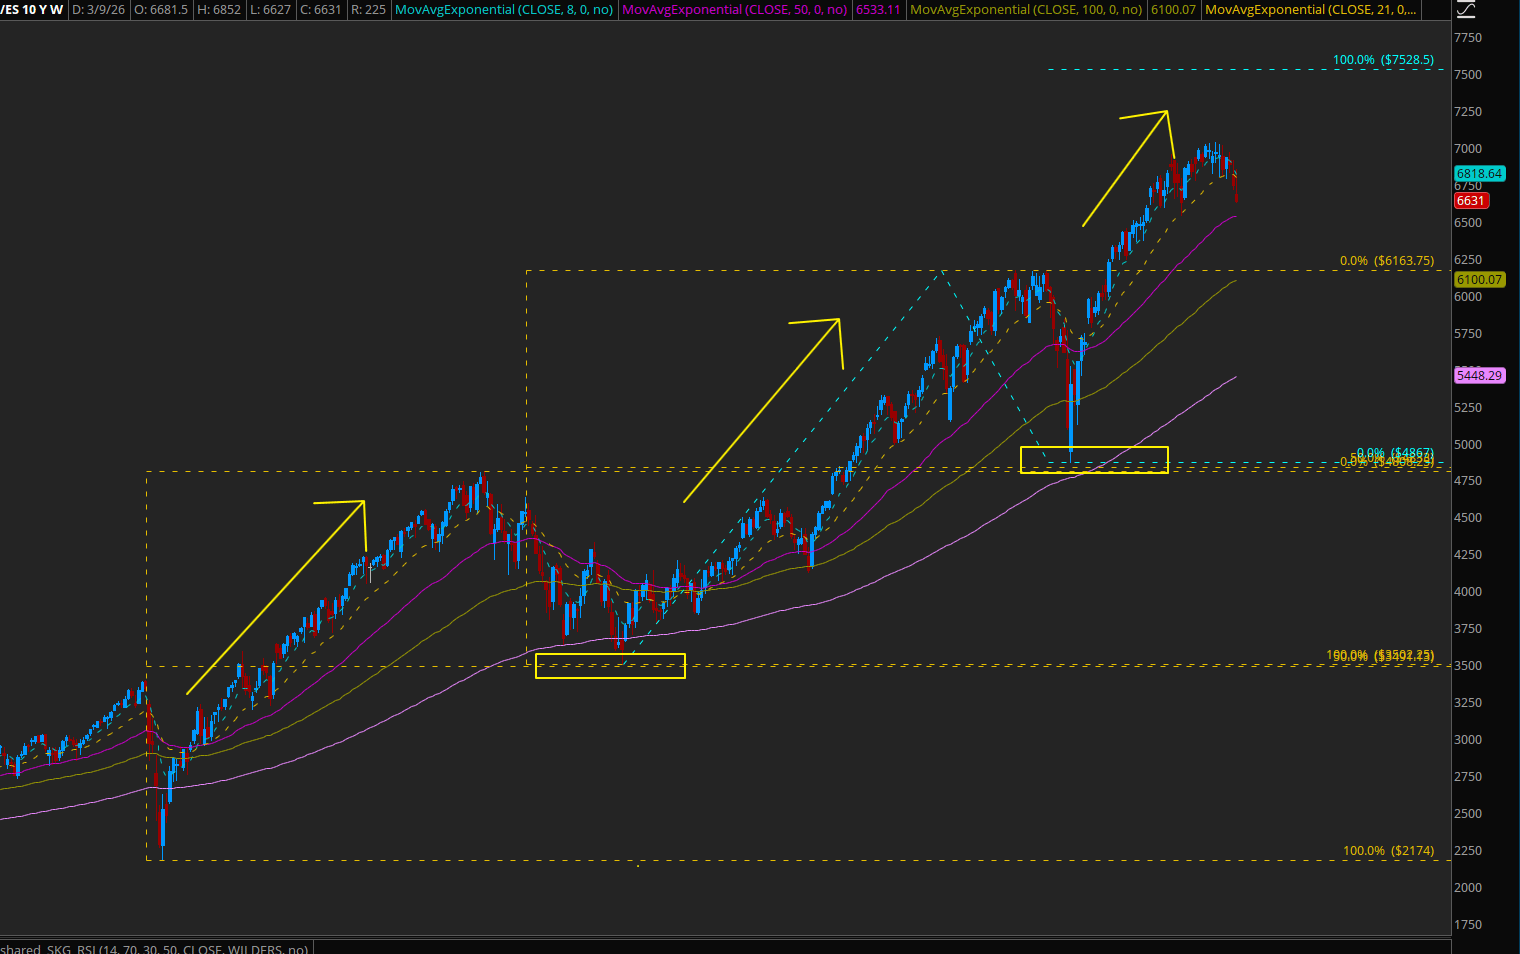
Looking at the broader structure, the recent pullback does not necessarily invalidate the larger trend structure.
Instead, it may represent another reset within the bull market, similar to the pauses we have seen during previous legs higher.
That does not mean we buy blindly.
But it does suggest the possibility that the recent markdown is more about positioning and volatility resets than a structural shift in the long-term trend.
ES is roughly 5.75% off the highs, and given the backdrop, that is actually a fairly controlled pullback. With the Iran conflict escalating and oil ripping more than 30% in just a couple of weeks, you could argue the index has held up better than many would have expected.
Markets have a way of doing that.
They move the furthest in the direction that the fewest people are positioned for.
Elliott Wave Perspective (Updated)
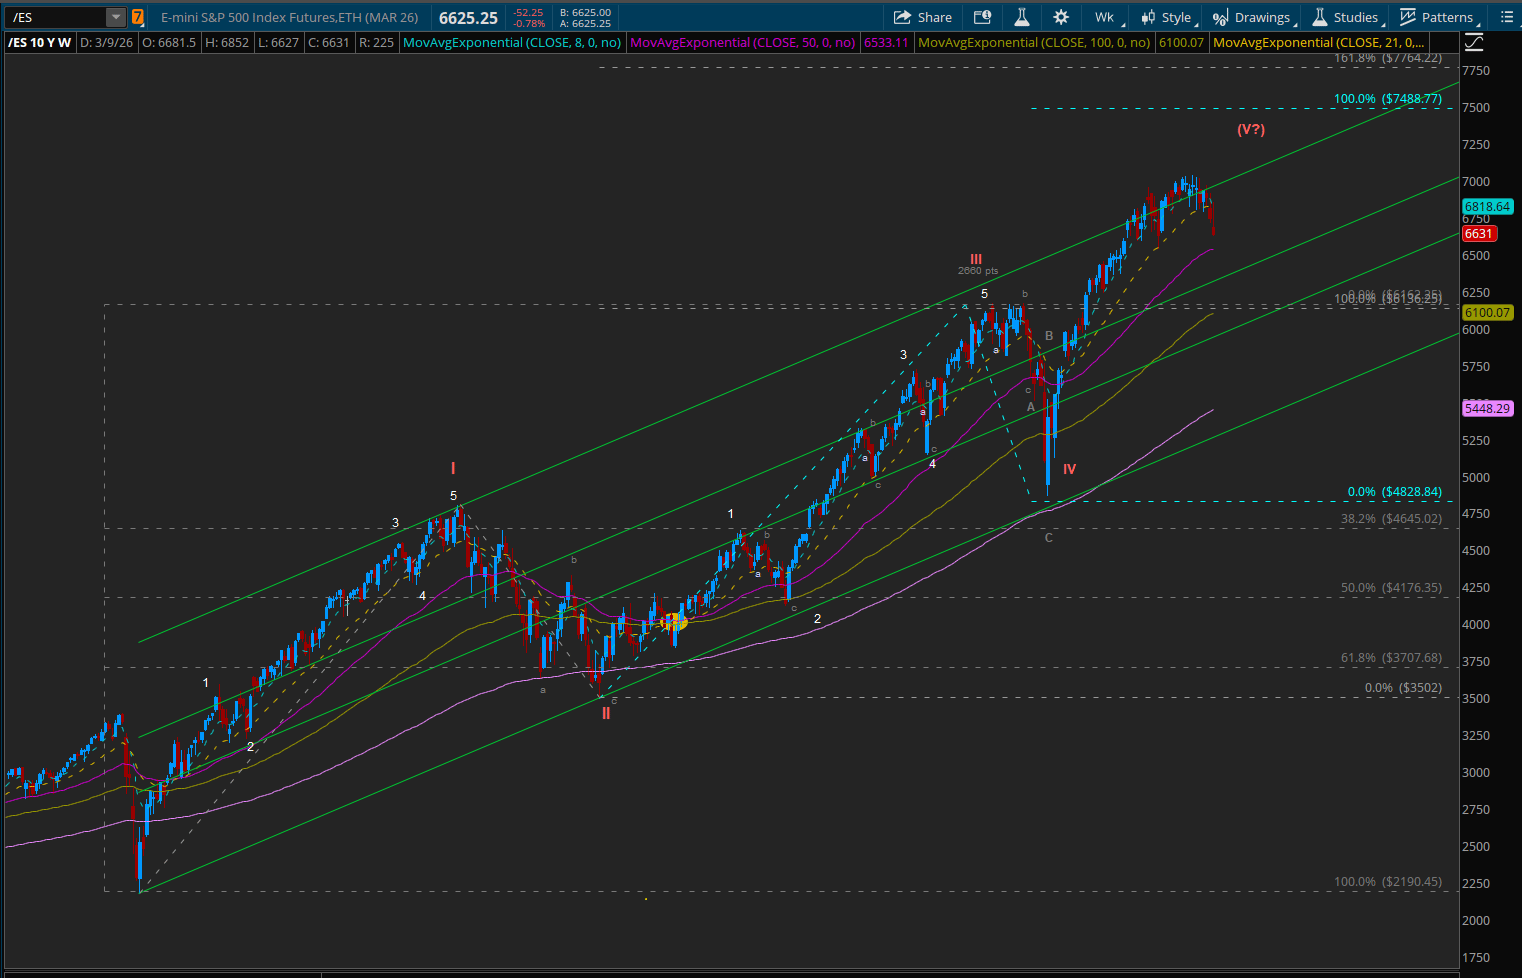
When we step back and apply Elliott Wave structure to the move off the COVID lows, the market can be interpreted as progressing through a large five-wave advance.
Within that structure, the recent highs may represent the final stages of the larger impulse move.
However, the recent selloff introduces another possibility that traders should consider.
A truncated fifth wave.
In Elliott Wave terms, a truncated fifth occurs when the final wave of the trend fails to meaningfully exceed the high of wave three before the larger correction begins.
This type of structure often appears when momentum begins to fade late in a trend.
If that is the case here, the market may have already completed a shortened final push before beginning a larger corrective phase.
Even within that scenario, the broader technical framework still points to the 7450-7500 region as the natural extension zone for the larger structure.
Whether the market ultimately reaches that level directly or after a deeper reset remains to be seen.
But the bigger roadmap still points in that direction.
And that is worth paying attention to.
The Big Picture
The key takeaway is not that the market must reach 7500 immediately.
Markets rarely move on anyone’s schedule.
But the structure of this bull market suggests that the recent selloff may be less about the end of the trend and more about another volatility reset within a longer cycle.
If the broader pattern continues to play out, the upside roadmap still points toward the same destination.
ES 7450-7500.
That is a level worth keeping on the radar.
Another piece I am watching sits outside equities. The 10-Year Treasury market has the look of a Wyckoff-style base, while the Yen carry trade may be starting to show signs of stress. If that leads to money rotating into bonds and yields easing, it could help set up the next leg higher in equities. I will expand on that in my next article.
If this bigger picture is the map, my daily setups are the execution plan. I post them each morning on my X feed, @manny_trends, where I share the levels and structure I am watching for the day ahead. Members of IMPRO are often the beneficiaries of that work.
For readers new to my work, I have traded S&P futures since 2012. I spent nearly a decade at Bloomberg in analytics, have appeared on TopStep Power Players, and last year generated over $175,000 in prop firm payouts. The work I share here comes from real trading, not theory.
Manny Payano
@manny_trends
Market Recap
As I have said many times, when the ES closes weak, it tends to rally on Globex. The low came in at 6636 at the session open and rallied up to 6704.50 at 8:45 am, then opened Monday’s regular session at 6697.25, up 60.25 points or +0.90%.
After the open, the ES traded 6690.50 and made 6 higher highs up to 6728.00 at 10:10, then sold off down to 6689.25 at 10:50. It rallied up to 6712.25 at 11:00, sold 6699.50 at 11:05, then rallied up to a lower high at 6720.25 at 11:35.
The ES sold off down to 6684.50 at 12:20, rallied up to 6711.00 at 1:25, then sold off down to 6693.00 at 1:50. It rallied up to 6716.75, sold off down to 6705.50, traded 6734.25 at 3:10, then sold off down to 6697.25 at 3:46.
The ES traded 6700.75 as the 3:50 cash imbalance showed $1 billion to sell and traded 6707.50 on the 4:00 cash close.
After 4:00, the ES sold off down to the open at 6697.25 at 4:25 and settled at 6704.75, up 68.745 points or +10.4%. The NQ settled at 24,675.754, up 281.50 points or +1.15%, the YN settled at 46,984, up 392 points or +0.84%, and the RTY settled at 2,505.00, up 24.10 points or +0.97% on the day.
In the end, the rip higher on Globex and after the regular session open, which @HandelStats said had no gap fill, seemed to be part of the oversold conditions. In terms of the ES’s and NQ’s overall tone, they acted firm and were bought on the dips.
In terms of the ES’s overall trade, volume was steady but not high, 1.883 million ESH and 2.139 million ESM traded, meaning the lion’s share of the volume was the ESH/ESM roll.
U.S. stocks broke a three-week losing streak on Monday, as a 5.3% drop in oil prices, triggered by signs of reopening in the critical Strait of Hormuz, provided a much-needed relief valve for the markets.
While the Nasdaq Composite climbed 1.2% on the back of Nvidia’s latest AI flagship products, a lingering “war premium” kept the 10-year Treasury yield at an elevated 4.219%, continuing to drive up borrowing costs for mortgages and corporate debt.
This volatility has fundamentally shifted expectations ahead of Wednesday’s Federal Reserve meeting. CME Group data now suggests a 33% chance that the Fed will not cut interest rates at all this year, a stark rise from just 4% last month. Investors are now focused on the upcoming release of the “dot plot” to see if the central bank views the current geopolitical conflict as a permanent hurdle to lowering inflation.
Economic Calendar
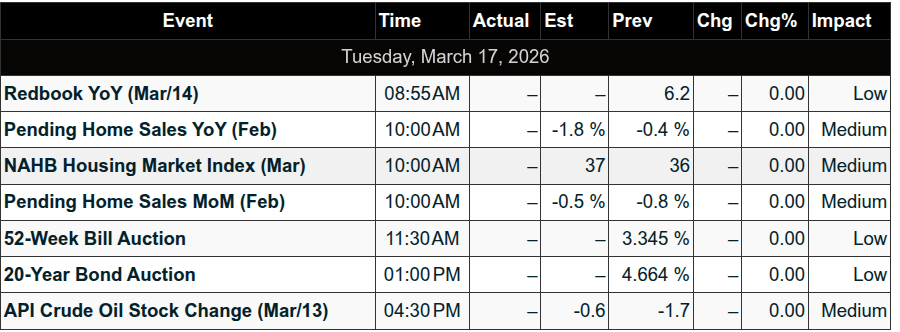
Tuesday, Mar 17: Pending Home Sales & Home Builder Confidence (10:00 am)
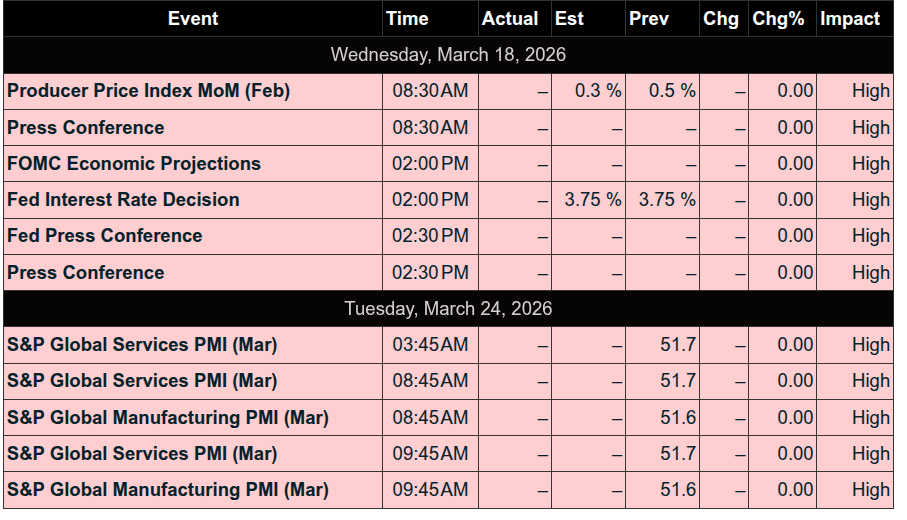
Wednesday, Mar 18: PPI Inflation Data (8:30 am); Factory Orders (10:00 am); FOMC Rate Decision (2:00 pm) & Chair Powell Presser (2:30 pm)
Thursday, Mar 19: Jobless Claims & Philly Fed Mfg (8:30 am); Wholesale Inventories & New Home Sales (10:00 am)
Friday, Mar 20: $7.1 Trillion Quarterly Expiration (Historic Market Event
MiM
Market-on-Close Recap – MiM
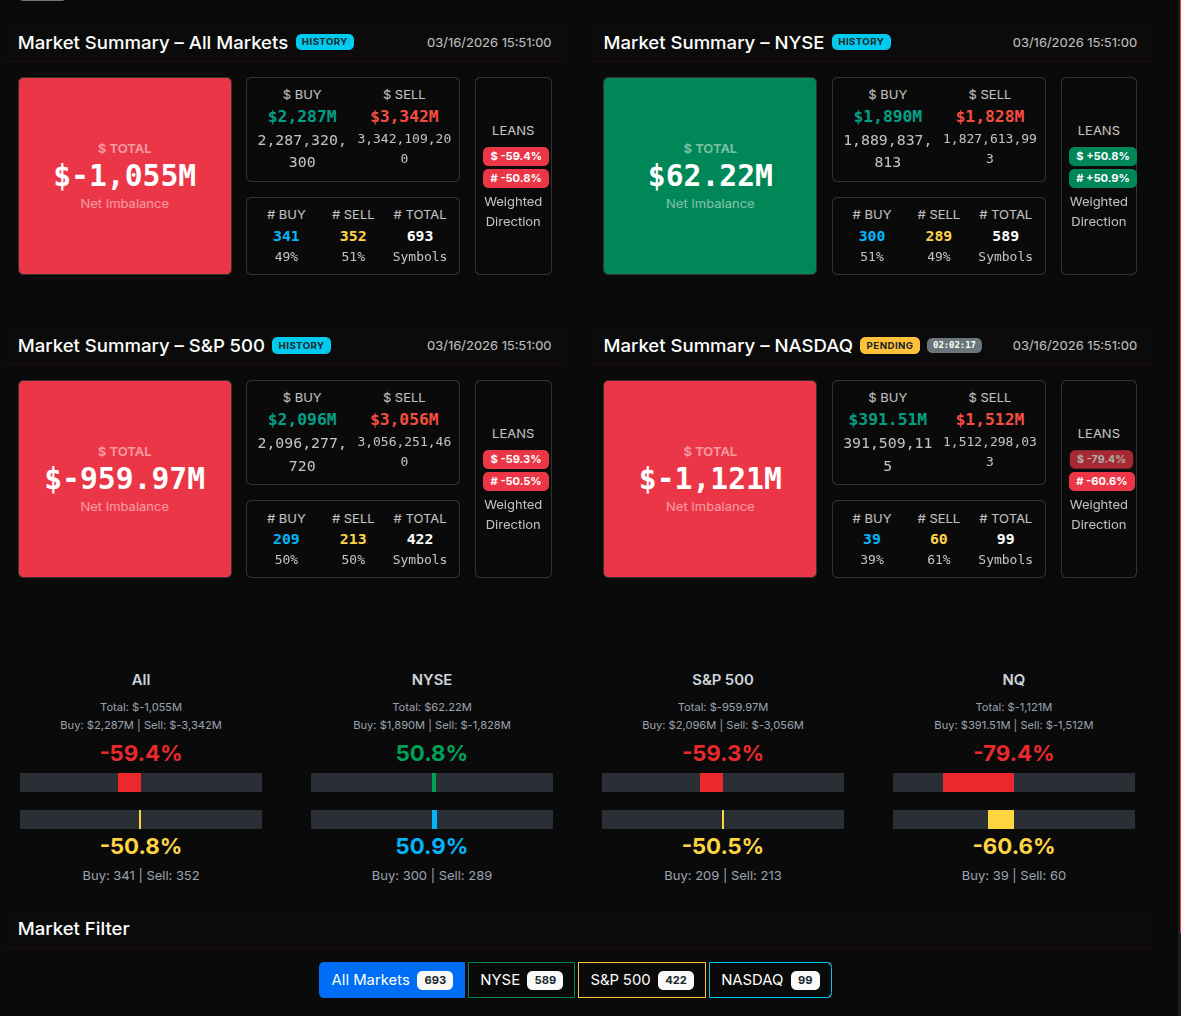
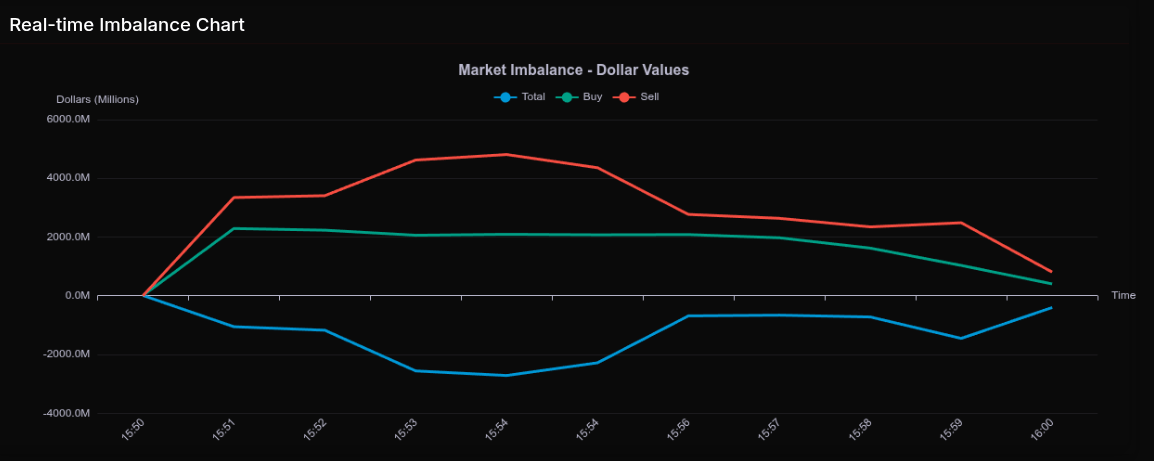
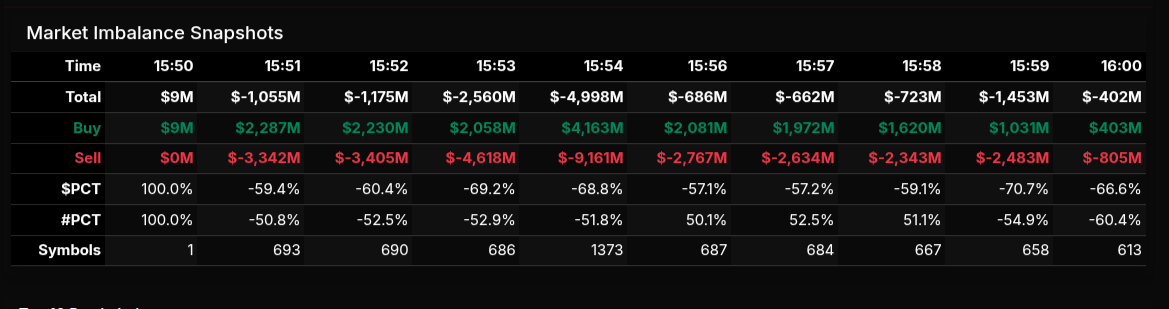
The MOC session opened with a modest and somewhat balanced tone before quickly skewing into a decisive sell program. At 15:50, the book was essentially flat, but by 15:51, a sharp -$1.05B imbalance hit, establishing early downside control. From there, the auction intensified into a wholesale sell environment, with peak pressure at 15:54 showing nearly -$5B total imbalance. Throughout this window, sell pressure consistently dominated with readings between -60% and -70%, clearly signaling institutional distribution rather than rotational flow.
The close did attempt some stabilization, particularly into 15:56–15:58, where the imbalance moderated toward the -57% to -59% range—closer to rotational territory—but never fully recovered. Into the final print, the market finished at -$402M with a -66.6% lean, reinforcing that supply remained in control into the bell.
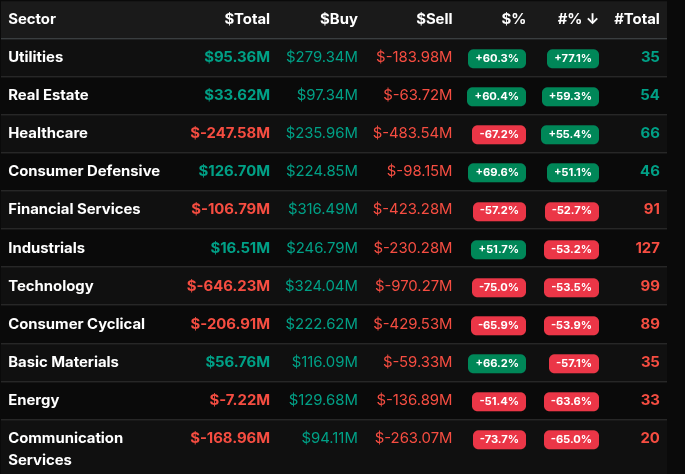
Sector flows confirmed this risk-off posture. Technology (-75.0%), Communication Services (-73.7%), and Consumer Cyclical (-65.9%) led the sell side, all printing extreme readings beyond the -66% threshold—clear signs of broad institutional unloading rather than passive rotation. Healthcare (-67.2%) also joined this group, adding to the defensive unwind. Financials (-57.2%) and Energy (-51.4%) leaned sell but were more rotational in nature.
On the buy side, flows were concentrated in traditionally defensive areas. Consumer Defensive (+69.6%), Utilities (+60.3%), and Real Estate (+60.4%) showed consistent demand, though only Consumer Defensive approached a stronger accumulation profile. Basic Materials (+66.2%) also saw notable buying, right on the threshold of more aggressive participation.
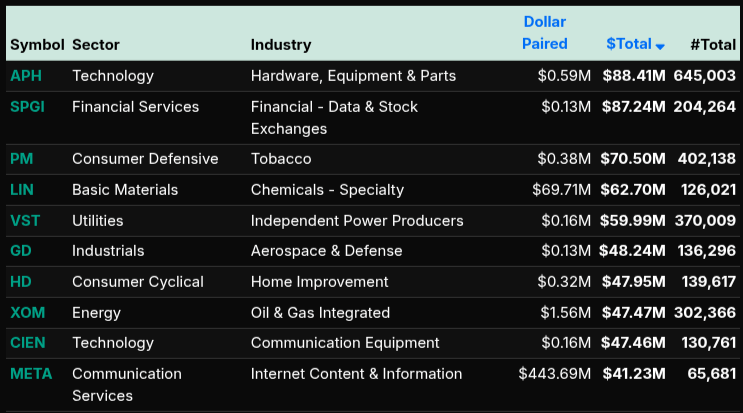
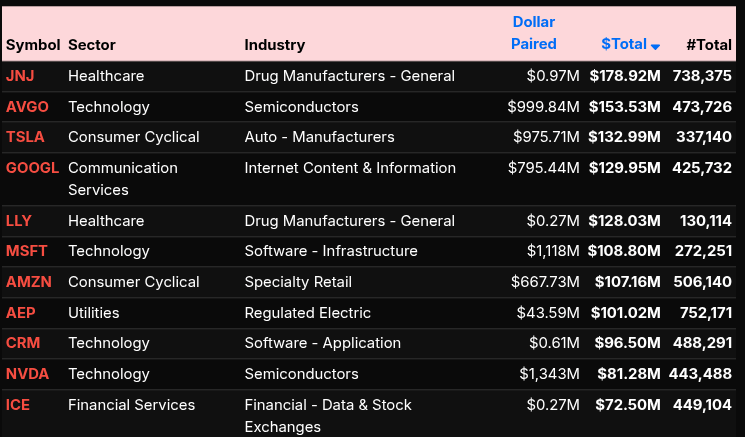
Single-name activity highlighted the dispersion. Large sell programs were evident in AVGO, TSLA, GOOGL, MSFT, and AMZN, reinforcing the pressure in growth and tech. Conversely, buying interest surfaced in names like APH, SPGI, PM, and LIN, reflecting selective rotation into defensives and value-oriented exposures.
Overall, this was a classic late-day institutional rebalance: aggressive de-risking in growth sectors paired with measured allocation into defensives, with the imbalance profile confirming a predominantly sell-driven close rather than a neutral rotation.
Technical Edge
Fair Values for March 17, 2026:
-
SP: 54.58
-
NQ: 232.67
-
Dow: 324.45
Daily Market Recap 📊
For Monday, March 16, 2026
• NYSE Breadth: 73% Upside Volume
• Nasdaq Breadth: 71% Upside Volume
• Total Breadth: 72% Upside Volume
• NYSE Advance/Decline: 69% Advance
• Nasdaq Advance/Decline: 67% Advance
• Total Advance/Decline: 68% Advance
• NYSE New Highs/New Lows: 57 / 73
• Nasdaq New Highs/New Lows: 70 / 174
• NYSE TRIN: 0.82
• Nasdaq TRIN: 0.82
Weekly Breadth Data 📈
For Week Ending Friday, March 13, 2026
• NYSE Breadth: 42% Upside Volume
• Nasdaq Breadth: 54% Upside Volume
• Total Breadth: 49% Upside Volume
• NYSE Advance/Decline: 22% Advance
• Nasdaq Advance/Decline: 32% Advance
• Total Advance/Decline: 28% Advance
• NYSE New Highs/New Lows: 151 / 226
• Nasdaq New Highs/New Lows: 226 / 575
• NYSE TRIN: 0.39
• Nasdaq TRIN: 0.41
ES & NQ Levels (Premium only)

ES – M26 Levels
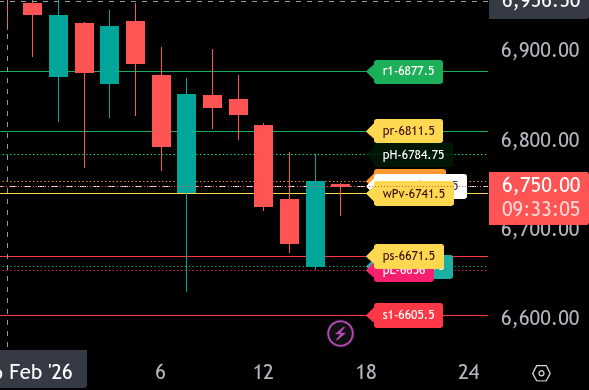
The bull/bear line for the ES is at 6741.50. This is the key level that will dictate intraday sentiment. Holding above this level keeps buyers in control, while sustained trade below shifts momentum back to the downside.
Currently, ES is trading around 6750.25, slightly above the bull/bear line, suggesting early stabilization after recent selling pressure. If price can hold above 6741.50, we look for a push higher toward 6755.50 and 6784.75. A continuation move above 6784.75 opens the door for a test of 6811.50, which is the upper range target for today. Beyond that, resistance sits at 6877.50 and then higher at 7013.25.
If price fails to hold above 6741.50, expect sellers to regain control. Initial downside targets come in at 6671.50, our lower range target. A break below this level exposes 6656.00 and then 6605.50. Losing 6605.50 would signal a broader continuation lower and potential expansion in range.
Overall, the market is attempting to base just above the bull/bear line after a sharp decline. Acceptance above 6741.50 favors a retracement higher, while rejection keeps pressure on the downside toward 6671.50 and lower.
NQ – M26 – Levels
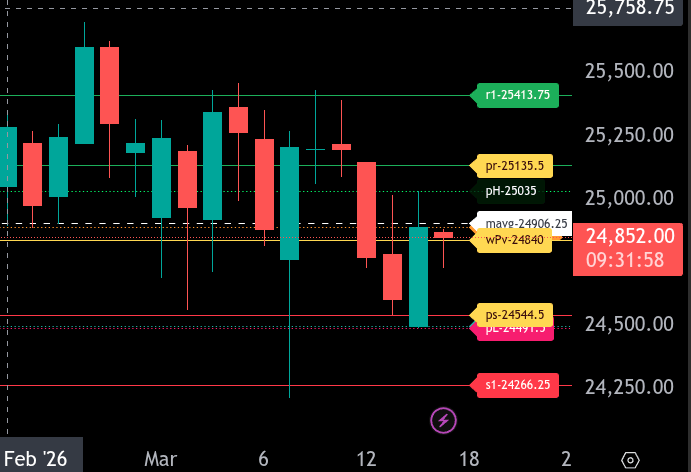
The bull/bear line for the NQ is at 24840.00. This is the key pivot for today’s session. Price is currently trading slightly above this level, around 24852.50, suggesting a marginally bullish tone as long as this level holds.
If NQ can maintain acceptance above 24840.00, the upside rotation targets 24906.25, which aligns with the moving average and serves as first resistance. A break and hold above this level opens the path toward 25035.00, followed by 25135.50, the upper range target for today. Beyond that, extended strength could test 25413.75.
On the downside, failure to hold 24840.00 shifts momentum back to bearish. Initial support comes in near 24544.50, the lower range target. A break below this level exposes 24500.00 and then 24491.50. If selling accelerates, the next major downside level sits at 24266.25.
Overall, the market is attempting to stabilize above the bull/bear line. Holding above 24840.00 keeps buyers in control for a push toward 25035.00 and 25135.50, while rejection below this level reintroduces downside pressure targeting 24544.50 and lower.
Calendars
Economic Calendar
Today
Important Upcoming
Earnings
Recent
Trading Room Summaries
Polaris Trading Group Summary – Monday, March 16, 2026
Monday was a classic Cycle Day 2 balancing session, shaped heavily by the contract rollover to June (M) and marked by early precision, midday chop, and controlled closing structure.
Pre-Market & Opening Context
David highlighted early that:
-
ES tagged the D-Level overnight with “guided tomahawk precision”
-
Pre-market hit upper CD2 levels, reinforcing the reliability of the D-Level Money Box
Bias early leaned bullish, with upside targets projected toward 6780, alongside the reminder:
“Patience is a position.”
This reinforced a focus on waiting for clean, structured opportunities rather than forcing trades.
Morning Session – Strength with Caution
-
Internals remained strong early
-
Selling pressure appeared but was clearly being absorbed
This absorption signaled underlying strength despite heavy-looking price action.
At the same time:
-
The open was choppy and “scrappy”
-
Rollover created distorted movement and reduced clarity
Midday – Chop & No Edge
By late morning, conditions deteriorated into:
-
Tight consolidation
-
Lack of rotation
-
“Zero edge” environment
Described as a chop fest and grind around key zones.
The focus shifted to discipline:
-
Avoid overtrading
-
Stand aside when no edge is present
Notable Concept – “Starling Pattern”
David highlighted a key behavioral dynamic:
-
When traders pile into one direction
-
The market shifts the opposite way due to lack of remaining participants
This explained failed continuation and lack of follow-through.
Afternoon – Structured Opportunity
During the lunch session:
-
Open Range Low near 6735 held
-
Produced a clean D-Level long setup
Into the afternoon:
-
Lean favored longs
-
Oil at lows supported equities
-
6765 identified as the key level for further upside expansion
Late Day Action
-
NVDA pushed to session highs, triggering a pop in ES and NQ
-
Move quickly reversed into a “pop and drop”
-
Significant volatility with a rapid round trip in NVDA
Despite this:
-
6750 Line in the Sand held firm
-
Price gravitated back to VWAP
Closing Structure
-
MOC sell imbalance grew to approximately $2.4B
-
Market remained balanced and structurally intact
The day closed:
-
At VWAP
-
Within balance
Final read:
Classic Cycle Day 2 behavior with consolidation and no sustained trend.
Key Takeaways & Lessons
-
D-Level precision continues to provide high-probability reactions
-
Absorption of selling is a sign of underlying strength
-
Rollover conditions increase chop and reduce clarity
-
Recognizing “no edge” conditions is critical to preserving capital
-
The cleanest opportunity came from the D-Level long off the Open Range Low
-
VWAP and the 6750 Line in the Sand controlled price throughout the session
Discovery Trading Group Room Preview – Tuesday, March 17, 2026
Markets remain headline-driven with focus on Middle East tensions, oil volatility, Nvidia’s GTC event, and Wednesday’s Fed decision.
Macro / Geopolitics
-
Oil continues to dominate sentiment—after a brief pullback Monday (which helped lift equities), prices have surged back near $100 overnight.
-
Ongoing Iran conflict and attacks on energy infrastructure are keeping crude elevated (+40% since conflict began), pressuring equities.
-
Strait of Hormuz traffic and lack of coordinated global military response add uncertainty.
-
US-China dynamics in focus as Trump delays summit; geopolitical risk remains elevated.
Equities / NVDA Catalyst
-
Nvidia GTC delivered multiple bullish long-term themes:
-
New Vera CPU platform targeting Intel/AMD competition.
-
Expansion into autonomous vehicles (Uber partnership scaling globally by 2027).
-
Continued AI ecosystem buildout (OpenClaw + NemoClaw addressing security concerns).
-
Potential implications from Groq acqui-hire (chip innovation angle).
-
-
Event continues today → more headlines likely.
Market Behavior
-
Stocks benefited from Monday’s oil dip (+1% S&P), but rising crude overnight is a headwind again.
-
Volatility cooled slightly but remains elevated (ES 5-day ADR ~102 pts).
-
No strong positioning signal (light overnight “whale” activity).
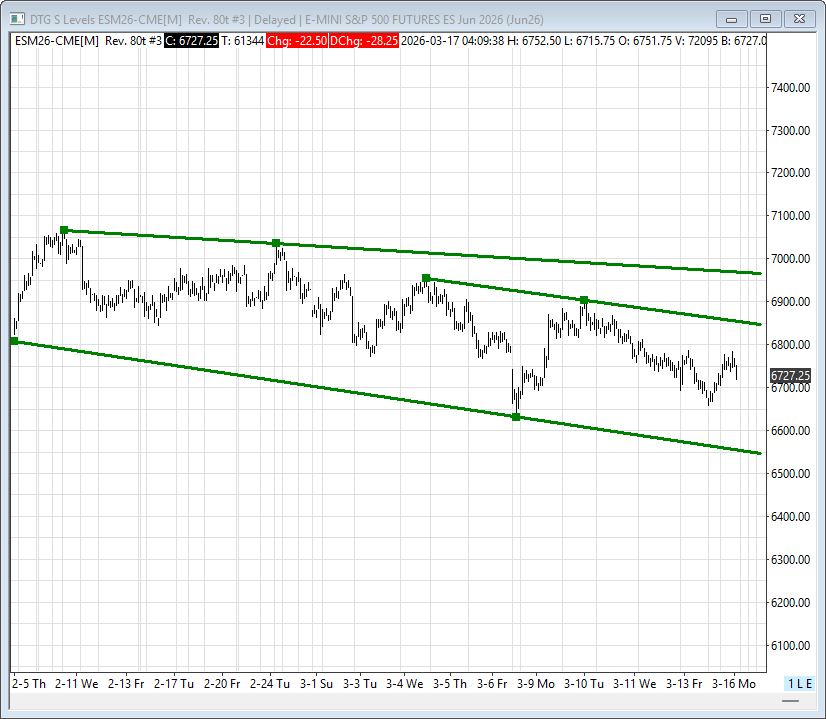
Technical Picture (ES)
-
Market still in short-term downtrend channel.
-
Failed reclaim of 200-day MA (6755) → remains key pivot (resistance below / support above).
-
Bias remains long-term bearish while below.
Key Levels
-
Resistance: 6855/50s, 6965/60s
-
Support: 6545/40s
Data / Earnings Watch
-
Today: ADP Employment (8:15am), Pending Home Sales (10am)
-
Earnings:
-
Premarket: ESLT
-
After close: LULU, ZTO
-
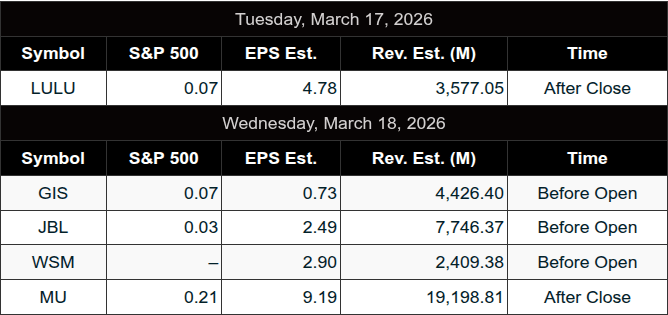
Wednesday: GIS, JBL, WSM, and key AI name MU (after close)
-
Bottom Line
Oil + geopolitics are driving near-term direction, while NVDA continues to reinforce the long-term AI narrative. Markets remain technically weak unless ES can reclaim the 200-day.
Affiliate Disclosure: This newsletter may contain affiliate links, which means we may earn a commission if you click through and make a purchase. This comes at no additional cost to you and helps us continue providing valuable content. We only recommend products or services we genuinely believe in. Thank you for your support!
Disclaimer: Charts and analysis are for discussion and education purposes only. I am not a financial advisor, do not give financial advice and am not recommending the buying or selling of any security.
Remember: Not all setups will trigger. Not all setups will be profitable. Not all setups should be taken. These are simply the setups that I have put together for years on my own and what I watch as part of my own “game plan” coming into each day. Good luck!
This post goes out as an email to our subscribers every day and is posted for free here around 2 PM ET. To get your real-time copy, sign up for the free or premium version here: Opening Print Subscribe.
Comments are closed