This post goes out as an email to our subscribers every day and is posted for free here around 2 PM ET. To get your real-time copy, sign up for the free or premium version here: Opening Print Subscribe.
Follow @MrTopStep on Twitter and please share if you find our work valuable!
Our View
The U.S. is out of balance in many ways, and so far, Russia seems to be emerging as one of the countries benefiting from the Iran war, as oil prices surge, helping its extremely weak economy. It has stepped up its support for Iran, its closest partner in the Middle East, providing satellite imagery and drone technology to help Iran target U.S. forces in the region. Trump’s ally, Putin, may be having the last laugh.
Meanwhile, Trump’s tariffs have hurt China, with imports falling to the lowest levels since 2001, while the deficit rises along with U.S. goods. Both countries have evolved into a more formalized bloc focused on military coordination, intelligence sharing, and mutual defense of nuclear sovereignty.
To bypass Western sanctions, these nations have moved toward de-dollarization in trade and are integrating critical energy infrastructure like the Power of Siberia 2 pipeline. This alignment extends into high-tech sectors, leveraging joint AI and space research to push a more “multipolar” global order that challenges Western economic and naval influence.
Our Lean
It’s 4:15 on Sunday afternoon. I am not going to change the lean, no matter where the ES and NQ open on Globex. What I can say is that after a 228.50-point drop over Thursday and Friday, one would think we could see some type of bounce.
But there doesn’t seem to be much good news coming out of the Middle East, as more U.S. military arrives and Iran continues to warn against a ground invasion.
I have to be honest—despite saying the break under 6500 could accelerate a sell-off down to 6300–6350, I didn’t think it would come this fast. I don’t want to get ahead of myself, but at this rate, 6150 would be my next larger-picture level.
I asked Grok: at the current rate, going back to 02/26/2026, how long would it take to fall to 6300, 6250, 6200, and 6150? This is what it said:
Start Price (02/26/2026): 6,972.75
Current Price (03/27/2026): 6,412.25
Total Points Lost: 560.50 points
Trading Days: 22 days
Average Daily Rate of Decline: -25.48 points per day
Projected Timeline to Targets
Using the average decline of 25.48 points per trading day:
6,300 → ~4.4 days (April 2–3, 2026)
6,250 → ~6.4 days (April 7, 2026)
6,200 → ~8.3 days (April 9, 2026)
6,150 → ~10.3 days (April 13, 2026)
Important Context
The “speed-up” factor: In the last two sessions alone, the market has dropped an average of 114 points per day. If that pace continues, these targets could be hit in under 3 trading days.
Mean reversion: Markets rarely fall in a straight line. After a ~9% drop in a month, technical bounces (short covering) are common and could delay these timelines.
Auction theory: Watch volume at lower levels. Declining volume near 6200 could signal selling exhaustion, while expanding volume would confirm continuation toward 6150.
Our lean: I would like to say take it one day at a time, but that’s not reality. The markets are getting hit hard, and there doesn’t seem to be any real diplomatic process. The last few days, I didn’t extend downside levels far enough, so today I will. I would like to be clearer, but the war fog is too thick.
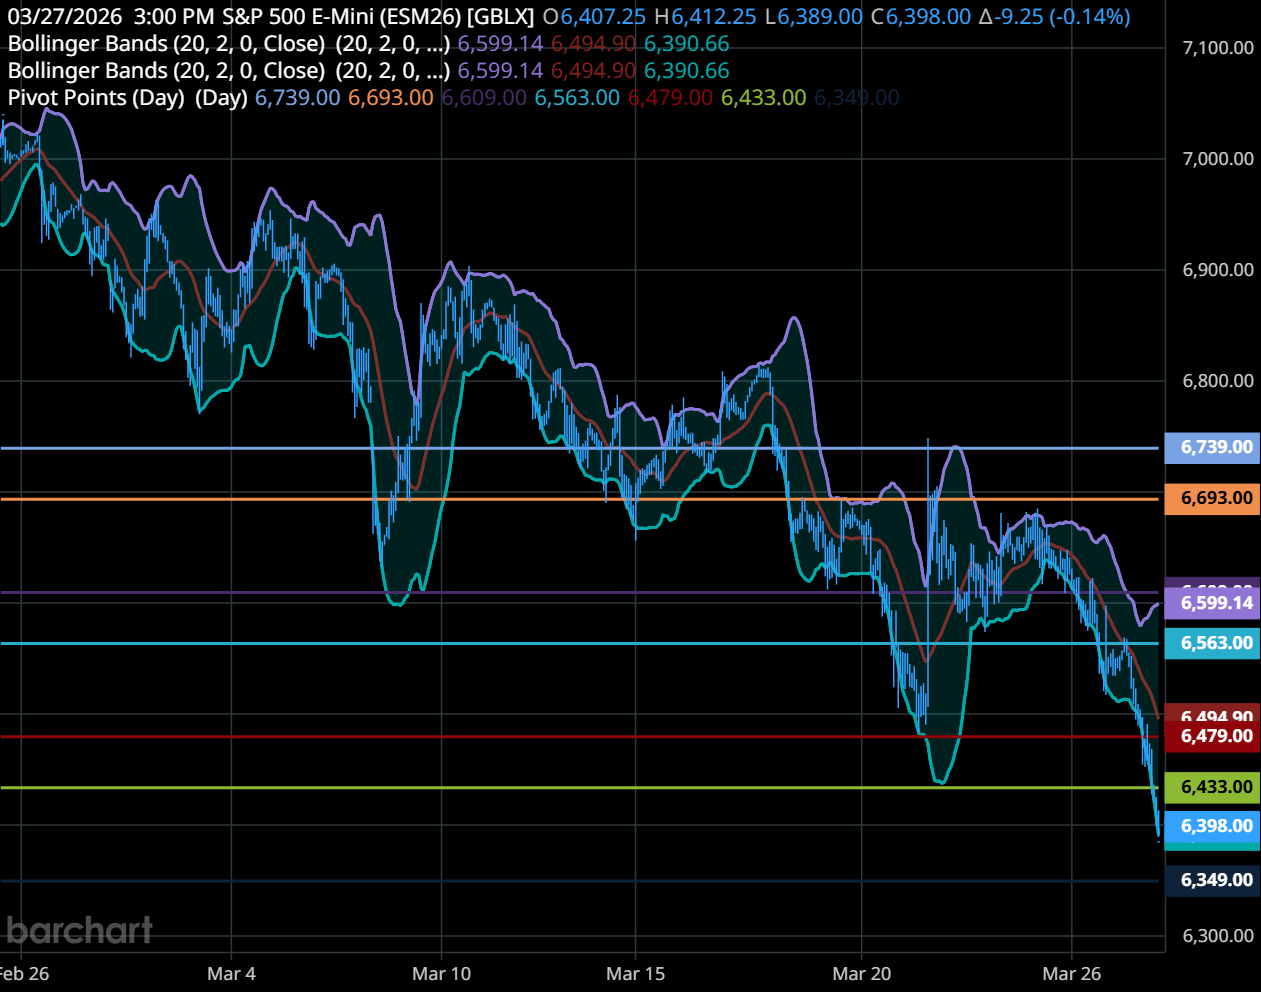
Claude ES Levels:
This integrated map for the S&P 500 E-Mini Jun ’26 (ESM26) provides a comprehensive view of the current auction, identifying key high-volume nodes and structural gaps that will define the next phase of price discovery.
Overhead Resistance (Recovery Path)
6548.00 — VAH
6525.00 — Previous close / Pivot R1
6589.34 — 9-day moving average
Current Pivot Zone (Active Auction)
6488.50 — POC
6456.58 — Mid-point pivot
6431.83 — RSI (30%)
6422.00 — VAL
6412.25 — Last price
6389.00 — Session low (no excess)
Structural Floor (2025 Value Gaps)
6357.78 — Target
6306.16 — 61.8% retracement
6253.75 — Naked POC (06/10/2025)
6245.20 — 3σ support
6186.00 — Naked POC (06/04/2025)
6150.75 — Major support
6119.25 — Multi-month low
Summary & Strategy
The lack of a buying tail at 6389.00 suggests the down-auction is not complete. Watch for a high-volume reversal at 6357.78 or 6306.16 to signal that fair value has been found.
Market Recap
1-Month ES Chart
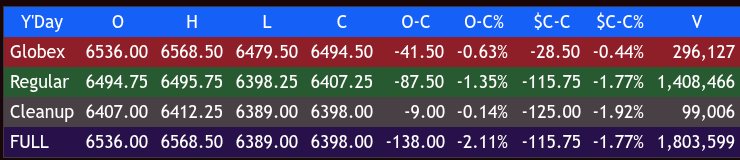
After Trump’s late-day headline and the “big pop” up to the 6590 area, the ES tumbled into the Globex close and traded to a new low for 2026, down to 6479.50 at 9:10 am Friday morning, and opened the 9:30 ET regular session at 6494.75, down 28.50, or 0.44%.
Afer the open, the ES traded 6495.50 marked a morning low at 6451.75 at 10:45. The ES then rallied up to 6481.25 at 11:05 and traded back down to 6457.75 at 11:20. It rallied again to 6490.25 at 11:35, then sold off to new lows at 6419.25 at 2:10. The ES bounced to 6435.25 at 2:20, sold off to 6412.50 at 3:10, and then chopped back and forth until 3:42, when it broke down to new lows at 6398.25 at 3:45.
The ES traded 6405.75 as the 3:50 cash imbalance showed $1.43 billion to sell, rallied up to 6419.25 at 3:55, and sold off down to 6407.25 on the 4:00 cash close. After 4:00, the ES traded down to a new low at 6389.00 at 4:20, rallied up to 6401.00, and settled at 6398.00, down 127 points or -1.95%. The NQ settled at 24,254.25, down 431 points or -1.75%, the YM settled at 45,424, down 806 points or -1.74%, and the RTY settled at 2464.00, down 44.20 points or -1.76% on the day.
In the end, it was a pretty shitty day for the markets. In terms of the ES overall tone, it broke through 6500, which I have been saying could set up a waterfall event. In terms of the ES’s overall trade, volume was 1.8 million contracts traded.
I mentioned this over a week ago—that the next shoe to drop could be the Houthis announcing their readiness to join Iran against the United States and Israel, which would signal a major expansion of their military operations – and that is exactly what happened. The escalation would include specific threats to target global shipping routes and intervene militarily at the Bab el-Mandeb Strait, a vital chokepoint for international trade.
Amid these rising tensions, the group has continued its pattern of high-stakes naval engagements by launching attacks on U.S. warships. These developments come at a volatile time for the organization, which recently confirmed the loss of several high-ranking officials, including Prime Minister Ahmed Ghaleb Nasser al-Rahawi, in a recent strike.
I could talk about how bad things are, but you already know that. Instead, I am going to stick to the numbers:
S&P Futures
Daily Performance Summary
Down Days: 28 | Up Days: 13 | Flat: 1 (02/11/2026)
Total Loss Calculation
Start (01/28/2026): 7,061.50
End (03/27/2026): 6,412.25
Total Points: -649.25
Total % Loss: -9.19%, down 9.65% YTD
Key Observations
Momentum: 7 of last 8 sessions red
Volatility: Largest drop 03/26/2026 (-115.75)
Range: High 7,097.00 (01/28) | Low 6,389.00 (03/27)
Nasdaq Futures
Daily Performance Summary
Down Days: 14 | Up Days: 8
Total Loss Calculation
Start (02/26/2026): 25,301.50
End (03/27/2026): 23,328.50
Total Points: -1,973.00
Total %: -7.80% and down 12.23% YTD
Key Observations
Momentum: Late-March acceleration (−1,000+ pts in 03/23–03/27)
Volatility: Largest drop 03/26 (-573.50)
Volume: Spike from ~4K–15K → 550K+ (liquidation/high conviction)
Range: High 25,637.00 (02/26) | Low 23,232.50 (03/27)
Dow Futures
Daily Performance Summary
Down Days: 16 | Up Days: 6
Total Loss Calculation
Start (02/26/2026): 49,851.00
End (03/27/2026): 45,424.00
Total Points: -4,427.00
Total %: -8.88% and down 10.82% YTD
Key Observations
Momentum: Persistent selling (~73% red days)
Volatility: 3 sessions > -800 pts (03/05, 03/18, 03/27) | Max -820 (03/05)
Volume: <3.5K → 194K+ by 03/23 (liquidation spike)
Range: High 50,191.00 (02/26) | Low 45,272.00 (03/27)
Russell 2000 Futures
Daily Performance Summary
Down Days: 18 | Up Days: 14 | Flat: 1 (02/17/2026)
Total Loss Calculation
Start (02/10/2026): 2,706.80
End (03/27/2026): 2,464.00
Total Points: -242.80
Total %: -8.97% and down 10.99% YTD
Key Observations
Momentum: Late-March selling acceleration
Volatility: Largest % drop 03/06 (−2.30%)
Volume: Hundreds → 428,385 (03/16)
Range: High 2,738.70 (02/11) | Low 2,415.20 (03/23)
Relative: ~9% decline (in line with NQ/Dow weakness)
I would say this is fairly sobering. While some of the stats start before the war in the Middle East, the ongoing selling and the acceleration of the move lower have increased significantly over 6 of the last 8 sessions. I think you all know that I am a bull, but I have not made a bullish comment in weeks and started my “pessimistic bull” stance before the war began.
The week ahead is going to be particularly important—not just in the geopolitical scene, but with the end of the quarter, the beginning of the new quarter economically, and Fed speak.
MONDAY, MARCH 30
10:30 am — Federal Reserve Chair Jerome Powell speaks
4:00 pm — New York Fed President John Williams speaks
TUESDAY, MARCH 31
9:00 am — S&P Case-Shiller home price index
9:45 am — Chicago Business Barometer (PMI)
10:00 am — Job openings
10:00 am — Consumer confidence
12:00 pm — Chicago Fed President Austan Goolsbee speaks
3:00 pm — Fed Governor Michael Barr speaks
5:10 pm — Fed Vice Chair Michelle Bowman speaks
WEDNESDAY, APRIL 1
8:30 am — U.S. retail sales
8:30 am — Retail sales minus autos
8:30 am — ADP jobs
9:05 am — St. Louis Fed President Alberto Musalem speaks
9:10 am — Fed Governor Michael Barr speaks
9:45 am — S&P final U.S. manufacturing PMI
10:00 am — ISM manufacturing
10:00 am — Business inventories
THURSDAY, APRIL 2
8:30 am — Initial jobless claims
8:30 am — U.S. trade deficit
FRIDAY, APRIL 3
8:30 am — U.S. employment report
9:45 am — S&P final U.S. services PMI

Guest Posts
Trey Oglesby – Swing Room – Weekly Charts
Swing Room Video Replay:
Trey and Tom just wrapped their Week in Review + Next Week Outlook—and if you missed it, it’s worth your time. You’re getting real perspective from seasoned traders who’ve actually navigated these markets, not just theory.
Watch the replay here:
We’re also launching something traders have been asking for:
A dedicated SWING room built specifically for those thinking beyond the intraday noise.
This is where the focus shifts to:
-
higher timeframe setups (weekly / monthly)
-
investment-quality opportunities
-
capital allocation decisions (when to deploy vs. when to stay sidelined)
-
patience, positioning, and asymmetric risk
If you’ve ever felt like everything is too short-term and reactive, this is the counterbalance.
The SWING room is about clarity, conviction, and letting trades develop.
Free to join: https://mrtopstep.com/l/swing
Add to your calendars a pre-weekly globex open review with the SWING team every Sunday at 5:30PM ET.
Webinar Replay:
Niels Koops: DeltaTrader.com

MiM
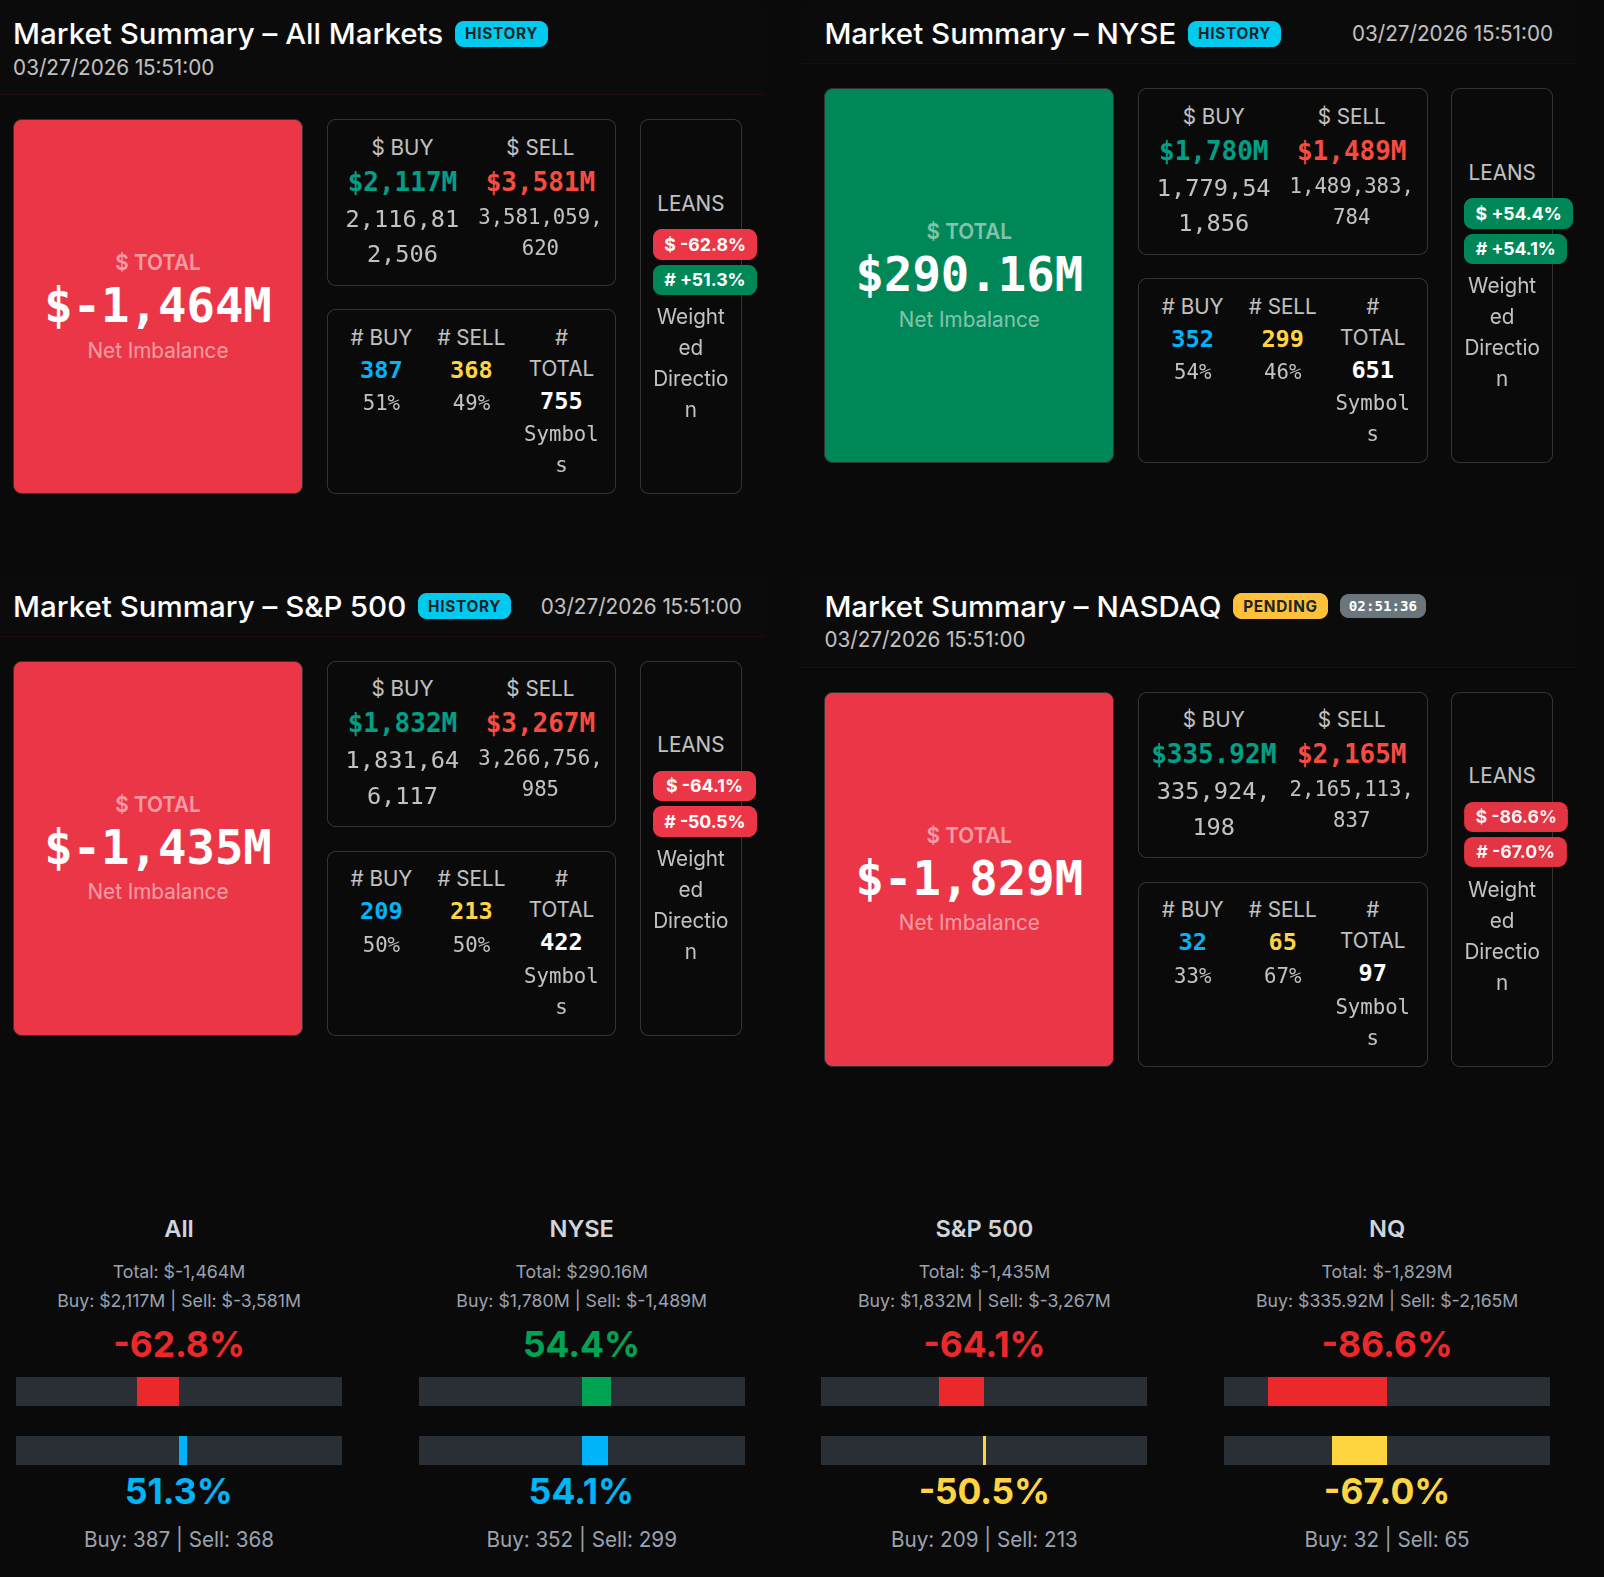
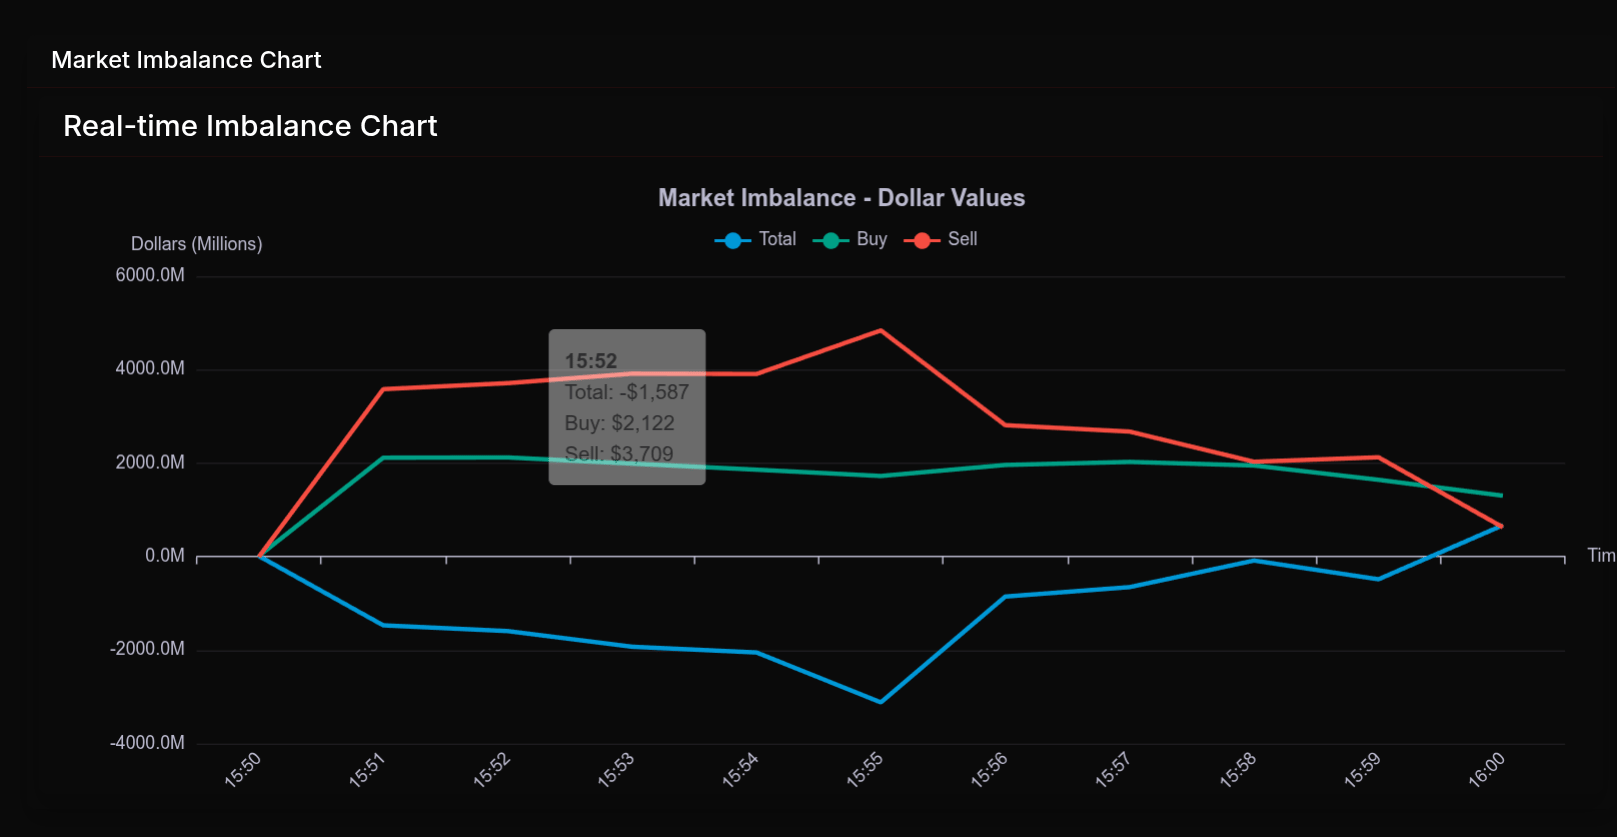
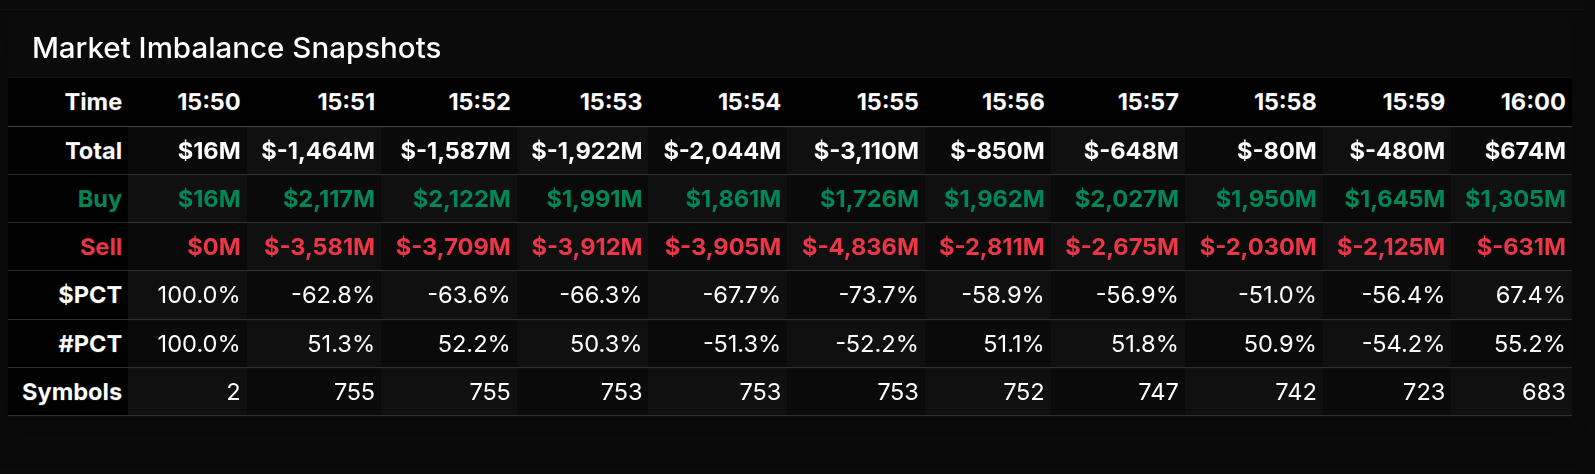
The MOC session opened with immediate and persistent sell pressure, setting the tone for a broadly imbalanced close. By 15:51, the market had already flipped to a sizable -$1.46B imbalance, with sell programs dominating and $PCT printing -62.8%. From there, the session intensified into a clear wholesale sell environment, with multiple readings beyond the -66% threshold—most notably -66.3%, -67.7%, and an extreme -73.7% at 15:55. These readings confirm aggressive institutional distribution rather than simple rotation.
The trajectory into the close showed consistent sell-side control, with total imbalances expanding to over -$3.1B mid-window before stabilizing. Despite some late compression, the final print flipped to +$674M, suggesting a late offset or paired rebalancing rather than a true directional shift.
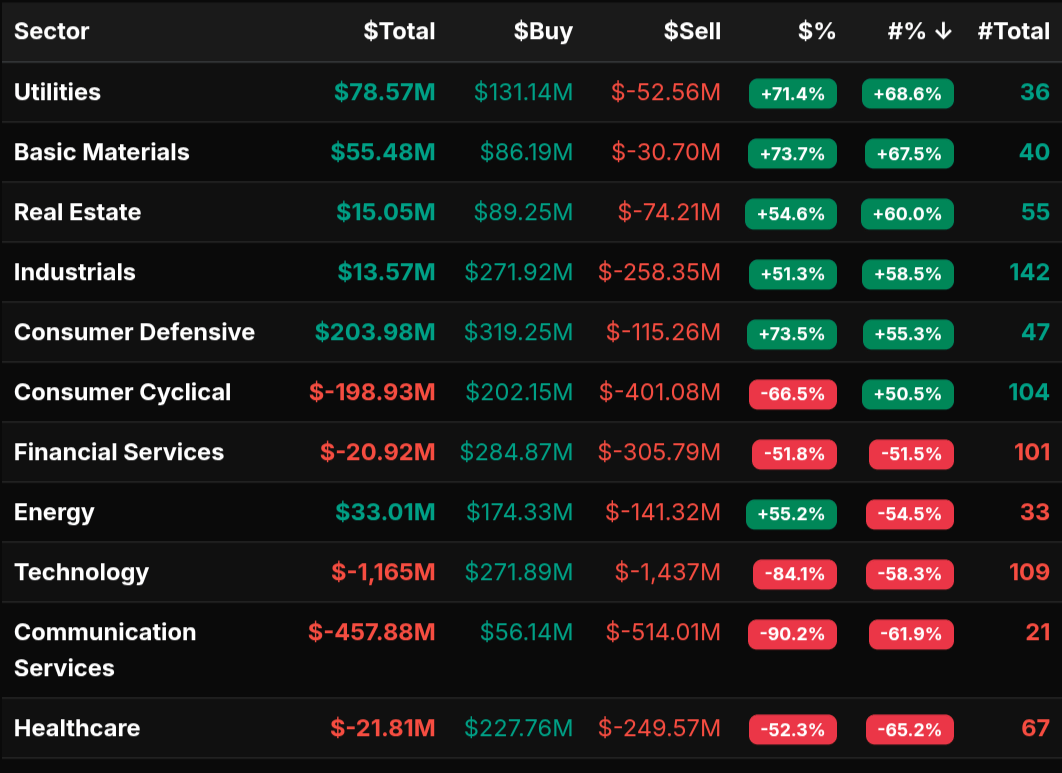
Sector flows reinforced the underlying narrative. Technology (-84.1%) and Communication Services (-90.2%) saw heavy, decisive liquidation—both well beyond the -66% threshold, indicating broad risk-off positioning. Consumer Cyclical (-66.5%) also reached that threshold, signaling systematic selling in growth-sensitive areas. Financials (-51.8%) and Healthcare (-52.3%) leaned sell but remained more rotational in nature.
On the buy side, defensives stood out. Utilities (+71.4%), Basic Materials (+73.7%), and Consumer Defensive (+73.5%) all printed strong buy imbalances above +66%, indicating targeted capital rotation into safety and inflation-resilient sectors rather than broad accumulation.
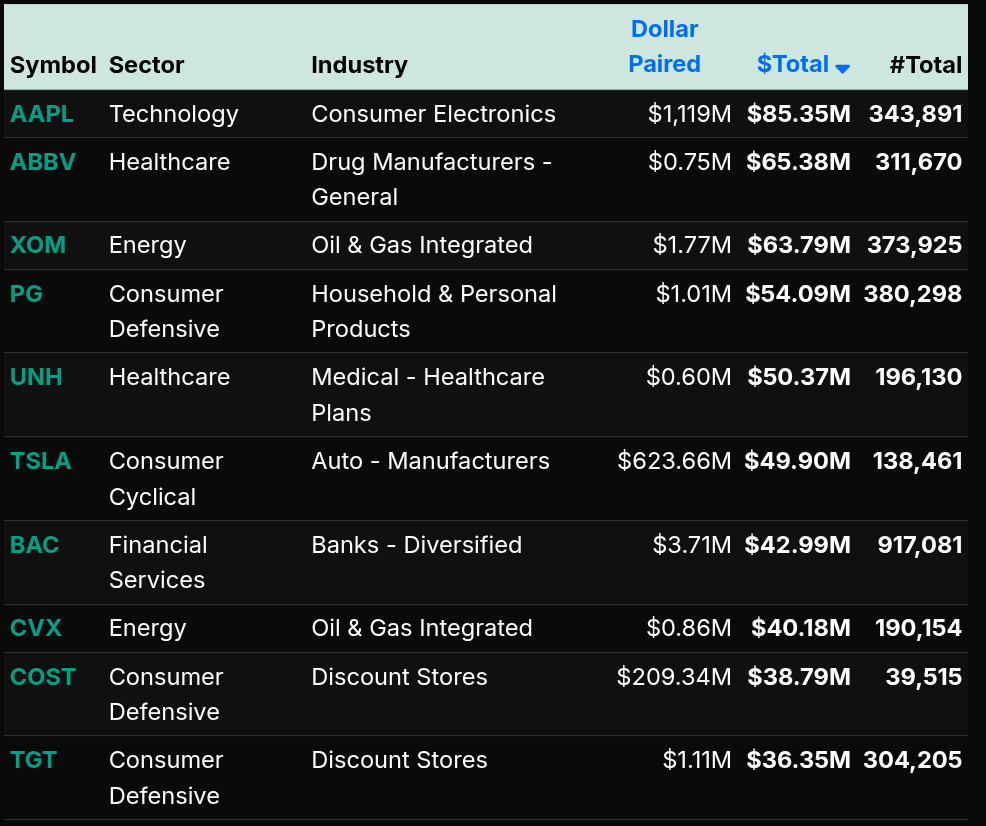
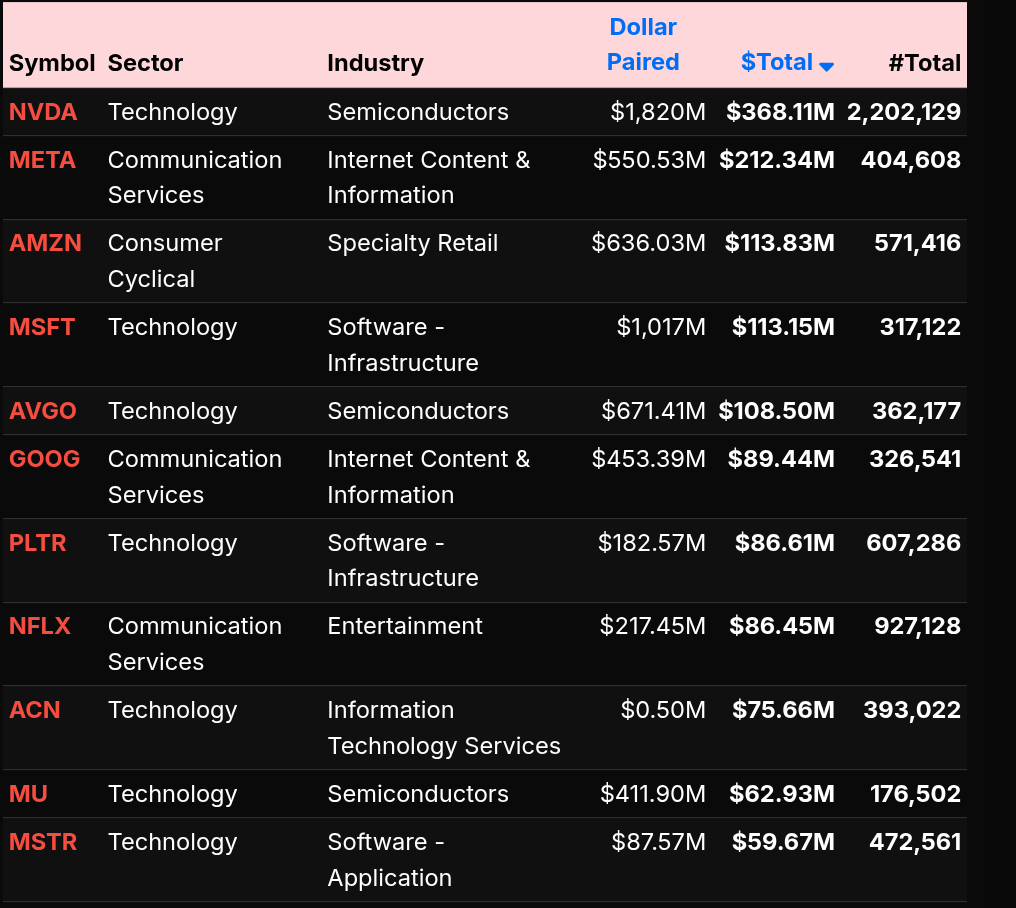
At the single-name level, the largest activity was concentrated in mega-cap tech and communication names. NVDA, META, AMZN, MSFT, and AVGO dominated the tape, largely contributing to the sell pressure in growth. Meanwhile, defensive and value-aligned names like ABBV, XOM, PG, and UNH saw steady buy interest, reinforcing the sector-level rotation.
Index-level data confirms the divergence. NYSE closed with a +54% buy lean, while NASDAQ printed an extreme -86.6%, highlighting a sharp bifurcation between defensive inflows and aggressive tech liquidation.
Overall, this was not a balanced close—it was a structurally bearish MOC driven by institutional unwinds in growth and a clear flight into defensives.
Technical Edge
Fair Values for March 30, 2026
-
SP: 41.31
-
NQ: 178.52
-
Dow: 226.33
Daily Breadth Data 📊
For Friday, March 27, 2026
-
NYSE Breadth: 30% Upside Volume
-
Nasdaq Breadth: 17% Upside Volume
-
Total Breadth: 22% Upside Volume
-
NYSE Advance/Decline: 22% Advance
-
Nasdaq Advance/Decline: 22% Advance
-
Total Advance/Decline: 22% Advance
-
NYSE New Highs/New Lows: 76 / 219
-
Nasdaq New Highs/New Lows: 45 / 571
-
NYSE TRIN: 0.66
-
Nasdaq TRIN: 1.30
Weekly Breadth Data 📈
For Week Ending March 27, 2026
-
NYSE Breadth: 54% Upside Volume
-
Nasdaq Breadth: 46% Upside Volume
-
Total Breadth: 49% Upside Volume
-
NYSE Advance/Decline: 47% Advance
-
Nasdaq Advance/Decline: 39% Advance
-
Total Advance/Decline: 42% Advance
-
NYSE New Highs/New Lows: 156 / 308
-
Nasdaq New Highs/New Lows: 217 / 837
-
NYSE TRIN: 0.74
-
Nasdaq TRIN: 0.72

Today’s BTS Levels:
ES M
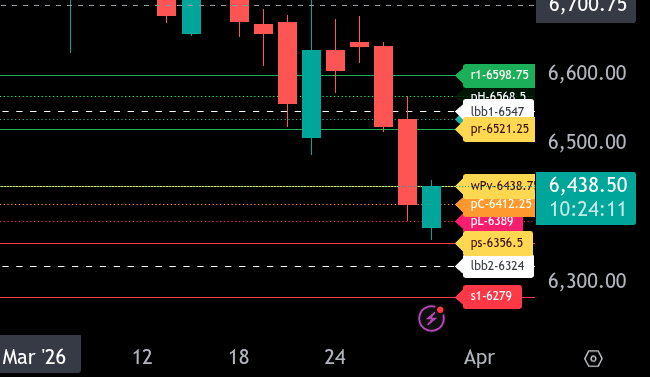
The bull/bear line for ES is at 6438.75. This is the key level that will dictate directional bias for today’s session. Holding above this level keeps the market in a position to stabilize and rotate higher, while acceptance below it signals continued downside pressure.
Currently, ES is trading right at the bull/bear line after a sharp overnight selloff followed by a responsive bounce. This places the market in a decision zone. If price is rejected below 6438.75, expect continuation lower toward 6412.25 and then 6389.00. A break and acceptance below 6389.00 opens the door to the lower range target at 6356.50. If selling accelerates, further downside could extend toward 6324.00.
On the upside, reclaiming and holding above 6438.75 should lead to a push into 6536.00, which is the first key resistance. Above that, 6547.00 comes into play, followed by 6568.50. The upper range target for today sits at 6598.75. A sustained move above 6568.50 would signal strengthening bullish momentum and increase the probability of testing that upper range.
Overall, the market is attempting to recover after a sharp drop, but remains vulnerable below 6438.75. Trade location around this level is critical. Acceptance above favors rotational upside, while failure here keeps pressure on the downside toward 6356.50.
NQ M
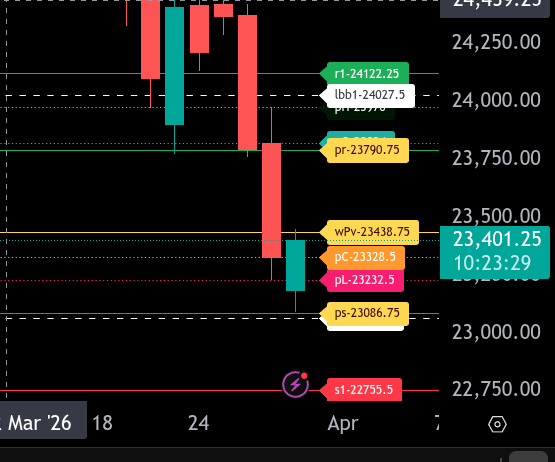
The bull/bear line for the NQ is at 23438.75. This is the key level that defines intraday sentiment. Holding below this level keeps the market in a bearish posture, while acceptance back above shifts momentum toward buyers.
NQ is currently trading around 23401.00, sitting below the bull/bear line after a sharp overnight selloff and partial rebound. As long as price remains below 23438.75, sellers remain in control, and rallies into this level are likely to be sold.
On the downside, the first support comes in at 23328.50, followed by 23232.50. If price breaks and holds below these levels, the lower range target at 23086.75 comes into play. A failure there opens the door for further downside extension toward the 23066 region.
On the upside, initial resistance is at 23438.75. A reclaim and hold above this level would target 23790.75 as the upper range target. Additional resistance sits near 23824 and 23976, with a broader stretch toward 24027.50 if momentum builds.
Overall, the market is attempting to stabilize after a strong bearish impulse, but remains vulnerable below 23438.75. Buyers need to reclaim and hold above this level to shift control, while continued rejection keeps focus on lower supports and the 23086.75 target.
Room Summaries:
Polaris Trading Group Summary – Friday, March 27, 2026
The day started with a clear tone: Capital Preservation Friday, so the focus was on disciplined, selective trading rather than aggressive risk-taking. David noted early that lower targets had already been fulfilled, which framed the session as more of a reactionary/confirmation day than a big directional opportunity.
Morning Session
-
CL Open Range Long triggered early, giving traders an initial opportunity right out of the gate.
-
Discussion around open range timeframes (3m vs 5m vs 15m) reinforced an important lesson:
→ shorter timeframes (like 3m) can lead to chop and false signals, while slightly higher timeframes provide better stability. -
Strong educational focus on:
-
EMA relationships (34 vs 89)
-
Context vs signal timing
-
Recognizing when a move is early vs after structure shift
-
Key takeaway: Context matters more than the signal itself.
Mid-Morning ट्रेड Development
-
The group identified a cycle day type (Cycle Day 2) with:
-
D-shaped profile
-
Balanced / rotational behavior
-
-
Traders called out PKB (Pullback continuation setups) and symmetry concepts.
-
Barbara and others highlighted clean reads like:
-
“filling” behavior
-
structural balance before break
Key takeaway: Understanding market structure (balance → break) led to higher-quality trades.
-
Midday → Early Afternoon
-
Market began showing signs of:
-
Repeated push failures
-
Attempted bottoming behavior
-
-
David guided traders to:
-
Stay interested in longs on pullbacks
-
Watch VWAP (6488 area) for control shifts
-
However:
-
Bulls failed to reclaim VWAP convincingly
-
Tape action became sluggish and heavy
Key takeaway: When key levels (like VWAP) fail to convert, bias must stay flexible.
Late Day (MOC Insight)
-
David returned and immediately identified:
-
Steady liquidation
-
“Ticks on bricks” (persistent selling pressure)
-
Clear risk-off environment
-
-
Confirmed with:
-
$1B+ sell imbalance into the close
-
Weak quarterly tone overall
-
Final read: Bearish pressure dominated into the close despite earlier bottoming attempts.
Overall Lessons from the Day
1. Capital preservation mindset matters
-
Not every day is for big wins—protecting gains is part of the strategy.
2. Context > Signals
-
EMA alignment, structure, and timing made the difference between good and poor entries.
3. Balance days require patience
-
D-shaped / rotational days reward precision, not overtrading.
4. VWAP remains king
-
Acceptance vs rejection at VWAP clearly defined control throughout the day.
5. Be adaptable
-
Early long opportunities existed, but failure at key levels required shifting bias.
Positive Takeaways
-
Clean execution on open range and PKB setups
-
Strong engagement and technical discussion among members
-
Reinforcement of core PTG concepts (symmetry, structure, VWAP control)
-
Traders actively thinking—not just following signals
DTG Room Preview – Monday, March 30, 2026
Macro / Geopolitics
-
Middle East conflict remains primary market driver
-
Oil +3%, WTI back above $100
-
Continued US/Israel strikes; US increasing troop presence
-
Mixed signals on US–Iran negotiations; no clear resolution
Market Overview
-
US futures modestly higher into shortened holiday week
-
S&P 500 -7% YTD; Nasdaq & Dow in correction territory
-
2025 tailwinds (AI, earnings growth, rate cuts) fading
-
Market now leaning toward potential Fed hike
Equities
-
Mag 7 lost ~$850B last week
-
Weakness led by META & GOOG after major legal ruling
Risk / Sentiment
-
VIX elevated at ~31 (fear remains high)
-
Gold down ~$500
-
Bitcoin near $65K
-
Early signs of dip-buying from some funds (“buy fear” theme)
Macro Calendar
-
Light week for data
-
Powell speaks today (10:30am ET)
-
Jobs Report Friday (markets closed)
Positioning / Flow
-
Volatility elevated; ranges expanding
-
Whale flow leaning bullish into the open
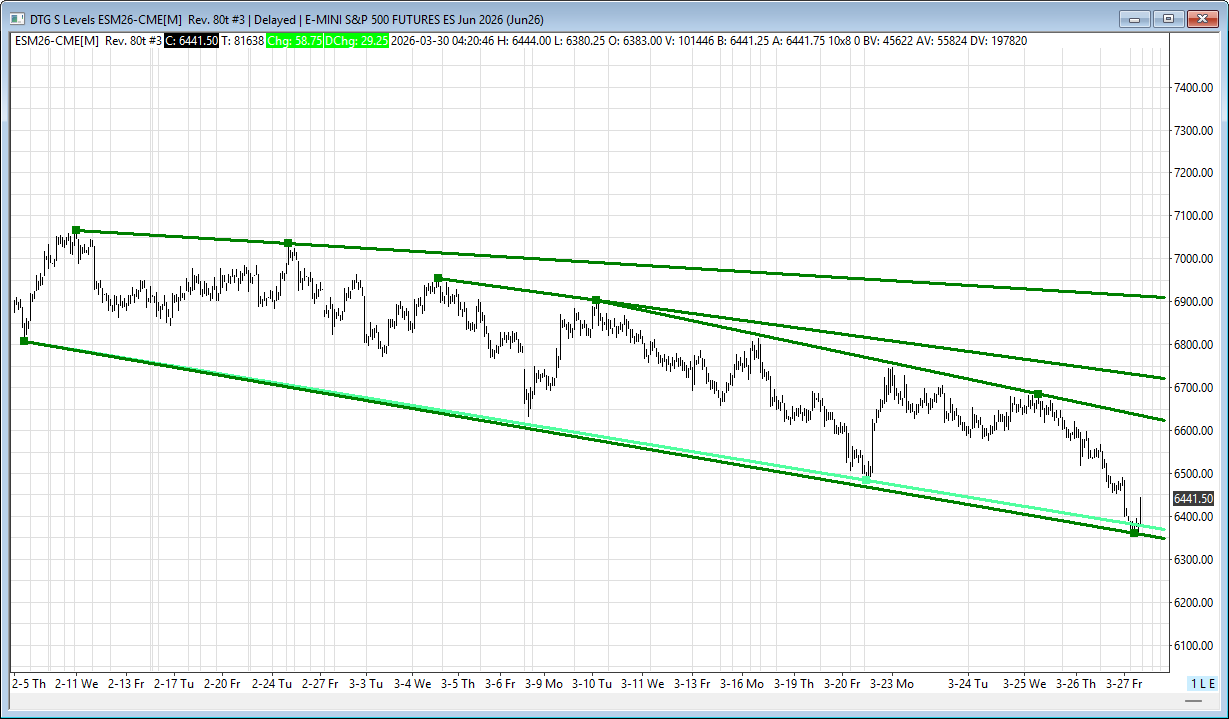
ES Technicals
-
Support: 6353–6348 (key breakdown level)
-
Resistance: 6628–6623, 6723–6718, 6912–6907
-
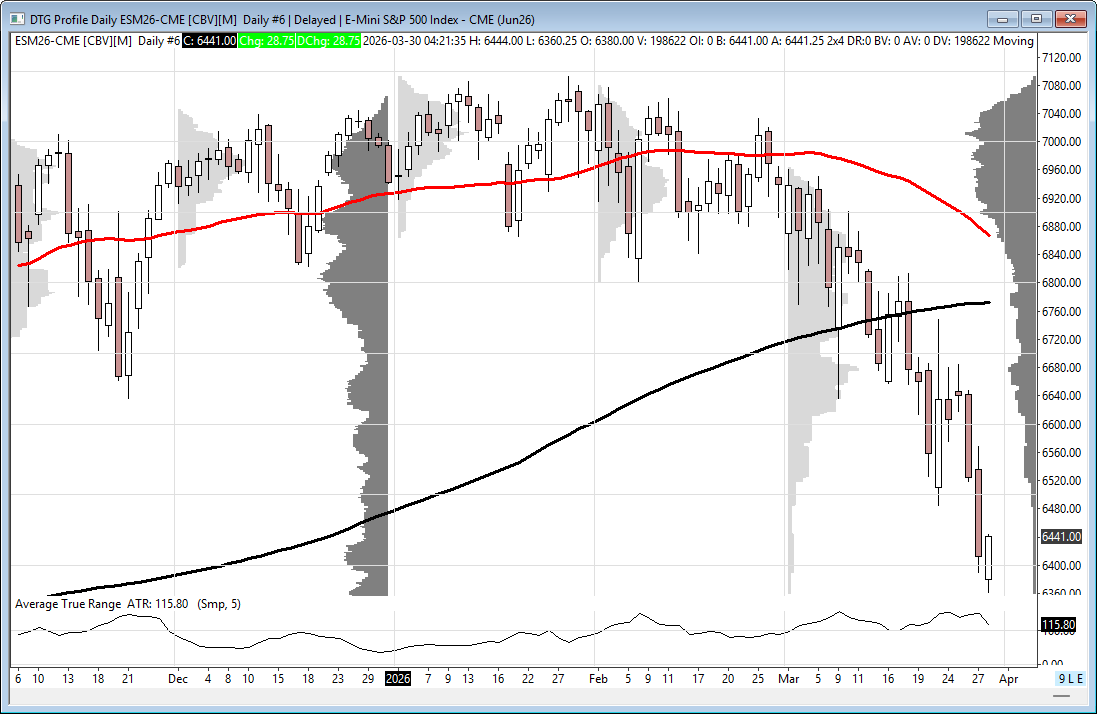
200-day MA (6772): overhead resistance, less relevant now
-
50-day MA (6865): trending lower toward 200-day
Bottom Line
-
Market caught between geopolitical risk and early dip-buying
-
Key support zone likely to dictate near-term direction
Affiliate Disclosure: This newsletter may contain affiliate links, which means we may earn a commission if you click through and make a purchase. This comes at no additional cost to you and helps us continue providing valuable content. We only recommend products or services we genuinely believe in. Thank you for your support!
Disclaimer: Charts and analysis are for discussion and education purposes only. I am not a financial advisor, do not give financial advice and am not recommending the buying or selling of any security.
Remember: Not all setups will trigger. Not all setups will be profitable. Not all setups should be taken. These are simply the setups that I have put together for years on my own and what I watch as part of my own “game plan” coming into each day. Good luck!
This post goes out as an email to our subscribers every day and is posted for free here around 2 PM ET. To get your real-time copy, sign up for the free or premium version here: Opening Print Subscribe.
Comments are closed