This post goes out as an email to our subscribers every day and is posted for free here around 2 PM ET. To get your real-time copy, sign up for the free or premium version here: Opening Print Subscribe.
Follow @MrTopStep on Twitter and please share if you find our work valuable!
Our View
The Nasdaq Composite has closed higher for 12 sessions, its longest winning streak since 2009, and despite the tech bubble talk in October of 2025 and the big letdown since the US / Iran war, they look like a “safe haven.” If there is a resolution to the war, I expect tech to continue to outperform.
According to S3 Partners, the average short interest in U.S. software stocks has edged down to about 3.6% of their total shares available for trading, compared with around 3.8% at the end of March.
The VIX, which climbed to 35.30 on 03/09/26, sold off down to 17.40 yesterday. Clearly, there is no fear.
Our Lean
How long can the index markets go up without a 1% or 2% pullback? I think the question is… how high is high?
I do remember in 2009 when the ES and NQ went up sharply, but I don’t think they gained this much this fast. Yesterday, the ES gapped high, had a small rally up to the early high, and then dropped.
That said, calling highs has not worked, and while I think we could see some pullbacks, I think there would be good support between 6980 – 7030. On the upside, if the ES gets above 7095 and holds, 7030 to 7050 could come into play.
That’s all I have to say about that!
Guest Posts:

Get instant access to our partners’ real-time market data and insights not available anywhere else. Here is last night’s Founder’s note getting you ready for today’s market and explaining the constraints in yesterday’s market. – MrTopStep
Founder’s Note:
Futures are higher on OPEX Friday — ES +26bps, NQ +45bps. VIX at 18.15.
Housing starts data at 8:30.
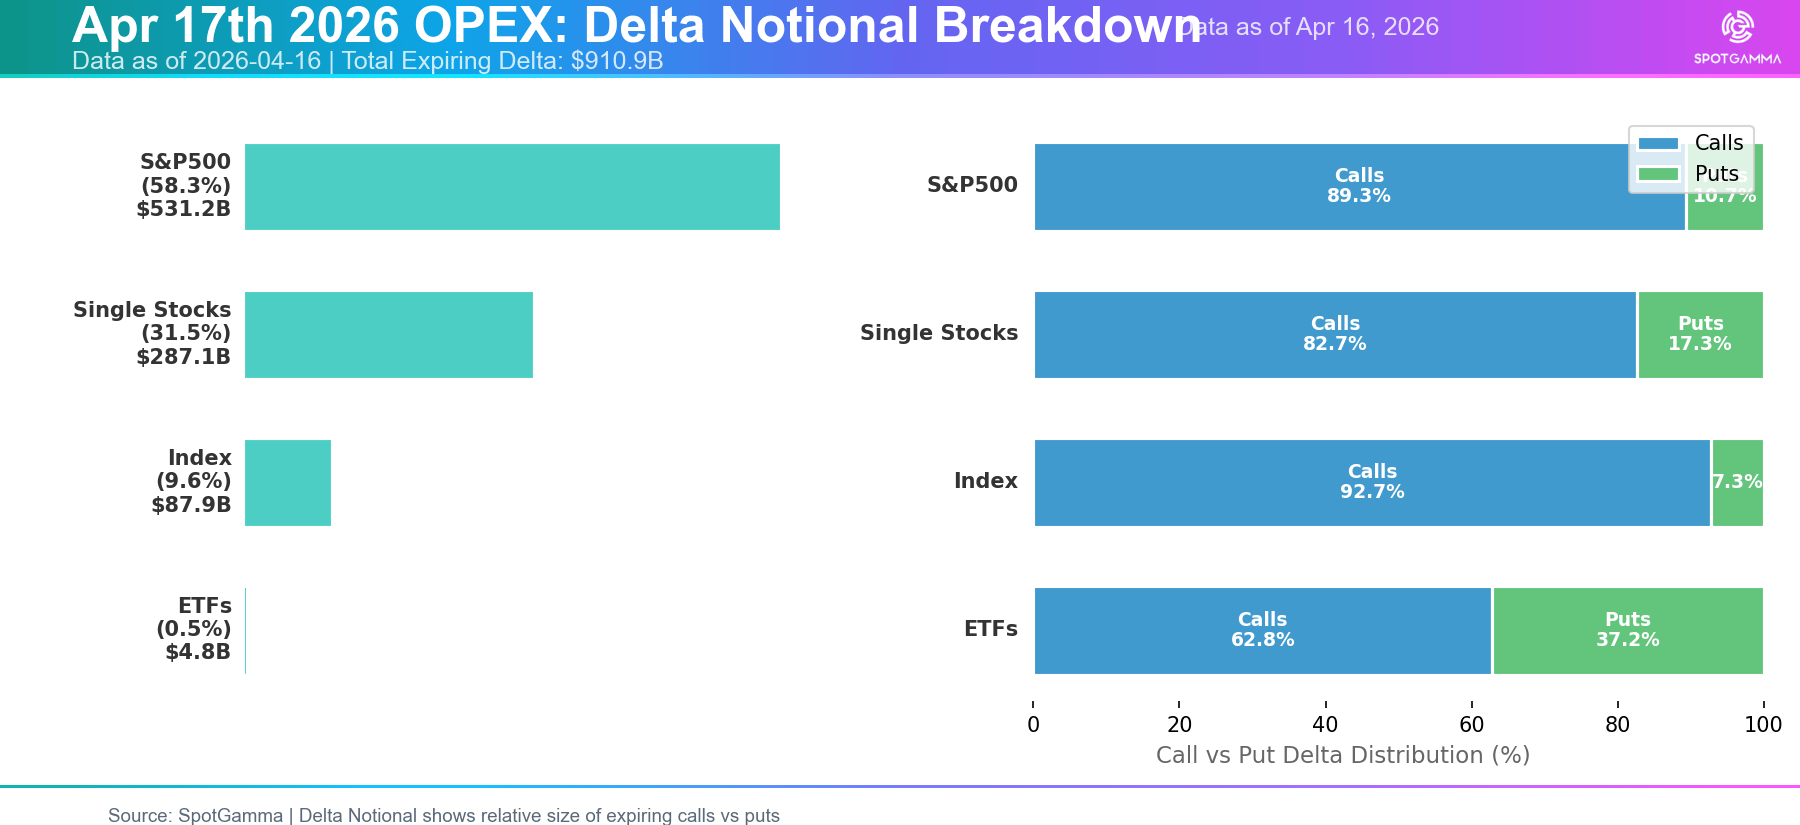
TLDR: OPEX day. Today the positive gamma blanket likely erodes. Dealer gamma has been supportive of the market all week — today that rolls off, and next week the dampening effect should reduce. The timing is critical: the April 21 ceasefire expiration is Monday, and that lines up with a gamma-reduced vulnerability on Monday. Outside of the Iran situation are the clear signs of single stock FOMO: VIX trading < SPX realized, record call volumes, etc.
Below we have the estimated OPEX impact measured in delta $ terms, and you can see it’s very call-heavy, with weights +80% which is as high we’ve ever seen. These values are driven by the huge equity rally since the start of April: SPX +11% in 2 weeks!
Typically we look for trends to pause and consolidate into expiration. Clearly the market has been surging higher into this expiration, an consolidation is what we have been discussing since Wednesday and VIX expiration. No doubt the market has thus far had other ideas, as the SPX pushes to fresh ATHs.
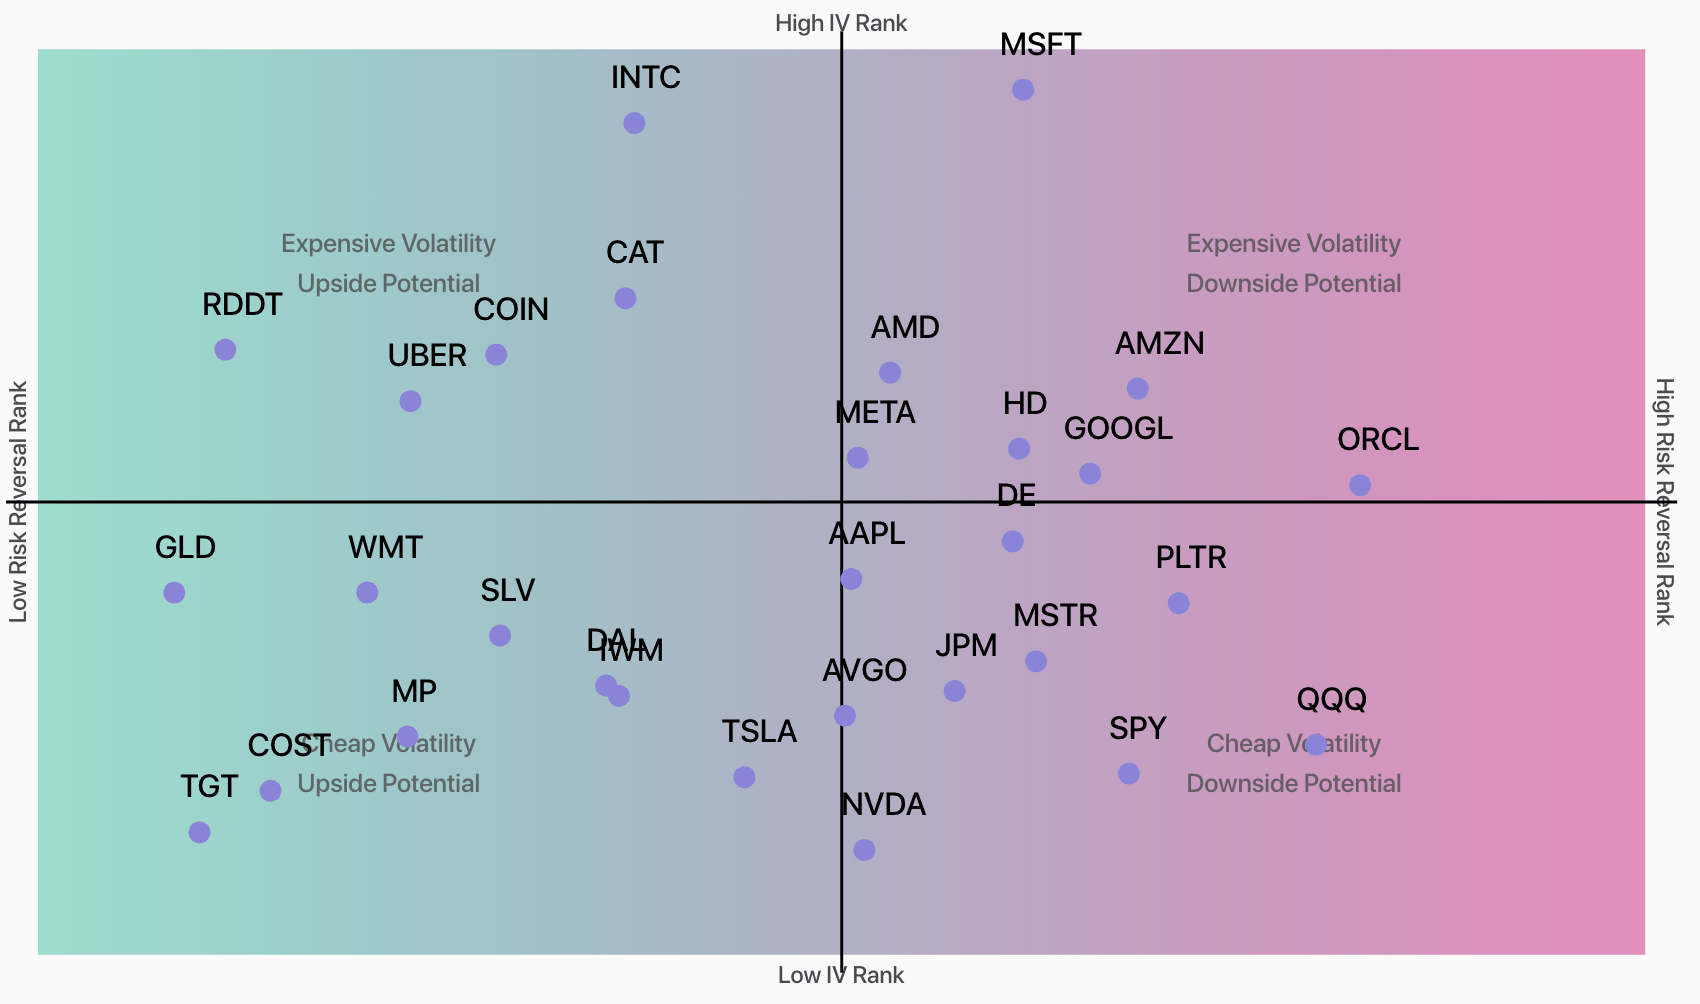
Outside of OPEX, the challenge we see here is the price of options. While 2 weeks ago calls were seemingly cheap, the landscape is much more expensive. You can see this via Compass, which shows the various major stocks dispersed across the map. This suggests that calls are now much more in favor, and IVs are high not only because of earnings, but also explosive moves higher. It’s hard to buy options at these prices and have them pay off.
OPEX is often a time where positions reset, and things may therefore take a breather. Then there are the apparent signs of FOMO, with stocks like BIRD (+300% in 2 days on AI pivot ), CAR (+300% in 2 weeks) etc.
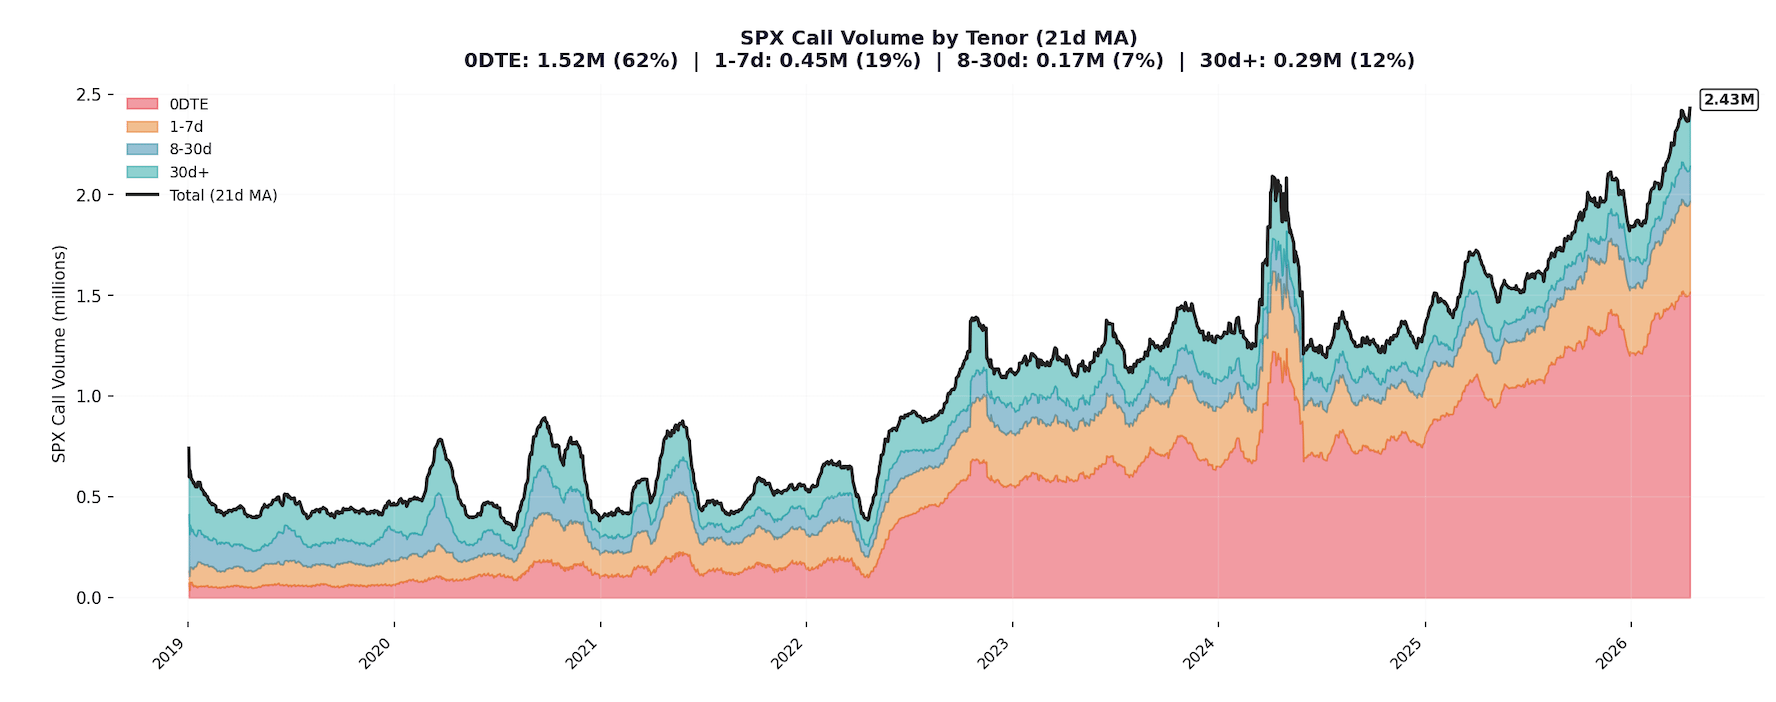
While there is a clear bid to single stocks, we simply cannot deny the surge in non-0DTE SPX calls. You can see this in the chart below, wherein non-0DTE call volume is just blowing it out. On this topic we note that SPX 0DTE volume %’s have decline sharply over the last few days: from sustainable daily levels +60% to daily marks of 50% over the last week. We quite frankly don’t have a great explanation for why call volumes would surge like this – but its big, and its non-0DTE. Over the medium term this seems rather bullish, but in the short term our read remains “overbought”.
All TenTen Capital LLC DBA SpotGamma materials, information, and presentations are for educational purposes only and should not be considered specific investment advice nor recommendations. Futures, foreign currency and options trading contains substantial risk and is not for every investor. An investor could potentially lose all or more than the initial investment. Risk capital is money that can be lost without jeopardizing one’s financial security or lifestyle. Only risk capital should be used for trading and only those with sufficient risk capital should consider trading. Past performance is not necessarily indicative of future results. VIEW FULL RISK DISCLOSURE https://spotgamma.com/model-faq/disclaimer/
Market Recap
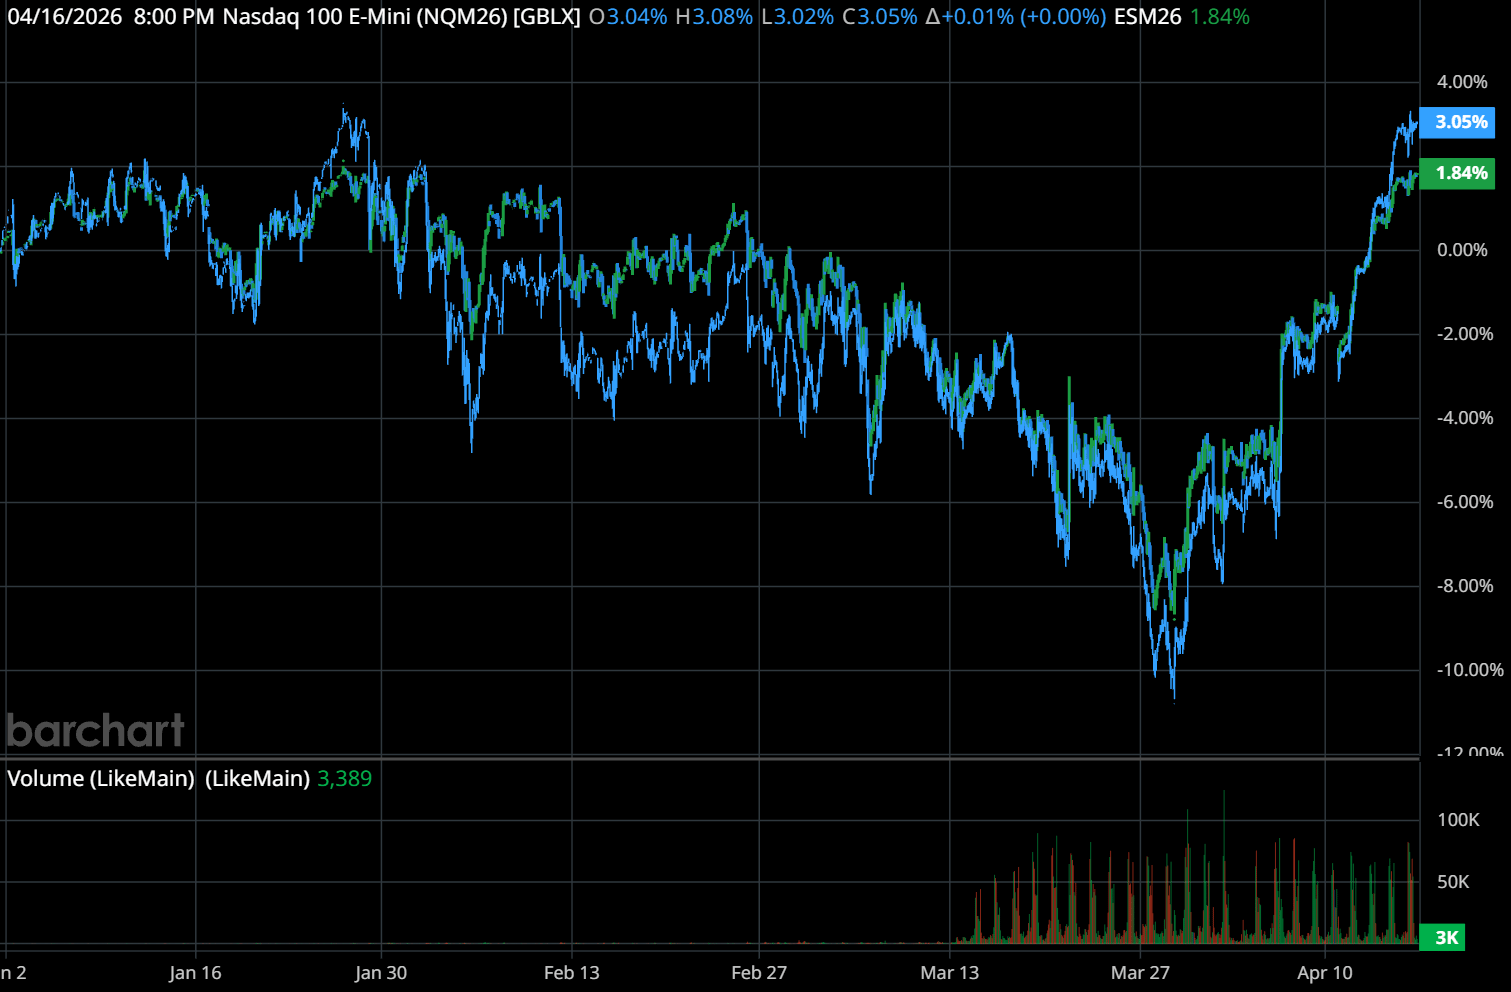
NQ/ES Year To Date
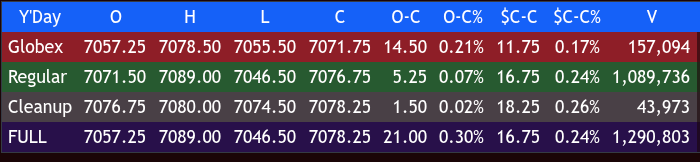
The ES traded up to 7078.50 early, sold off down to 7055.50 around 6:30 am, and opened Thursday’s regular session at 7071.50, up 11.5 points or +0.16%, with a total of 160k contracts traded.
After the open, the ES traded up to 7074.00 at 9:31. It then sold off down to 7046.50 at 9:55 and rallied up to a lower high at 7062.50. The ES sold off down to a higher low at 7047.75 at 10:20, then rallied up to a new high at 7081.75 at 11:15. It sold off down to 7067.50 at 11:30. At 12:43, it rallied up to a higher high at 7085.75 at 11:35, then pulled back to 7071.00. The ES rallied up to a new high at 7089.00 at 12:15, then sold off 25.75 points down to 7063.25 at 12:30.
It rallied up to a lower high at 7079.50 at 12:40, then sold off 20 points down to 7059.50 at 1:15. The ES rallied up to another lower high at 7076.50 at 1:45, then sold off 20.25 points down to 7056.25 at 2:25. It rallied 22 points up to 7078.25 and traded 7078.00 as the 3:50 cash imbalance showed $4.7 billion to buy, and traded 7076.25 on the 4:00 cash close.
After 4:00, the ES traded 7074.00 and settled at 7077.00, up 16.50 points or +0.23%. The NQ settled at 26,487.25, up 121.75 points or +0.46%, the YM settled at 48,767, up 98 points or +0.20%, and the RTY settled at 2,730.80, up 5.30 points or +0.19% on the day.
In the end, the index markets continue to forge higher unabated. In terms of the ES and NQ’s overall tone, the tech sector continues to be the lead. In terms of the ES’s overall trade, volume has fallen steadily over the last 6 sessions, with a total of only 1.29 million contracts traded.
I am going to cut this short. It’s 9:30 pm, and somehow I deleted the entire OP I had already written and had to rewrite it, and I don’t feel like being up till 11:00 to do a redo. What I can say is the ES is only down 0.11% over the last month, and only down 0.22% YTD. The NQ is only down 0.16% over the last month and is now down 4.13% YTD, and the RTY is down 0.12% over the last month and only down 1.21% YTD.
There is still no agreement to move the negotiations forward, but Trump is still saying the war is “very close to over” and that a second round “could be happening over the next two days” (as of his comments earlier this week). The White House has confirmed talks are under discussion and would “very likely” be in the same place as before, yet the current two-week ceasefire is set to expire around April 21, while the mediators are working on a possible extension to allow more time for diplomacy. Remember, it’s FRYday, and there could be an uptick in Trump headlines.


Live futures trading. Live automated trading. Live technical analysis and actionable set ups. Live 9:00 AM
YouTube

MiM
Market-On-Close Recap
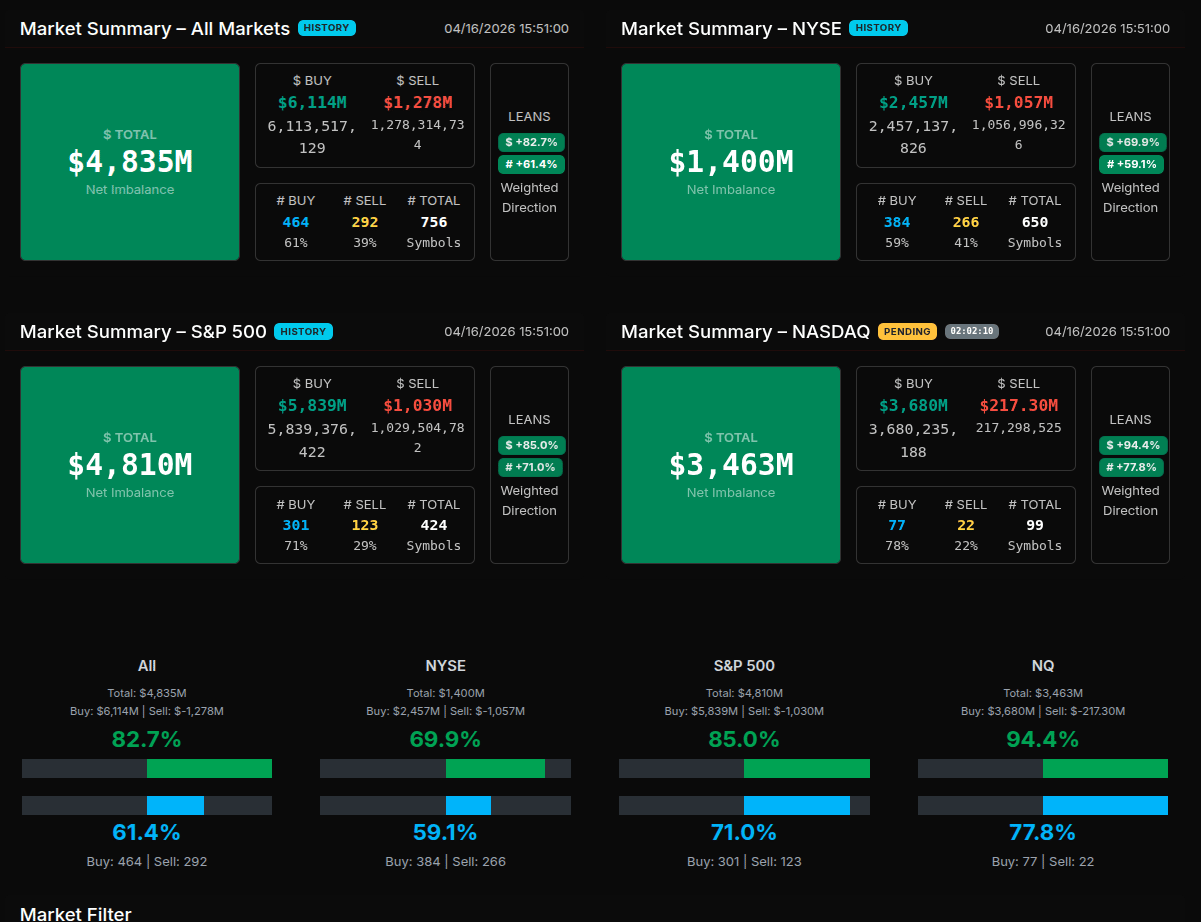
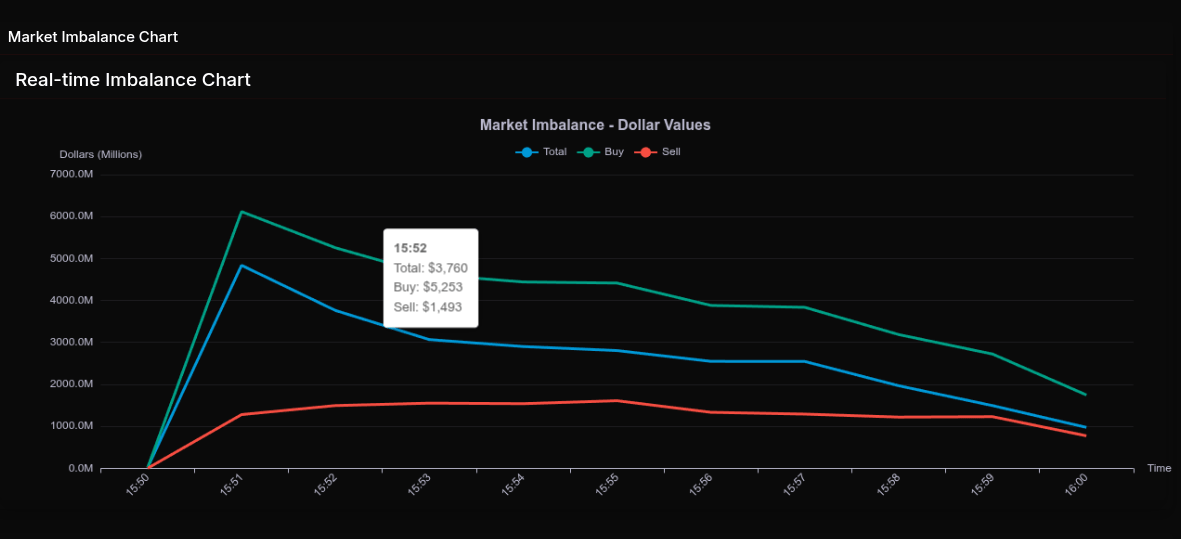
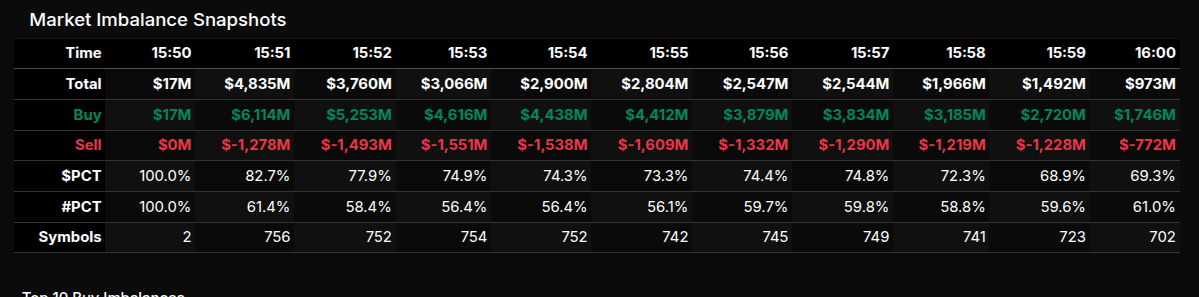
The MOC session opened with immediate and aggressive buy-side control, setting the tone for what became a structurally strong closing auction. At 15:50, the market printed a clean $4.8B buy, with buy orders reaching over $6.1B against just $1.2B for sale. This early expansion established a clear institutional bid, with $PCT holding above 80% and confirming a dominant directional lean rather than rotational flow.
As the session progressed, total imbalance gradually decayed from the peak, but importantly, the buy-side maintained control throughout. Even into the final prints, buy imbalances remained consistently above 68–74%, indicating sustained demand rather than late-session distribution. The decline into the close was orderly, characteristic of auction matching rather than a reversal in sentiment.
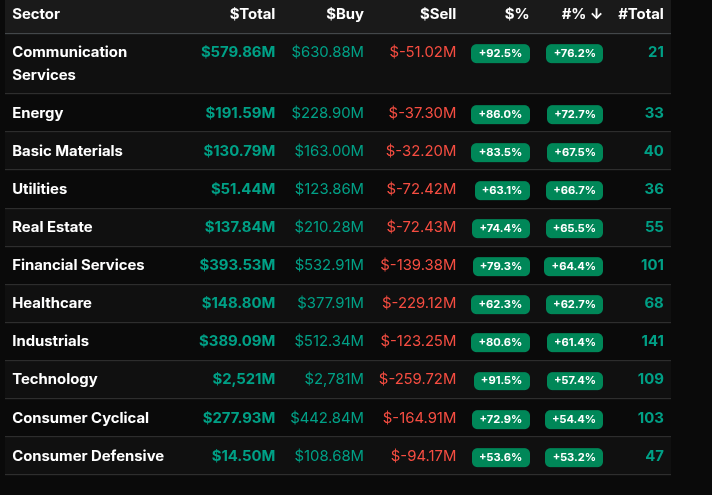
Sector flows reinforced this strong buy-side narrative. Communication Services (+92.5%), Technology (+91.5%), and Energy (+86.0%) all printed extreme positive leans above the 66% threshold, signaling broad institutional accumulation. Financials (+79.3%) and Industrials (+80.6%) also showed strong participation, confirming this was not isolated leadership but a market-wide bid. Even typically defensive or slower sectors like Utilities (+63.1%) and Consumer Defensive (+53.6%) leaned positive, though more rotational in nature.
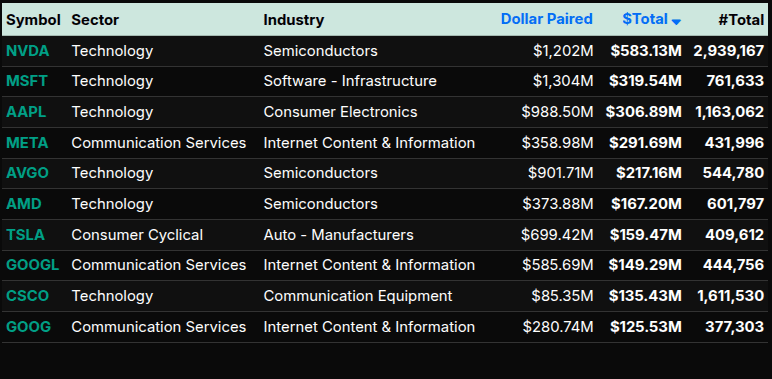
On the symbol level, the buy-side was led by mega-cap technology and communication names. NVDA, MSFT, and AAPL dominated with substantial dollar imbalances, alongside META and GOOGL, highlighting continued concentration in large-cap growth. Semiconductor names (NVDA, AVGO, AMD) were particularly active, reinforcing strength in that sub-sector.
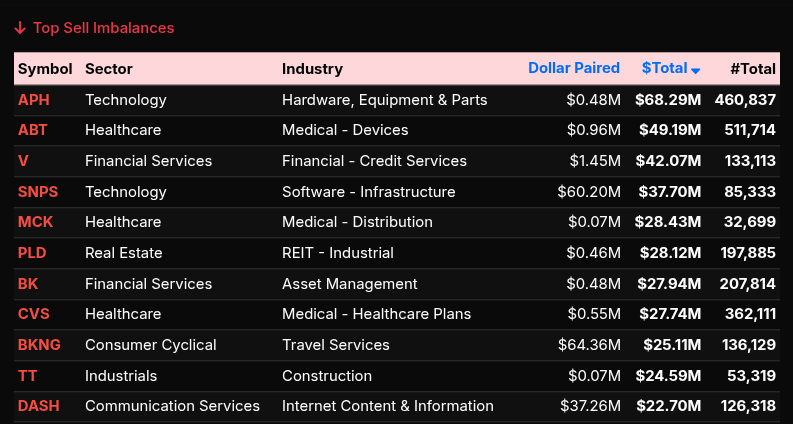
Sell-side activity, while present, was notably more fragmented. Names like APH, ABT, and V showed moderate sell pressure, but without the same scale or clustering seen on the buy-side. Healthcare and selective financial names contributed to the sell list, suggesting pockets of rotation rather than outright risk-off behavior.
Overall, this was a textbook buy-driven MOC auction, characterized by early institutional demand, broad sector participation, and sustained directional control into the close.
ES Levels
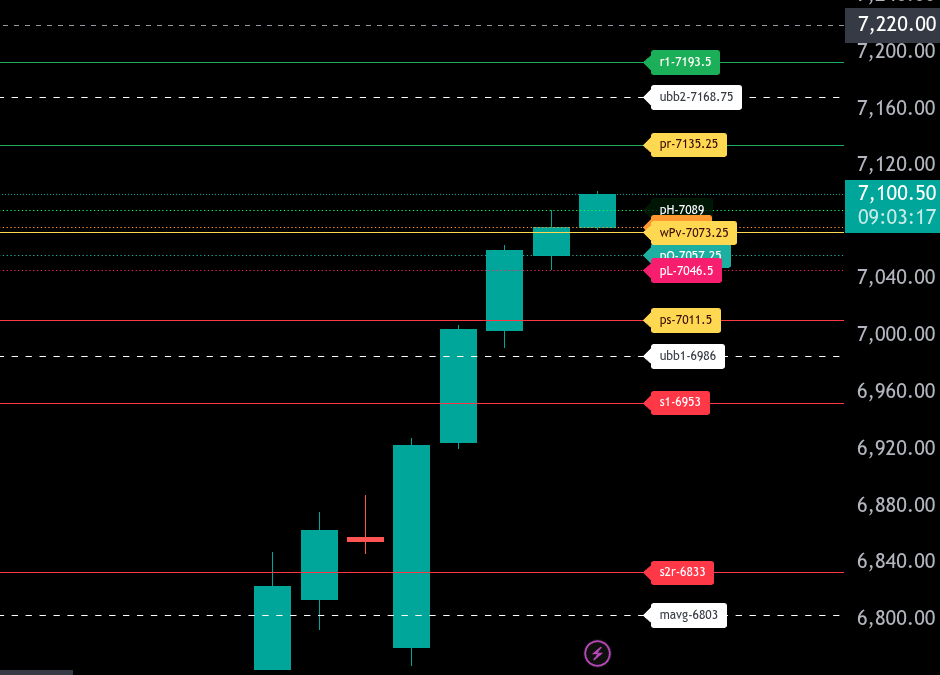
The bull/bear line for the ES is at 7073.25. This remains the key pivot for today’s session. Holding above this level keeps buyers in control, while acceptance below it would shift momentum back to the downside.
ES is currently trading around 7101.25, positioning price above the bull/bear line and indicating early strength during the Globex session. As long as price holds above 7073.25, dips into this area may offer buying opportunities targeting higher levels.
On the upside, the first resistance comes in at 7135.25, which is also the upper range target for today. A break and hold above this level opens the door for a move toward 7168.75, followed by 7193.50. Acceptance above 7135.25 would confirm continuation of bullish momentum.
On the downside, initial support sits at 7089.00 and then 7077.00, just above the bull/bear line. If price loses 7073.25, downside targets come into play at 7057.25 and 7046.50. The lower range target for today is 7011.50. A break below this level would signal a deeper pullback and potential shift in structure.
Overall, the market is showing strength above 7073.25, with buyers in control for now. However, failure to hold this level would quickly invalidate the bullish bias and bring sellers back into control..
NQ Levels
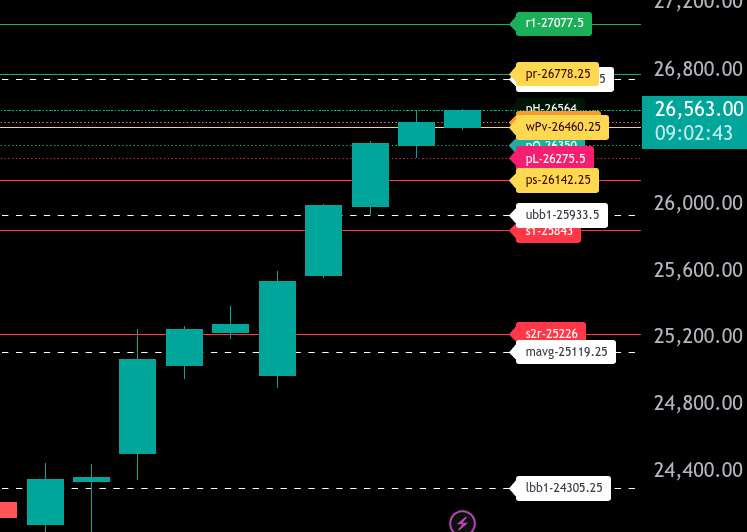
The bull/bear line for the NQ is at 26460.25. This level is key for directional bias today. Holding above it keeps the market in a bullish posture, while acceptance below would shift momentum back to the downside.
NQ is currently trading around 26563.25, holding above the bull/bear line after a strong overnight push. As long as price remains above 26460.25, buyers are in control and dips into this level may offer support for continuation higher.
On the upside, resistance comes in at 26564.00, which is being tested, followed by 26647.25. A break and hold above these levels opens the door for a move toward 26778.25, the upper range target for today. Sustained acceptance above this level would signal strong bullish expansion.
On the downside, initial support sits at 26460.25, followed by 26350.00. If price loses the bull/bear line, expect a rotation lower toward 26275.50 and then 26142.25, which is the lower range target. A break below this level would indicate deeper corrective pressure.
Overall, the market is leaning bullish above 26460.25, with momentum favoring continuation higher unless that level is lost. Watch for responsiveness at 26564.00 as a near-term pivot for intraday direction.
Technical Edge
Fair Values for April 17, 2026
-
SP: 35.33
-
NQ: 153.59
-
Dow: 170.97
Daily Breadth Data 📊
For Thursday, April 16, 2026
• NYSE Breadth: 58% Upside Volume
• Nasdaq Breadth: 58% Upside Volume
• Total Breadth: 58% Upside Volume
• NYSE Advance/Decline: 50% Advance
• Nasdaq Advance/Decline: 53% Advance
• Total Advance/Decline: 52% Advance
• NYSE New Highs/New Lows: 79 / 11
• Nasdaq New Highs/New Lows: 280 / 60
• NYSE TRIN: 0.74
• Nasdaq TRIN: 0.81
Weekly Breadth Data 📈
Week Ending Friday, April 10, 2026
• NYSE Breadth: 55% Upside Volume
• Nasdaq Breadth: 67% Upside Volume
• Total Breadth: 63% Upside Volume
• NYSE Advance/Decline: 68% Advance
• Nasdaq Advance/Decline: 40% Advance
• Total Advance/Decline: 51% Advance
• NYSE New Highs/New Lows: 220 / 122
• Nasdaq New Highs/New Lows: 410 / 419
• NYSE TRIN: 1.77
• Nasdaq TRIN: 0.33
Calendars
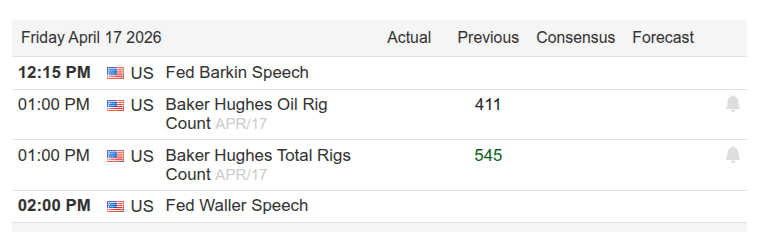
This Week’s High Importance
Trading Room News:
Polaris Trading Group Summary – For Thursday, April 16, 2026
The session unfolded as a textbook Cycle Day 1 with strong adherence to the morning plan and excellent execution around key levels.
Morning – Structured Start, Two-Sided Opportunity
David laid out clear scenarios centered around the 7055 pivot zone, calling for:
-
Bullish continuation above → targets 7075 → 7085 → 7090
-
Bearish rotation below → targets 7045 → 7035 → 7025
Early on, the market delivered exactly what was anticipated—both the 7075 upside and 7045 downside targets were hit quickly. This reinforced the importance of trusting the levels and staying flexible. The initial move transitioned into a “normal Cycle Day 1 decline”, with expected back-and-fill price action after the prior strong rally.
Key lesson: Don’t overreact to early chop—Cycle Day structure often includes two-way trade before direction resolves.
Midday – Patience Rewarded, Bull Shift Identified
David identified a bull re-shift after the pullback, signaling traders to lean long again. This shift was critical—those who stayed patient and aligned with structure were rewarded.
-
Open Range trades in ES and NQ were winners
-
CL produced a partial win
-
The market transitioned cleanly from rotational chop into trend continuation
Afternoon – Trend Holds, Targets Complete
Momentum carried into the afternoon with:
-
Upside targets fulfilled (notably 7085 area)
-
Bulls holding prior highs (~7064) without giving ground
-
Strong indication of under-invested participants chasing
The day closed with a $4.7B MOC buy imbalance and a strong bid into the close—clear confirmation of bullish control.
Overall Takeaways
-
Excellent adherence to the Daily Trade Strategy → both sides of the market hit as planned
-
Patience through chop led to high-quality entries later
-
Bull/bear shifts matter—waiting for confirmation avoided getting trapped
-
Strong trend days often reward re-entry after pullbacks, not just the initial move
David summed it up well: “Well-played Cycle Day 1” with full target completion.
Looking Ahead:
Friday framed as Capital Preservation Day—a reminder to protect gains after a clean, high-quality session.
DTG Room Preview – Friday, April 17, 2026
Macro Focus: Middle East de-escalation + corporate earnings
Geopolitics:
-
Israel–Lebanon agreed to a 10-day ceasefire
-
Growing optimism around a potential US–Iran deal (no confirmation from Iran yet)
-
Some officials expect ~6 months to finalize a deal
-
Shift from escalation → stabilization is pushing oil lower
Equities / Earnings:
-
NFLX: -9% after hours despite Q1 beat
-
Weak Q2 guidance
-
Lost WBD deal
-
Reed Hastings leaving board in June
-
-
AAPL: iPhone shipments in China +20% (overall market -4%)
-
TSLA: Hiring advanced semiconductor engineers (AI chips, <7nm, 2nm focus)
Today’s Calendar:
-
No US economic data
-
Fed speakers: Daly (11:30), Barkin (12:15), Waller (2:00)
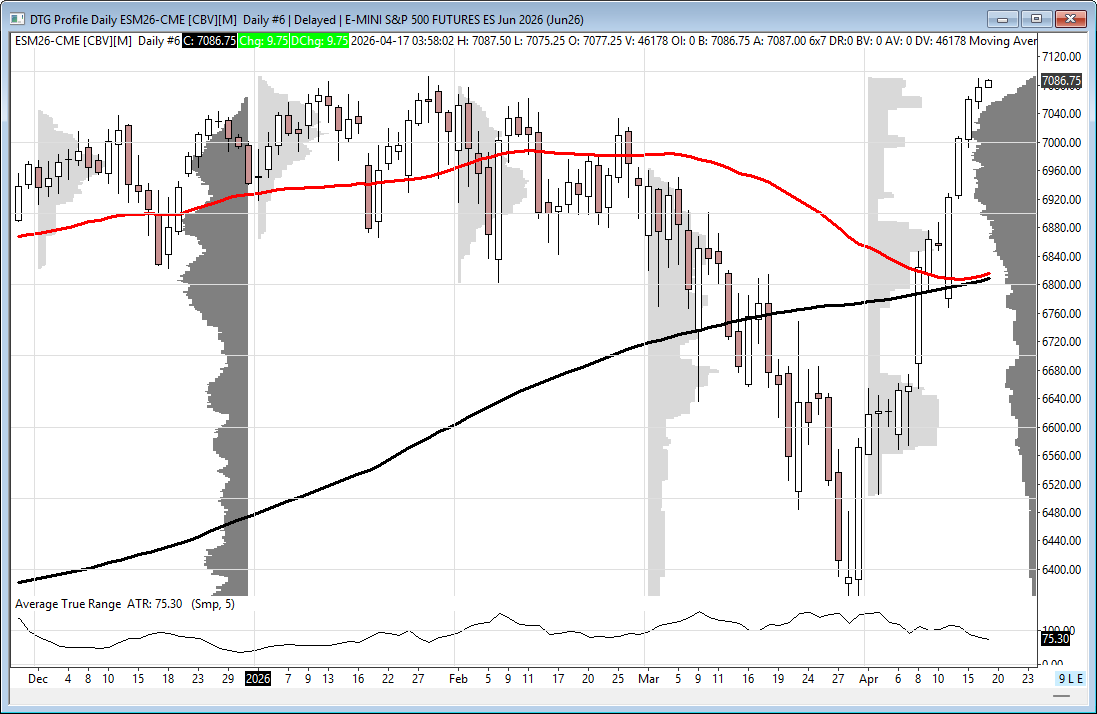
Market Conditions:
-
Volatility continues to contract as S&P hits new highs
-
ES 5-day ATR down to ~81 points
-
Whale positioning leaning bearish into open
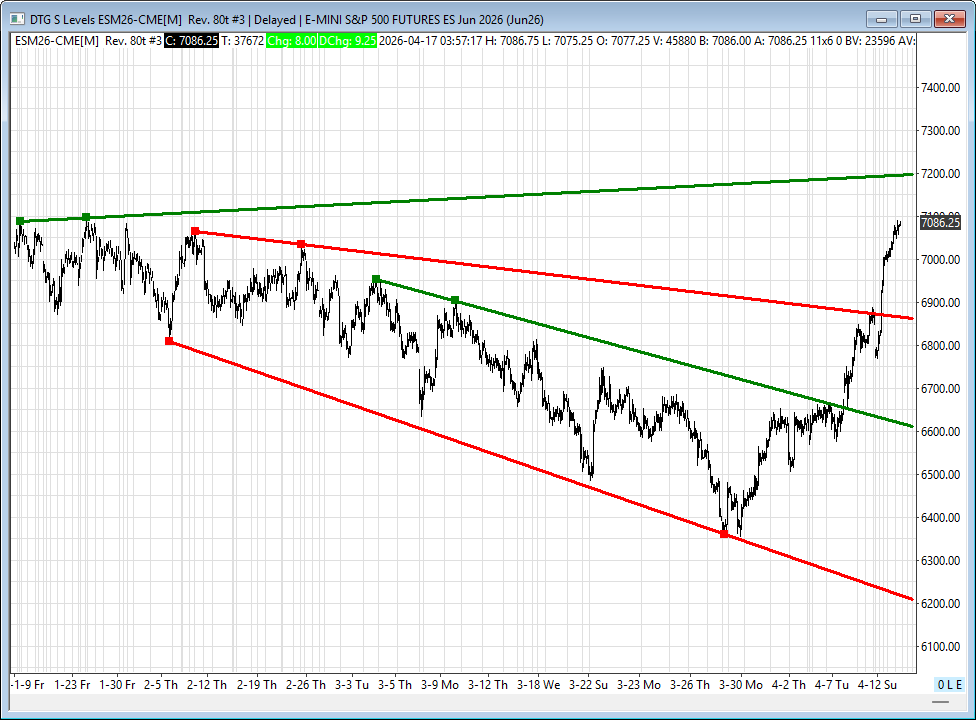
Technical (ES):
-
Trend remains bullish (50DMA above 200DMA)
-
Resistance: 7197–7202
-
Support: 6862–6857, 6610–6605, 6210–6205
Affiliate Disclosure: This newsletter may contain affiliate links, which means we may earn a commission if you click through and make a purchase. This comes at no additional cost to you and helps us continue providing valuable content. We only recommend products or services we genuinely believe in. Thank you for your support!
Disclaimer: Charts and analysis are for discussion and education purposes only. I am not a financial advisor, do not give financial advice and am not recommending the buying or selling of any security.
Remember: Not all setups will trigger. Not all setups will be profitable. Not all setups should be taken. These are simply the setups that I have put together for years on my own and what I watch as part of my own “game plan” coming into each day. Good luck!!
Follow @MrTopStep on Twitter and please share if you find our work valuable!
This post goes out as an email to our subscribers every day and is posted for free here around 2 PM ET. To get your real-time copy, sign up for the free or premium version here: Opening Print Subscribe.
Comments are closed