This post goes out as an email to our subscribers every day and is posted for free here around 2 PM ET. To get your real-time copy, sign up for the free or premium version here: Opening Print Subscribe.
Follow @MrTopStep on Twitter and please share if you find our work valuable!

As you all know, I have been very pointed in saying that the war in the Middle East was not going to be a 2 to 3-week war like Trump thought, and as of today, it’s 66 days and counting. Who i? I think the US and Israel have inflicted heavy damage, but Iran has wiped out 16 of 19 US bases in the Middle East, with 13 of these bases reported as nearly uninhabitable. Iranian forces have strategically targeted high-value assets, specifically prioritizing the destruction of advanced missile defense components and critical communications infrastructure, such as THAAD radar arrays and AN/TPY-2 systems. While the Pentagon officially estimates direct war costs at $25 billion, independent reports suggest the true financial impact—including infrastructure repairs and the replacement of specialized hardware like the $750 million E-3 AWACS—could reach between $40 billion and $50 billion.
Beyond the hardware, the human toll remains significant for the 50,000 personnel stationed in the region, with official casualty reports currently standing at 15 soldiers killed and over 530 wounded as the conflict impacts the overall effectiveness of regional air defense. That said, for almost five decades, Iran’s Islamic government has survived financial pressure from the U.S. by selling oil to China. It confronted American military might with guerrilla tactics.
For nearly fifty years, Iran utilized guerrilla tactics and a “shadow fleet” of tankers to bypass U.S. financial pressure and maintain oil exports to China, but this long-standing strategy appears to have met its match with the current U.S. naval blockade. Although Tehran initially gained leverage in February by disrupting a fifth of the world’s oil and gas supplies via the Strait of Hormuz, the American response of cordoning off all Iranian ports has effectively neutralized Iran’s ability to conduct clandestine sea transfers. Now, with U.S. warships extending their reach into the Indian Ocean, the network of shadow ships that once defied sanctions has been successfully dismantled, leaving the regime in a state of unprecedented economic isolation.
I believe the US has the upper hand with the blockade of the Strait, and the UAE leaving OPEC could be signaling a new Middle East order. They say the blockade has cost Iran $2.2 billion so far, and their economy is being described as being in a “death spiral.” According to the IMF, Iran’s GDP and growth are expected to see a sharp contraction of -6.1% for 2026, with annual inflation officially estimated between 65% and 70%, though prices for staples like food and construction materials have doubled in the last month alone on top of the 2 million jobs lost in the last 2 months—bringing the total number of employed citizens down to approximately 22 million out of a working-age population of 66 million, while its currency, the rial, has been hitting all-time lows last week.
USD / IRR Exchange Rate Trend
Date Rate (IRR per USD) Change Notes
Early 2025 ~600,000 — Pre-escalation baseline
Apr 28, 2026 ~1,600,000 +166.7% Post-blockade shock
May 1, 2026 ~1,810,000 +13.1% New record low
I think Iran is looking for a way out, and delivered a new peace proposal to the U.S. via Pakistani mediators on May 1. Iran is trying to decouple the Strait of Hormuz from its nuclear program. They are offering to reopen the Strait in exchange for ending the blockade, but they are insisting on deferring nuclear and missile negotiations to a later date. President Trump stated on Friday that he is “not satisfied” with the latest proposal, signaling that Washington will not accept a deal that does not include immediate nuclear concessions.
With regard to the US stock market, I can’t say the high is in, but the late sell-off wasn’t good—especially when you add up some of the US’s own economic problems like the continued rise in Treasury yields, the US deficit jumping to over $39 trillion, last week’s GDP growth miss, continued geopolitical risks, unemployment at 4.3% and trending upward, and stagflation.
Our View
There is a very high level of moving parts this week, and with the ES closing on new highs on Friday and up 5 weeks in a row—having its longest winning streak since 2024 and up 14% over the last month—I believe there is reason to be concerned.
That said, it was not all good news on Friday. Trump shot down another Iranian proposal for ending the war after Iran offered some compromises, and it wasn’t good news for traders who were betting on a government-backed deal to save Spirit Airlines; they are now facing big losses after shares of Spirit Aviation dropped about 60% over-the-counter to less than 60 cents.
As we go into this week’s jobs report, more than 113,000 tech workers have been laid off so far in 2026 across 179 major events, which include Intel cutting 15,000 employees through Q2, UPS shedding 30,000 positions, and Amazon reducing its corporate staff by 16,000 roles.
These figures are joined by the loss of approximately 12,800 jobs at Spirit Airlines as it ceased operations on May 2, alongside Snap cutting 1,000 employees in April, and smaller regional reductions slated for Bank of America in New York and Gilead Sciences in California later this quarter.
And lastly, the Bureau of Labor Statistics reported a rise in the unemployment rate to 4.3% in March, with revisions showing larger-than-expected job losses in February. The weeks ahead could be filled with landmines.

After Friday’s high, and with the exception of a few dips and filled rips, the ES kept going down into the cash close and into the futures close; it was not a good close. The question is: after a 5-week rally, are the markets setting up for the long-awaited pullback?
One would think so, but the wild card remains a US / Iran deal that seems elusive but not impossible. I don’t think Trump’s intention was to start a global recession; he really thought Israel and the US could pound Iran into submission, but so far that hasn’t happened, and furthermore, Iran had been preparing for the long game.
There have been a lot of downside false starts over the last five weeks, but so far, the markets have continued to march higher. Was Friday’s big early rip an exhaustion rally? It looked like that based on the close. I don’t think there is much to say that I haven’t already said.
We all know the market is over-extended, and up to this point, it hasn’t mattered, but this week could be a test of that. Not that I put much credence into this, but major U.S. banks are signaling tactical caution as the market rally faces mounting headwinds: JPMorgan warns the rebound may be premature due to sticky inflation and a rich 20.9 SP500 forward P/E (5y avg. 19.9, 10y 18.9), while Goldman Sachs highlights the narrowest market breadth since the dot-com era alongside geopolitical risks.
Morgan Stanley concerns itself with a potential “growth shock” driven by rising energy costs, and Bank of America advises pivoting toward small caps and emerging markets to hedge against “brittle” volatility in mega-cap tech shares.
Our Lean: A lot of times when the ES goes out on its low, it rallies on Globex, and I have a rule about the last few days of the month and the first three days of the new month: money tends to be put to work. Last Thursday, there was $3.5 billion to buy, and Friday, there was $500 million to buy, and according to Rich @HandelStats, when the 2nd trading day of May is a Monday, the stats are positive.
I still didn’t like how the ES closed, but volume has dropped so much in the last six sessions that “thin to win” has been a big factor in pushing the index markets higher. However, a late post on Trump’s Truth Social said the U.S. Navy will start guiding ships from foreign countries through the Strait of Hormuz today and warned that if Iran tries to disrupt the process, the American military will use force.
I am taking a very guarded view of this and still think the markets are overbought and over-extended, but again, if the volume is low… Well, we could see higher prices, but keep an eye on the CLM26.
I didn’t know until I wrote this that Stock Trader’s Almanac has the first 3 days of May as up days, but this is something I have written about for years; just good to see that Jeff agrees.
📊 ES MARKET PROFILE MAP
POC: 7,258.00 | Expanded Range: 7,390.00
────────────────────────────────────────────
🔴 ZONE 1: THE STRATOSPHERE (EXTREME EXTENSION)
7,390.00 — R5 Extension → Absolute ceiling
7,377.50 — R4 Pivot → Exhaustion zone
7,352.25 — R3 Pivot → Trend extension
7,326.50 — R2 Pivot → Breakout continuation
7,300.75 — 52W HIGH (“Tail”) → P-shape trigger
🟠 ZONE 2: UPPER VALUE AREA (RESISTANCE)
7,292.25 — R1 Pivot → Breakout barrier
7,286.75 — VAH → Value shift trigger (hold above)
7,279.75 — IB High → Rejection = rotation lower
⚪ ZONE 3: NEUTRAL CORE (BALANCE)
7,266.50 — Intraday Pivot → Magnet
7,258.00 — POC → Primary balance
🟢 ZONE 4: LOWER VALUE AREA (SUPPORT)
7,254.25 — IB Low → Break = liquidation
7,240.75 — VAL → Institutional defense
7,232.25 — S1 Pivot → LVN (fast move if lost)
🔵 ZONE 5: THE ABYSS (DEEP VALUE)
7,206.50 — S2 Pivot → HVN (late April)
7,171.00 — Demand → April 28 agreement
7,148.00 — Trend Line → Bull structure risk
6,727.08 — Fib 61.8% → Correction target
6,549.88 — Fib 50.0% → Long-term value
────────────────────────────────────────────
⚡ EXECUTION GUIDE
🔄 SCALP:
7,254.25 ↔ 7,279.75 (mean reversion)
🚀 BREAKOUT:
Above 7,286.75 (VAH) → 7,300.75 → extensions
💥 BREAKDOWN:
Below 7,240.75 (VAL) → 7,206.50 target
────────────────────────────────────────────
🧠 STRUCTURE
Above VAH → Value migration higher
Below VAL → Liquidation / b-shape
At POC → Balance / chop

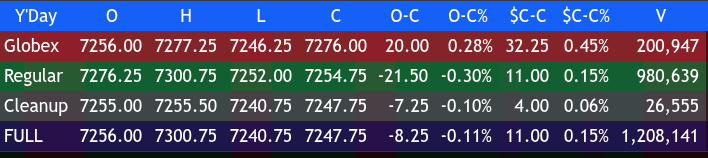
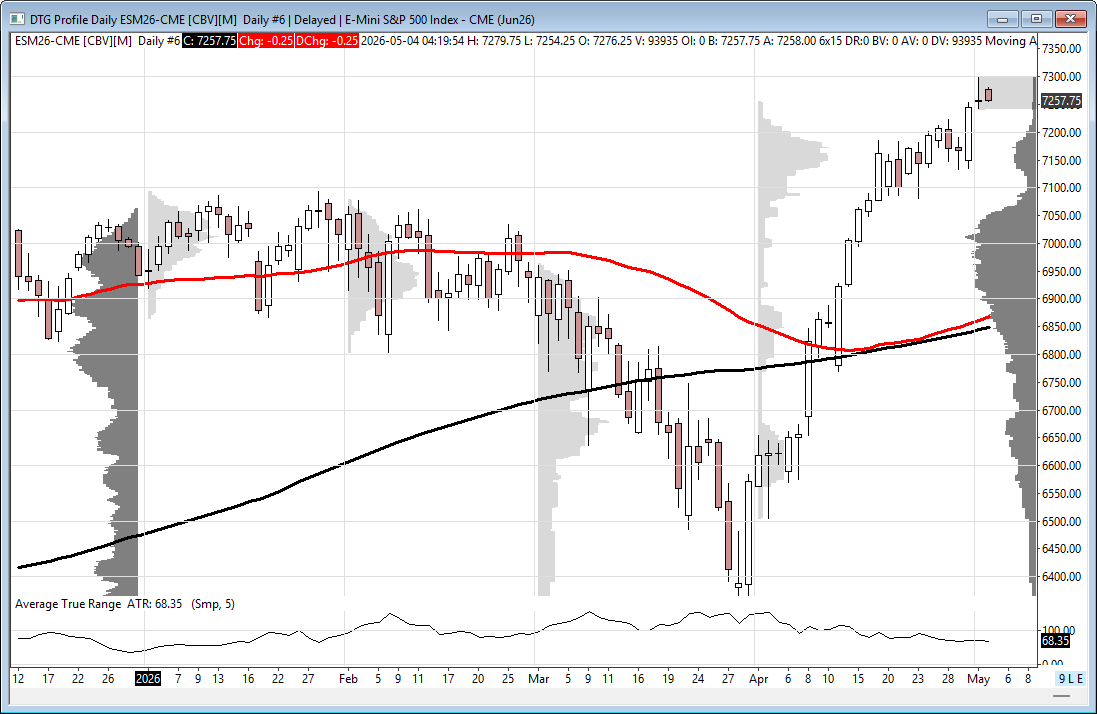
At 9:25 am Friday, the ES had a 7246.50 to 7271.50 Globex trading range with low Globex volume of 143k contracts traded and opened the 9:30 regular session at 7264.50, up 26.25 points or +0.36%.
After the open, the ES traded 7258.75 and then rallied 42.00 points up to 7300.75 at 10:20. It sold off 26.25 points down to 7274.50 at 10:35, rallied up to 7284.50 at 10:45, and then sold off down to a new low at 7271.50 at 11:00. From there, the ES rallied up to 7295.75 at 11:50 and then sold off 29.75 points down to 7266.00 at 12:45. It stutter-stepped up to a lower high at 7283.75 at 1:50 and then started stutter-stepping lower, selling off down to 7259.00 at 2:40.
The ES rallied up to 7277.00 at 3:25, sold off down to 7269.50 at 3:48, and traded 7270.75 as the 3:50 imbalance showed $500 million to buy. It then sold off down to 7257.00 and traded 7257.50 on the 4:00 cash close.
After 4:00, the ES traded down to a new low at 7240.75 at 4:55 and settled at 7243.75, up 14.25 points or 0.20%, up 5 of the last 10 sessions. The NQ settled at 27,596.00, up 270.75 points or +0.99%, up 4 of the last 6 sessions; the YM settled at 49,646, down 189 points or -0.38%, down 7 of the last 8 sessions; and the RTY settled at 2,819.30, up 11.5 points or +0.41%, up 4 of the last 6 sessions.
In the end, it was a thrashing early rally and a thrashing late-day risk-off sell-off, which I warned about in Friday morning’s lean. In terms of the ES’s overall tone, it’s hard to say anything bad, but I mentioned, after getting smoked trying to sell it, that it acted tired at the highs. In terms of the ES’s overall trade, volume was extremely low for the size of the moves: 143k traded on Globex and 1.05 million traded on the day session for a total of 1.2 million contracts traded.
This Week’s Major U.S. Economic Reports & Fed Speakers
We have a very big week ahead. More than 100 companies in the S&P 500 are set to post results next week, and so far are on track to climb 28.7% in the first quarter from a year ago. Key economic data includes PMI, ADP, Consumer Credit, and the Friday jobs report, along with some big Treasury refunding, 10 Fed speakers, and the ongoing war in the Middle East. I expect this to be a very busy week of trade.
-
MONDAY, MAY 4: 10:00 am Factory orders; 12:50 pm NY Fed Pres. John Williams speaks; Palantir (PLTR) after the bell
-
TUESDAY, MAY 5: 8:30 am U.S. trade balance; 9:45 am S&P final U.S. services PMI; 10:00 am Job openings, New home sales (incl. delayed), ISM services, Fed Vice Chair Michelle Bowman speaks; 12:30 pm Fed Gov. Michael Barr speaks; Advanced Micro Devices (AMD) after the bell
-
WEDNESDAY, MAY 6: 8:15 am ADP employment; 1:00 pm Chicago Fed Pres. Austan Goolsbee speaks; 1:00 pm 3-Year Note: $58 billion, 10-Year Note: $42 billion, 30-Year Bond: $25 billion
-
THURSDAY, MAY 7: 8:30 am Initial jobless claims, U.S. productivity; 10:00 am Construction spending (incl. delayed); 1:00 pm Minneapolis Fed Pres. Neel Kashkari speaks; 3:00 pm Consumer credit; 3:30 pm NY Fed Pres. John Williams speaks
-
FRIDAY, MAY 8: 5:45 am Fed Gov. Lisa Cook speaks; 8:30 am U.S. employment report; 10:00 am Wholesale inventories, Consumer sentiment (prelim); 7:30 pm Fed panel – Goolsbee, Daly, Bowman, Waller


Jeff Hirsh – Stock Trader’s Almanac
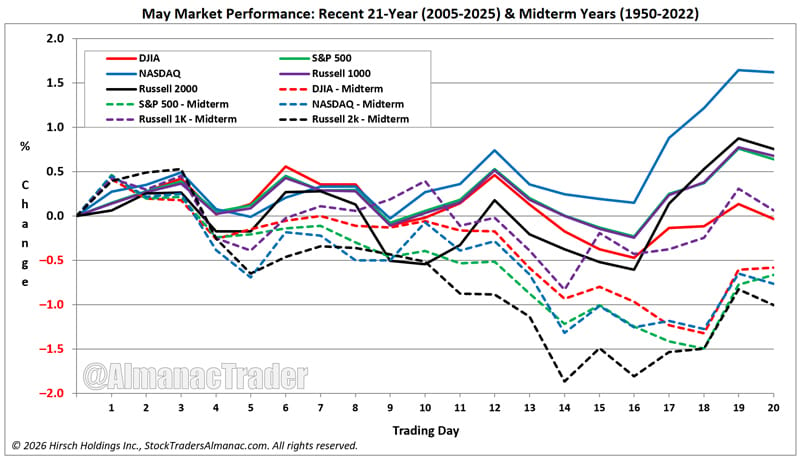
According to Jeff Hirsch from the Stock Trader’s Almanac or @Alamanctrader on X, the “Early May Strength Turns to Chop Until Late Month Pop.”
Over the last 21 years, the first three days of May have historically traded higher, and the S&P 500 has been up 19 of the last 28 first trading days of May. Bouts of weakness often appear around or on the fourth, sixth/seventh/eighth, and after the twelfth trading day of the month, while the last four trading days have generally enjoyed respectable gains on average, but the last day of May has weakened noticeably.
In midterm years, dashed lines in the accompanying chart, May has generally opened with a gain, but by the third trading day, broad weakness has typically set in and lasted until nearly the end of the month.
Manny – @manny_trends
The Market That Refuses to Break
There are times when the narrative says one thing…
And price says another.
This is one of those times.
What We Keep Seeing
The book has been pretty clear.
The more puts that show up… the higher this market wants to go.
That’s not opinion.
That’s flow.
This week, the tape was flooded with puts.
And what did price do?
It didn’t break.
It lifted.
The Levels Told the Story
We’ve been working with two key areas:
7125 → the line for weakness
7160–7170 → the breakout zone
We tested 7100
That was the moment.
If the market was going to roll over, that’s where it happens.
Instead?
Price held… and pushed higher.
Then we got the next signal.
Break 7200 7220, and the path opens.
What was the expectation?
7205 minimum.
That’s not hindsight.
That’s structure.
Why This Keeps Happening
A lot of traders are still trying to make sense of this through headlines.
Earnings.
Economy.
Geopolitics.
Trying to connect dots.
But the market isn’t trading headlines.
It’s trading flow.
Dealers don’t care about the narrative.
They care about positioning.
They care about premium.
They care about where the money is.
And right now, the setup has been simple:
• Sell premium
• Hedge flows
• Push price where positioning forces it
The Machine
This is where traders get frustrated.
Because it doesn’t always “make sense.”
But it doesn’t have to.
This is a machine-driven market.
And the machine is doing one thing:
Selling premium and buying cheap risk.
That’s it.
Everything else is noise.
When Does It Change?
This is the question that matters.
When do we stop seeing this behavior?
The answer hasn’t changed.
Below 7125.
That’s where flow flips.
That’s where weakness becomes real.
Until then?
Pullbacks are getting bought.
And upside pressure remains.
The Trap
The trap right now is thinking:
“This shouldn’t be happening.”
Maybe.
But it is.
And as traders, we don’t get paid for being right about the narrative.
We get paid for being right about price.
The Bottom Line
The book is still in control.
As long as puts keep coming in…
The market has fuel.
Not because things are perfect.
But because positioning demands it.
So the job remains simple.
Respect the levels.
Respect the flow.
And don’t fight a market that refuses to break.
If this bigger picture is the map, my daily setups are the execution plan. I post them each morning on my X feed, @manny_trends, where I share the levels and structure I am watching for the day ahead.
Manny Payano
@manny_trends

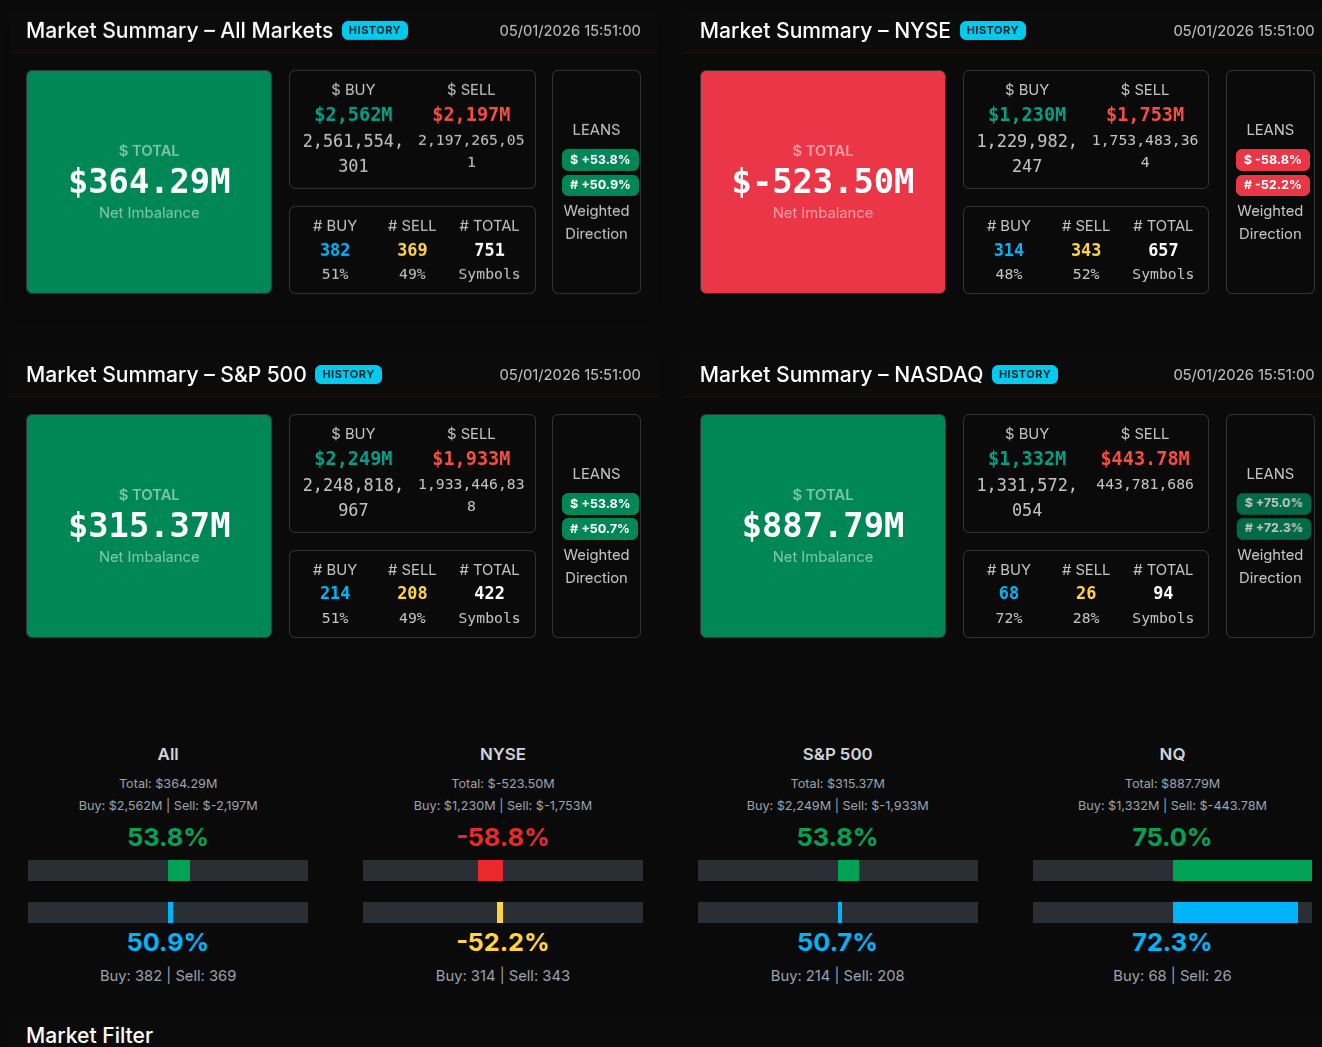
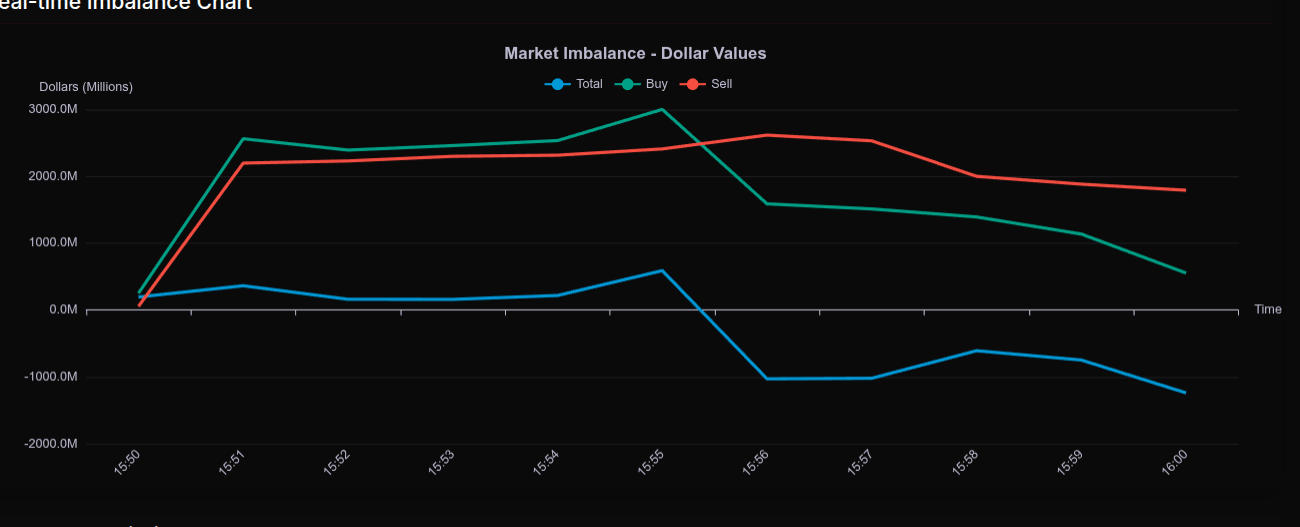
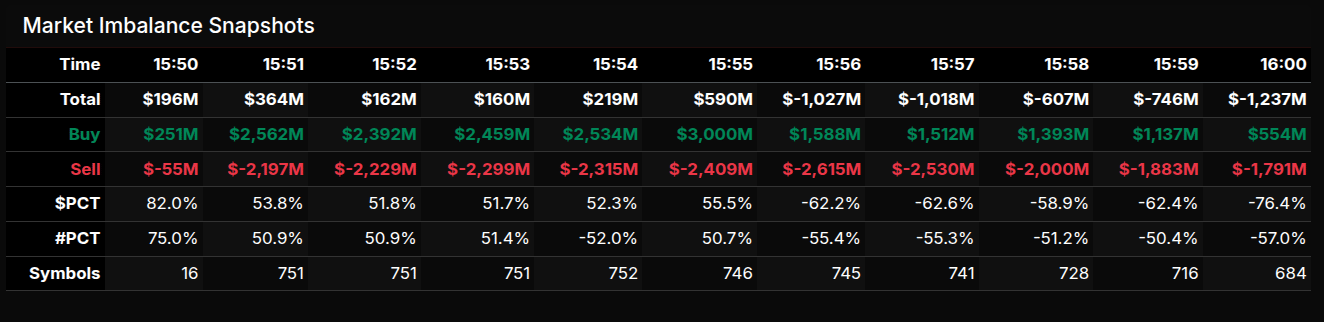
The May 1 MOC opened with a buy-side tone, but the auction quickly transitioned into a sell-heavy close. At 15:50, the imbalance showed a modest $300M to buy with an 82% dollar lean and 75% symbol lean, suggesting an early wholesale-style buy imbalance. By 15:51, the market expanded to $364M to buy, with $2.56B in buy interest against $2.20B to sell. That early read was rotational by symbol count, with 382 buys versus 369 sells, but still dollar-positive.
The complexion changed sharply after 15:55. The market peaked near $590M to buy, then flipped hard at 15:56 to more than $1.0B to sell. From there, the MOC remained sell-side into the bell, finishing at 16:00 with a $1.237B net sell imbalance. The final dollar lean was -76.4%, which is particularly notable because it moved well beyond the -66% threshold and indicates a wholesale market sell program rather than simple rotation. Symbol participation was less extreme at -57.0%, showing broad selling, but not as uniform as the dollar pressure.
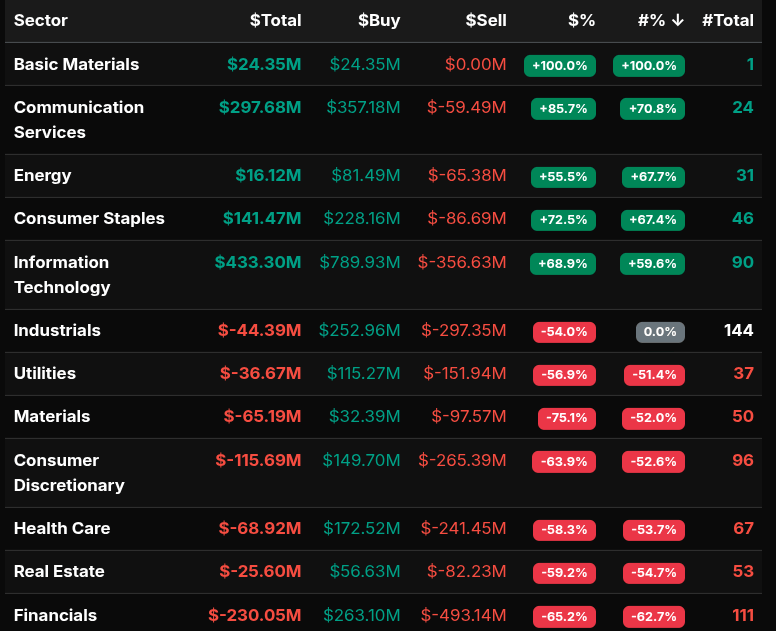
Sector action was mixed but tilted defensive in the selling pressure. Financials were the largest net sell sector at -$230.05M, followed by Consumer Discretionary at -$115.69M, Health Care at -$68.92M, Materials at -$65.19M, Industrials at -$44.39M, Utilities at -$36.67M, and Real Estate at -$25.60M. Materials stood out with a -75.1% dollar lean, a clear wholesale sell read.
On the buy side, Information Technology led with $433.30M net to buy and a +68.9% dollar lean. Communication Services was also strong at $297.68M, with an +85.7% wholesale buy lean. Consumer Staples added $141.47M with a +72.5% dollar lean, while Basic Materials showed a perfect +100% lean on a smaller $24.35M imbalance.
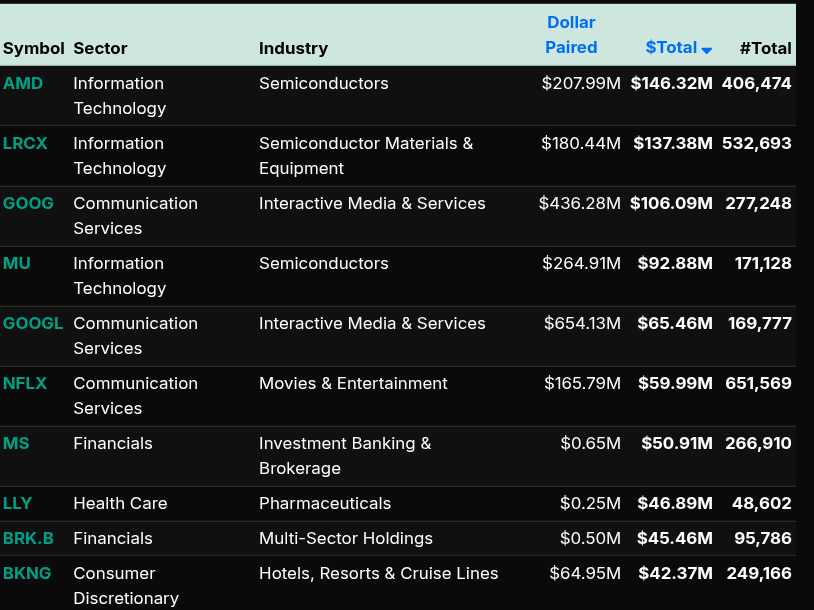
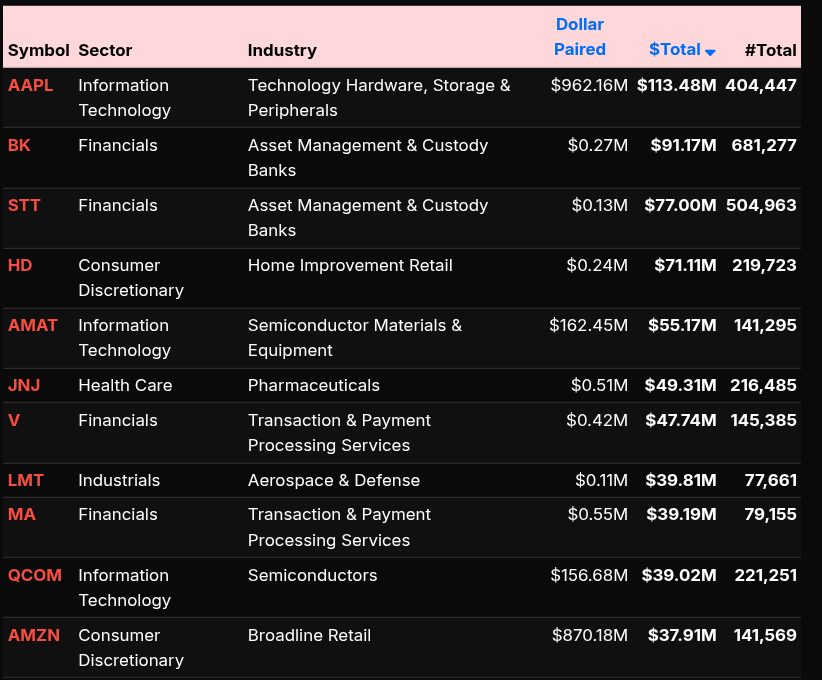
Key stocks bought included AMD, LRCX, GOOG, MU, GOOGL, NFLX, MS, LLY, BRK.B, and BKNG. Major sell imbalances included AAPL, BK, STT, HD, AMAT, JNJ, V, LMT, MA, QCOM, and AMZN. The final read was a late, dollar-heavy sell transition beneath an initially constructive open.
Monday
9:00am – 11:30am, Manny & Tom
12:00pm – 1:30pm, Bo
2:00pm – 2:30pm, Tom
Technical Edge
Fair Values for April 27, 2026
-
SP: 26.06
-
NQ: 118.71
-
Dow: 109.6
Daily Breadth Data 📊
For Friday, May 1, 2026
• NYSE Breadth: 49% Upside Volume
• Nasdaq Breadth: 68% Upside Volume
• Total Breadth: 61% Upside Volume
• NYSE Advance/Decline: 49% Advance
• Nasdaq Advance/Decline: 63% Advance
• Total Advance/Decline: 58% Advance
• NYSE New Highs/New Lows: 169 / 23
• Nasdaq New Highs/New Lows: 393 / 78
• NYSE TRIN: 1.01
• Nasdaq TRIN: 0.80
Weekly Breadth Data 📈
For Week Ending May 1, 2026
• NYSE Breadth: 54% Upside Volume
• Nasdaq Breadth: 54% Upside Volume
• Total Breadth: 54% Upside Volume
• NYSE Advance/Decline: 54% Advance
• Nasdaq Advance/Decline: 53% Advance
• Total Advance/Decline: 53% Advance
• NYSE New Highs/New Lows: 317 / 80
• Nasdaq New Highs/New Lows: 651 / 340
• NYSE TRIN: 1.00
• Nasdaq TRIN: 0.97


ES M
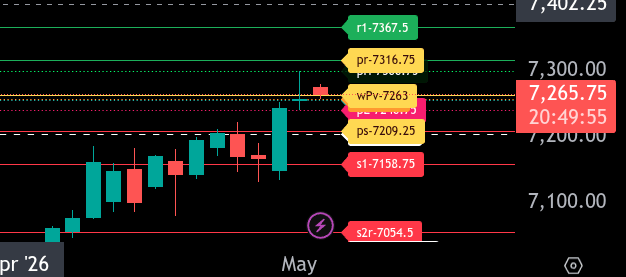
The bull/bear line for the ES is at 7263.00. This is the key level for today’s sentiment. ES is currently trading around 7265.75, which places price slightly above the bull/bear line, but the margin is narrow and needs confirmation with sustained trade above 7263.00.
If ES can continue holding above 7263.00, the first upside focus is 7300.75, followed by 7316.75, the upper range target for today. A clean push above 7316.75 would open the door for a stronger extension toward 7367.50. Bulls need to defend 7263.00 and build acceptance above 7316.75 to keep momentum constructive.
On the downside, initial support comes in at 7258.00, followed by 7240.75. If ES loses 7263.00 and fails to quickly reclaim it, momentum can shift back to neutral or bearish, with 7209.25 as the lower range target. Below 7209.25, additional support sits near 7205.00, and a deeper break could target 7158.75.
Overall, ES is slightly bullish while holding above 7263.00, but the setup is not yet strongly confirmed. The key decision area is the 7263.00 to 7258.00 zone. Holding above it favors a move toward 7300.75 and 7316.75, while losing it puts 7240.75 and 7209.25 back in play.
NQ M
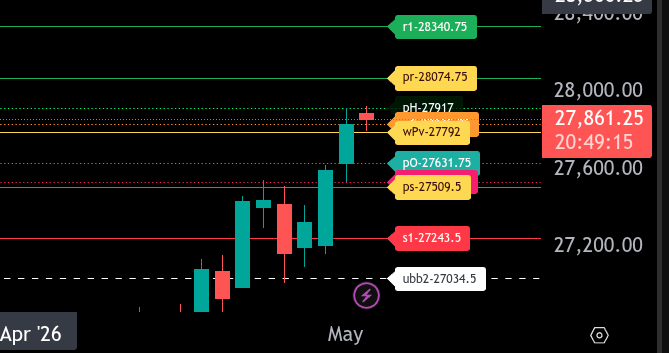
The bull/bear line for the NQ is at 27792.00. This is the key level for today’s sentiment. As long as price holds above 27792.00, the short-term tone remains constructive and dips into support can be watched for potential buying opportunities.
Currently, NQ is trading around 27864.25, which keeps it above the bull/bear line but still below nearby resistance at 27917.00. A push through 27917.00 would open the door for a move toward 28074.75, the upper range target for today. If buyers can sustain trade above 28074.75, the next major upside level is 28340.75.
On the downside, first support is near 27835.75, followed by the bull/bear line at 27792.00. If NQ loses 27792.00 and cannot reclaim it, momentum would shift more cautious and sellers could target 27631.75, then 27536.25, and 27509.50, the lower range target for today.
A deeper break below 27509.50 would increase downside risk toward 27243.50. That level would be the next major support if the overnight strength fades and price begins retracing the prior move.
Overall, NQ remains bullish above 27792.00, with 27917.00 as the first upside hurdle and 28074.75 as the main upper range target. Below 27792.00, the tone weakens, and the focus shifts to 27631.75, 27536.25, and 27509.50 as downside support and target levels.

Polaris Trading Group Summary – Friday, May 1, 2026
Friday was a classic capital preservation Friday. David opened the room by noting that overnight activity was extremely quiet and that the market might be looking to take the day off. With Europe largely closed for the May 1 holiday, expectations were for lighter volume and a more selective trading environment. Even so, the room had a clean bullish framework, and the market delivered by reaching David’s upside target at 7299.
Morning Tone and Market Context
-
David emphasized that Friday is Capital Preservation Day, setting a cautious and disciplined tone.
-
Overnight activity was described as super quiet, suggesting the market might not offer much opportunity.
-
Members noted that much of Europe was closed for the May 1 holiday, which likely contributed to lighter volume.
-
David identified the day as Cycle Day 3, with a positive cycle statistic already secured.
Key Trade Plan
-
The main bullish level was acceptance above 7250 ±5.
-
David’s bull case was that buyers needed to defend value above that pivot.
-
Upside targets were clearly defined:
-
7270
-
7285
-
7299
-
-
The expectation was for orderly trade, controlled tempo, clean inventory, and trend continuation if buyers remained in control.
Positive Trade Outcome
-
The bull case played out well.
-
David later posted: “Whoo Hoo…Clicked the 7299 target.”
-
This was the key positive trade of the session:
-
The plan had a defined pivot.
-
The upside targets were known in advance.
-
The final target was achieved.
-
-
David also highlighted an Open Range TRIFECTA, confirming the value of the morning structure.
Lessons Learned
-
Quiet markets can still produce clean trades when the room follows structure and levels.
-
Capital preservation matters most on Fridays, especially when volume is expected to be lighter.
-
A clear trade plan with defined acceptance levels and targets helps traders avoid emotional decision-making.
-
Diversification through ETFs can reduce single-stock risk in longer-term portfolios.
-
The best trade of the day was not forced; it came from staying aligned with David’s plan.
DTG Room Preview – Monday, May 4, 2026
Geopolitical Focus
-
Markets are focused on Trump’s new “Project Freedom” plan to help guide neutral ships out of the Persian Gulf through the Strait of Hormuz starting Monday.
-
Iran warned that any U.S. interference in the Strait would violate the ceasefire, keeping geopolitical and energy-market risk elevated.
-
U.S.-China tensions are also in focus after China reportedly ordered sanctioned Chinese firms tied to Iranian oil to defy U.S. sanctions.
Corporate News
-
GameStop (GME) made an unsolicited $125/share cash-and-stock bid for eBay (EBAY), valuing the offer around $56B.
-
Ryan Cohen may take the bid directly to eBay shareholders if the board is unreceptive.
-
Cohen argues the combination could create a stronger Amazon competitor, using GameStop’s store footprint for authentication, intake, fulfillment, and live commerce.
Earnings Calendar
-
Premarket earnings include TSN, CNA, ON, and PNW.
-
After the close, key reports include PLTR, PINS, VRTX, WMB and others.
-
Tuesday morning brings a heavier slate including BUD, ADM, ETN, HSBC, KKR, MPC, PYPL, PFE and more.
Economic Calendar
-
The calendar is light, with Factory Orders at 10:00am ET.
-
NY Fed President John Williams speaks at 12:50pm ET.
Market Tone
-
Volatility remains elevated, with the ES 5-day average daily range near 71 points.
-
No whale bias was noted overnight due to light large-trader volume.
-
ES bias remains constructive while price continues to grind higher above the short-term uptrend channel bottom.
Key ES Levels
-
Resistance: 7215/18s
-
Support: 7160/63s, 6950/55s
Affiliate Disclosure: This newsletter may contain affiliate links, which means we may earn a commission if you click through and make a purchase. This comes at no additional cost to you and helps us continue providing valuable content. We only recommend products or services we genuinely believe in. Thank you for your support!
Disclaimer: Charts and analysis are for discussion and education purposes only. I am not a financial advisor, do not give financial advice and am not recommending the buying or selling of any security.
Remember: Not all setups will trigger. Not all setups will be profitable. Not all setups should be taken. These are simply the setups that I have put together for years on my own and what I watch as part of my own “game plan” coming into each day. Good luck!
This post goes out as an email to our subscribers every day and is posted for free here around 2 PM ET. To get your real-time copy, sign up for the free or premium version here: Opening Print Subscribe.
Comments are closed